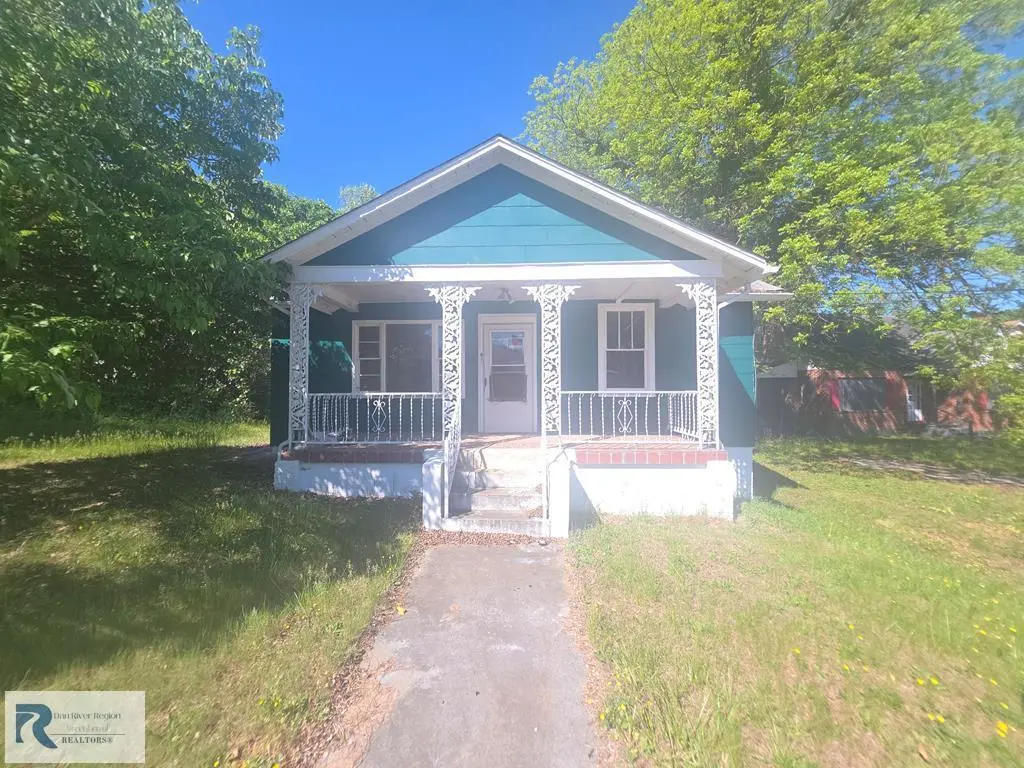
636 Berryman Ave · Danville, VA
Flood risk 1/10 · Minimal
- FEMA flood zone
- X (unshaded)
- Chance of flooding over 30 yrs
- 0.0%
- Est. flood insurance / yr
- $507 – $1,088
Fire risk 1/10 · Minimal
- Est. fire insurance / yr
- $666 – $1,236
Heat risk 6/10 · Moderate
- Hot days now (above 105°F)
- 7 days/yr
- Hot days in 30 yrs
- 19 days/yr
Wind risk 4/10 · Minor
- Chance of severe wind over 30 yrs
- 9.0%
Air-quality risk 2/10 · Minimal
- Unhealthy air days now
- 0 days/yr
- Unhealthy air days in 30 yrs
- 1 days/yr
Risk factors via First Street. Map © Google.
Why this score? — see what drove the B+ grade
The composite is a weighted blend of 9 inputs, each scored 0–100. Each bar is that input's sub-score; the figure is the points it added to the 100-point composite (weight × sub-score).
- Cash flow +30.0/30.0
- ARV discount +15.0/15.0
- 1% rule +10.0/10.0
- DSCR +10.0/10.0
- Livability +3.9/5.0
- Schools +3.0/10.0
- Rent growth +2.5/5.0
- Condition / age +2.5/5.0
- Appreciation +0.0/10.0
$39,000
🖨 Deal sheet 📄 Offer letter ✓ Due diligence
Listing remarks MLS
Very charming home on a hill in the center of town. Great investment property potential. 2 large bedrooms, HUGE dining room, large kitchen with W/ D connections, and roomy living room. Front porch is concrete and terra cotta tile, covered for peaceful enjoyment of goings-on in the neighborhood. Enclosed covered screened-in back porch provides peaceful views to level shaded backyard, and access to crawl space through trap door. Nice painted exterior, central heat & AC. Needs TLC to get it where you want it. Be careful in bathroom due to hole in floor, enter at your own risk.
Key facts
- 3,485 sq ft lot
- Built 1940
- Listed 47 days
Property features AI
Exterior
- Parking: No garage
- Utilities: Public water; Public sewer
- Home design: Residential property
- Construction: Above-grade finished area: 975
- Exterior features: Patio; Porch; Composition roof
Interior
- Bedrooms: 2 main-level bedrooms
- Bathrooms: 1 full bathroom (main level)
- Heating & cooling: Natural gas and electric heating; Floor furnace
- Interior features: Living room fireplace (1); Crawl space basement
Neighborhood map
What this means for you Summary
Snapshot
- This is a 2-bed/1.0-bath single-family listed at $39k.
Deal economics
- At list price, monthly cash flow is $707 ($8k/yr) — positive.
- The deal already cash-flows at list — no discount required.
- Meets the 1% rule at list price ($1k rent vs $39k).
- Recommended offer: $38k (3.0% below list) — sets the bar for market timing.
- Cap rate 28.0% vs local median 5.3% in Danville — top-decile yield for the area; either an underpriced asset or a hidden risk that comps aren't pricing in. Stress-test before assuming the spread holds.
Location & tenants
- Location reads 77/100 on livability (#91 in VA, #2,952 nationally) — a middle-class / working-renter tenant base. Strengths: cost of living A+, housing A+, health & safety A+; Watch: amenities D+, crime D-, commute F.
- Danville City Public School District (town): math 30% / reading 44% proficiency, ranked #128 of 131 in VA (top 98%) — families likely to look elsewhere, expect single-tenant / working-renter base with shorter leases; 71% free/reduced lunch — lower-income household profile, screen leases tightly.
- Market conditions: 245 active listings in the ZIP; 11 comparable units currently listed for rent nearby; rentals lingering (median 44d on market — plan ~5-8 weeks vacancy on turnover, expect pricing pressure); 82% of comp listings sitting > 30 days — soft ceiling on asking rent; 54 units permitted in Danville city in 2024 (40 in 5+ unit buildings).
Forward outlook
- Local home prices are declining (-3.0%/yr); year-one equity from $270 of loan paydown is wiped out by about $1k of value loss. Plan a longer hold.
- Danville County population projected to shrink 7% by 2050 — rents likely to lag national; underwrite the cash flow, not the appreciation.
- At projected returns (-3.0% appreciation + 3.0% rent growth), your $11k cash investment doubles in ~2 years — after that, you're playing with house money.
Negotiation context
- It's been on market 48 days — a 3% lower offer ($38k) is reasonable based on typical stale-listing flexibility.
- 2 sale attempts since 3y ago; this cycle's ask has dropped $21k (35%) from the opening price — seller is motivated, your offer sets the floor, not the list.
Risks & watch-outs
- Watch-outs: built in 1940 — expect roof / HVAC / electrical / plumbing capex.
- Climate carrying-cost: extreme-heat days projected 7→19/yr by 2055 (HVAC capex compounding) — expect insurance premiums to compound above CPI over the hold.
Questions for the listing agent
- It's been on market 48 days. Have you received any prior offers? Is the seller open to a 3% concession, seller financing, or rate buy-down credit?
- Built in 1940 — when were the roof, HVAC, electrical panel, plumbing, and water heater last replaced?
- Is there a deadline driving the sale (1031 exchange, divorce, estate, relocation)? That informs how much negotiation room exists.
- Schools are B-rated — typically a magnet for longer-tenancy family renters. What's the average tenant stay here, and is there a school-zone premium baked into asking?
- Crime grade is D in this area — have there been break-ins, vandalism, or insurance claims at this property in the last 3 years? What carrier currently insures it and at what premium?
- What's the average days-on-market for RENTAL listings here right now (not sales)? A rising rental-DOM trend means longer vacancies and softer asking-rent achievability than the comps imply.
- What's the recent tenant-quality profile in this submarket — average credit score on applications, eviction rate, late-payment / NSF rate, and stable-employment percentage? A property-management company in the area should have these aggregated.
- How much new for-sale + rental construction is in the pipeline within 1–3 miles? Heavy new supply typically softens prices + rents 12–24 months out; constrained supply supports both.
Investment metrics
- 1% rule
- 3.04% ✓
- Cap rate
- 28.05%
- Cash-on-cash
- 77.70%
- DSCR
- 4.46
- GRM
- 2.7
CMA / ARV
- ARV (median comp)
- $65,746
- List price
- $39,000
- Delta
- -40.68%
- Verdict
- UNDERPRICED
- Comps
- 20 within 1.0 mi
Show comp detail 11 sales within ~0.75 mi
| Address | Dist | Beds/Ba | Sqft | Sold | Price | $/sf | Match |
|---|---|---|---|---|---|---|---|
| 818 Stokes St | 0.22mi | 2/1.0 | 986 (+1%) | 0mo | $139,000 | $141 | 88 |
| 663 Lee St | 0.24mi | 2/1.0 | 1,008 (+3%) | 1mo | $139,900 | $139 | 82 |
| 716 Temple Ave | 0.06mi | 1/1.0 (-1) | 915 (-6%) | 1mo | $74,400 | $81 | 82 |
| 730 Temple Ave | 0.09mi | 2/1.0 | 1,022 (+5%) | 8mo | $33,000 | $32 | 81 |
| 645 Cabell St | 0.12mi | 2/1.0 | 922 (-5%) | 22mo | $51,000 | $55 | 67 |
| 923 Riverview St | 0.34mi | 2/1.0 | 1,036 (+6%) | 8mo | $55,000 | $53 | 67 |
| 815 Rison St | 0.48mi | 2/1.0 | 934 (-4%) | 9mo | $104,000 | $111 | 63 |
| 1238 Paxton St | 0.71mi | 2/1.0 | 1,024 (+5%) | 12mo | $112,900 | $110 | 48 |
| 11 Maury St | 0.68mi | 2/1.0 | 892 (-8%) | 13mo | $35,000 | $39 | 43 |
| 1105 Paxton St | 0.52mi | 2/1.0 | 1,100 (+13%) | 14mo | $32,500 | $30 | 43 |
| 867 Lee St | 0.37mi | 3/1.0 (+1) | 828 (-15%) | 22mo | $40,000 | $48 | 34 |
Match score weights: distance 35% · size 25% · config 20% · recency 20%. Top-matched comps best support the ARV.
Projected returns pro-forma
-3.0% appreciation · 3.0% rent growth · sell at horizon
- IRR
- 77.7%
- Equity multiple
- 4.54×
- Total profit
- $38,709
- Equity at exit
- $5,815
- IRR
- 81.3%
- Equity multiple
- 9.39×
- Total profit
- $91,668
- Equity at exit
- $3,372
Cash invested: $10,920 (down + closing). Projections, not guarantees.
Landlord ↔ Tenant lean methodology
- Overall (STATE)
- 55 Moderately Landlord-Leaning
- State Virginia
- 55 Moderately Landlord-Leaning · D+2
- County
- — inherits STATE
- City
- — inherits STATE
ZIP-level market 24541
- Home prices YoY
- -17.1%
- Active inventory
- 245
- Price-to-rent
- 2.7×
Monthly cashflow live
- Estimated rent
- $1,185 high interval (Pro) →
- Mortgage (P&I)
- −$205
- Tax from tax record
- −$8 /mo · $97/yr
- Insurance
- −$16
- HOA
- −$0
- Vacancy / Maint / Mgmt
- −$249
- Net cashflow
- $707
Break-even live
UW: 25.0% down · 7.5% · 30yr · 1.5% tax · 5.0% vac · 8.0% maint · 8.0% mgmt
Financing live
Cash to close
- Down payment
- $9,750
- Closing costs
- $1,170
- Reserves months
- —
- Total cash needed
- —
Loan-product check · same deal, 3 products live
Conventional
25% down · 7.5% · 30yr
- Down + closing
- —
- Monthly P&I
- —
- Monthly cashflow
- —
- DSCR
- —
- Eligible?
- —
Personal DTI + credit; lowest rate.
DSCR
20% down · 8.5% · 30yr
- Down + closing
- —
- Monthly P&I
- —
- Monthly cashflow
- —
- DSCR
- —
- Eligible?
- —
No personal income docs; deal must DSCR.
Hard money
10% down · 12.0% · 12mo
- Down + closing
- —
- Monthly P&I
- —
- Monthly cashflow
- —
- DSCR
- —
- Eligible?
- —
Short-term bridge; refi at stabilization.
Rent comps 11 comps
| Address | Beds | Baths | Sqft | Rent | $/sqft | DOM | Units | Dist |
|---|---|---|---|---|---|---|---|---|
| 315 Lynn St Apt 404 Danville, VA | 2.0 | 2.0 | 1046 | $1,500 | $1.43 | 43d | 1 | 0.44mi |
| 501 Craghead St Danville, VA | 1.0 | 1.0 | 750 | $1,300 | $1.73 | 43d | 1 | 0.46mi |
| 442 Main St Unit 207 Danville, VA | 2.0 | 2.0 | 850 | $1,500 | $1.76 | 43d | 1 | 0.55mi |
| 442 Main St Unit 306 Danville, VA | 1.0 | 1.0 | 660 | $1,200 | $1.82 | 43d | 1 | 0.55mi |
| 601 Bridge St Unit 212 Danville, VA | 1.0 | 1.0 | 1046 | $1,300 | $1.24 | 21d | 1 | 0.55mi |
| 712 Edwin Ct Danville, VA | 2.0 | 1.0 | 969 | $700 | $0.72 | 43d | 1 | 0.56mi |
| 345 Flint St Danville, VA | 2.0 | 1.0 | 888 | $1,200 | $1.35 | 43d | 1 | 0.85mi |
| 219 Montague St Danville, VA | 1.0 | 1.0 | 747 | $850 | $1.14 | 43d | 1 | 0.97mi |
| 317 Dudley St Danville, VA | 2.0 | 1.0 | 840 | $914 | $1.09 | 21d | 1 | 1.29mi |
| 378 Juless St Danville, VA | 2.0 | 1.0 | 780 | $775 | $0.99 | 43d | 1 | 1.49mi |
| 380 Juless St Danville, VA | 2.0 | 1.0 | 780 | $775 | $0.99 | 43d | 1 | 1.49mi |
Listing history 21 events
-
2026-06-17days on market $39,000 Active 48 DOM
-
2026-06-16days on market $39,000 Active 47 DOM
-
2026-06-15days on market $39,000 Active 46 DOM
-
2026-06-14days on market $39,000 Active 44 DOM
-
2026-06-13days on market $39,000 Active 43 DOM
-
2026-06-10days on market $39,000 Active 41 DOM
-
2026-06-09days on market $39,000 Active 40 DOM
-
2026-06-09price $39,000 Active 39 DOM
-
2026-06-08days on market $48,000 Active 39 DOM
-
2026-06-07pricedays on market $48,000 Active 38 DOM
-
2026-06-05days on market $50,000 Active 35 DOM
-
2026-06-02days on market $50,000 Active 33 DOM
-
2026-06-01days on market $50,000 Active 32 DOM
-
2026-05-31days on market $50,000 Active 31 DOM
-
2026-05-30days on market $50,000 Active 30 DOM
-
2026-04-30$59,900 Active 579-char remark
-
2023-12-11soldstatus $39,900
-
2023-12-07soldstatus $39,900 Closed 586-char remark
Show marketing remark (586 chars)
Very charming home on a hill in the center of town. Great investment property potential. 2 large bedrooms, HUGE dining room, large kitchen with W/ D connections, and roomy living room. Front porch is concrete and terra cotta tile, covered for peaceful enjoyment of goings-on in the neighborhood. Enclosed covered screened-in back porch provides peaceful views to level shaded backyard, and access to crawl space through trap door. Nice painted exterior, central heat & AC. Needs TLC to get it where you want it. Be careful in bathroom due to hole in floor, enter at your own risk.
-
2023-10-20$39,900 Active 586-char remark
Show marketing remark (586 chars)
Very charming home on a hill in the center of town. Great investment property potential. 2 large bedrooms, HUGE dining room, large kitchen with W/ D connections, and roomy living room. Front porch is concrete and terra cotta tile, covered for peaceful enjoyment of goings-on in the neighborhood. Enclosed covered screened-in back porch provides peaceful views to level shaded backyard, and access to crawl space through trap door. Nice painted exterior, central heat & AC. Needs TLC to get it where you want it. Be careful in bathroom due to hole in floor, enter at your own risk.
-
2023-05-03soldstatus $9,800
-
2004-05-06soldstatus $10,000
ⓘ Source: listings_history table (triggers on properties + properties_extension) + one-shot
backfill from property_details.listing_events for pre-trigger history.
Tax reassessment forecast VA · Resets to sale price
- Current annual tax
- $97 · $8/mo
- Projected year-2 tax
- $320 · $27/mo
- Expected delta
- +$223/yr (+$19/mo · 229.3%)
ⓘ Screening estimate from a state-policy table — verify with the county assessor before closing.
Climate risk First Street
- Flood 1/10 Low FEMA zone X (unshaded) · 0% chance over 30 yrs
- Wildfire 1/10 Low
- Heat 6/10 Major 7 d/yr ≥105°F today · 19 d/yr by 30 yrs out
- Wind 4/10 Moderate 9% chance of damaging wind over 30 yrs
- Air quality 2/10 Low 0 unhealthy d/yr today · 1 by 30 yrs out
Nearby sold comps map
Loading sold comps map…
Walkable amenities ~0.75 mi
Loading nearby amenities…
Taxation est. · year 1
- Rental income
- $14,217
- − Mortgage interest
- −$2,185
- − Property taxes
- −$97
- − Insurance
- −$195
- − Repairs & maintenance
- −$1,137
- − Management
- −$1,137
- − Depreciation
- −$1,135
- Taxable income
- $8,331
- Est. tax owed @ 24.0%
- −$1,999
- After-tax cash flow
- $6,486/yr
For passive investors: Depreciation is non-cash, so a rental often shows a tax loss while cash-flowing — sheltering income. Rental losses are passive: they offset passive income freely, and up to $25,000/yr can offset ordinary (W-2) income if you actively participate and your MAGI is under $100k (phasing out to $0 by $150k); unused losses carry forward. On sale, claimed depreciation is recaptured at up to 25%, and gains may owe capital-gains tax (a 1031 exchange can defer both). Figures are a year-1 estimate at your 24.0% rate — not tax advice; consult a CPA.
Schools (NCES district)
- District
- Danville City Public School District
- NCES district ID
- 5101110
- Math proficiency
- 30% ▼ -22.00%
- Reading proficiency
- 44% ▼ -8.00%
- Median HH income
- $31,952
- Composite
- 30.23/100
- National rank
- #6298
- State rank
- #128 of 131 in VA
Livability — Danville
- Score
- 77/100
- State rank
- #91
- US rank
- #2952
Category grades
Schools grade is shown separately in the Schools card above.
Census & demographics
- Census place
- Danville, VA
- County
- Danville City · 59,055 people
- City population
- 59,055
- Metro
- Danville, VA
- Population (ZIP)
- 28,042
- Household income
- $51,427
- Rent vs Own
- Severe rent burden
- 1399.0
Population outlook (Danville County) Hauer SSP2
- Today (2025)
- 40,989 people
- By 2030
- 40,432 · -1.4%
- By 2040
- 39,255 · -4.2%
- By 2050
- 38,035 · -7.2%
- By 2075
- 35,612 · -13.1%
- By 2100
- 30,365 · -25.9%
Race, ethnicity, and origin ACS 2023
- Neighborhood character
- Diverse neighborhood (Simpson 0.59)
- Race & ethnicity
- White 50% Black 39% Two or more races 7% Hispanic / Latino 5% Asian 2%
- Common ancestry
- Slovak 2% Serbian 2% Lithuanian 1%
- Foreign-born
- 4% · Canada, Dominican Republic
- Languages at home
- 95% English-only · Spanish 4% Other Indo-European 1%
Political lean MEDSL · Danville
- 2024 margin
- Strong D (+21.1) · D 60.1% · R 39.0%
- 2008→2024 swing
- +1.9pp toward D · 2008: 19.1pp · 2024: 21.1pp
- All cycles
- 2024: D+21.1 2020: D+22.1 2016: D+19.9 2012: D+22.1 2008: D+19.1
Not yet ingested
- Civics
- —
Market trends
- HPI YoY
- ▼ -49.28%
- Current HPI
- 238.5992
- Rent YoY
- —
- Metro
- Danville, VA
- State GDP YoY
- ▲ 2.40%
- F500 in state
- 50
Industry mix (Fortune 500 HQ in VA)
| Industry | F500 HQs | Revenue |
|---|---|---|
| Aerospace / Defense | 4 | $236B |
|
||
| Technology / Defense | 3 | $32B |
|
||
| Financial Services | 2 | $176B |
|
||
| Utilities | 2 | $27B |
|
||
| Insurance | 2 | $25B |
|
||
| Technology | 2 | $15B |
|
||
Price history
+290.0% since first listed9 events — show timeline
- 2026-06-08 Price Changed $39,000 DRRAR
- 2026-06-05 Price Changed $48,000 DRRAR
- 2026-05-20 Price Changed $50,000 DRRAR
- 2026-04-30 Listed $59,900 DRRAR
- 2023-12-11 Sold (Public Records) $39,900 Public Records
- 2023-12-07 Sold (MLS) $39,900 DRRAR
- 2023-10-20 Listed $39,900 DRRAR
- 2023-05-03 Sold (Public Records) $9,800 Public Records
- 2004-05-06 Sold (Public Records) $10,000 Public Records
Property tax history
-1.4%/yrLatest (2025): $97 · +0.0% YoY. Source: county tax records.
Cash-flow waterfall
monthlySold comps — $/sqft
last 12 mo · ≤1 miLoading sold comps…