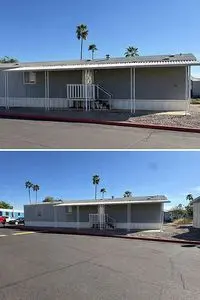
555 W Warner Rd · Chandler, AZ
Flood risk 1/10 · Minimal
- FEMA flood zone
- X (shaded)
- Chance of flooding over 30 yrs
- 0.0%
- Est. flood insurance / yr
- $507 – $1,088
Fire risk 1/10 · Minimal
- Est. fire insurance / yr
- $610 – $1,132
Heat risk 9/10 · Severe
- Hot days now (above 111°F)
- 7 days/yr
- Hot days in 30 yrs
- 19 days/yr
Wind risk 1/10 · Minimal
- Chance of severe wind over 30 yrs
- —
Air-quality risk 2/10 · Minimal
- Unhealthy air days now
- 0 days/yr
- Unhealthy air days in 30 yrs
- 1 days/yr
Risk factors via First Street. Map © Google.
Why this score? — see what drove the B grade
The composite is a weighted blend of 9 inputs, each scored 0–100. Each bar is that input's sub-score; the figure is the points it added to the 100-point composite (weight × sub-score).
- Cash flow +30.0/30.0
- 1% rule +10.0/10.0
- DSCR +10.0/10.0
- ARV discount +7.5/15.0
- Schools +4.8/10.0
- Livability +3.9/5.0
- Condition / age +2.5/5.0
- Rent growth +2.1/5.0
- Appreciation +0.0/10.0
$88,900
🖨 Deal sheet 📄 Offer letter ✓ Due diligence
Listing remarks
3 bed 2 bath manufactured home Leased land- lot rent $760.00 month All ages community - Kon tiki Chandler AZ Split floor plan master bedroom is in the other six of the home with walk in closet, en suite bathroom laundry in hall , new flooring throughout fixed for move in ready home.
Key facts
- Built 1996
- Listed 23 days
Neighborhood map
What this means for you Summary
Snapshot
- This is a 3-bed/2.0-bath land listed at $89k.
Deal economics
- At list price, monthly cash flow is $1k ($18k/yr) — positive.
- The deal already cash-flows at list — no discount required.
- Meets the 1% rule at list price ($3k rent vs $89k).
- Recommended offer: $88k (1.5% below list) — sets the bar for market timing.
- Cap rate 26.1% vs local median 3.3% in Chandler — top-decile yield for the area; either an underpriced asset or a hidden risk that comps aren't pricing in. Stress-test before assuming the spread holds.
Location & tenants
- Location reads 78/100 on livability (#9 in AZ, #2,508 nationally) — a middle-class / working-renter tenant base. Strengths: employment A+, housing A+, crime A-; Watch: health & safety D, cost of living D-.
- Chandler Unified District #80 (4242) (suburban): math 49% / reading 57% proficiency, ranked #31 of 249 in AZ (top 12%) — acceptable for families but not a draw, mixed tenant base, ~2y average lease.
- Market conditions: Rents soft (-1.7%/yr); 182 active listings in the ZIP; 6 comparable units currently listed for rent nearby; rentals leasing fast (median 13d on market — plan ~1-2 weeks tenant-placement turnaround); solid renter incomes; 36,011 units permitted in Maricopa County in 2024 (12,801 in 5+ unit buildings).
- This rent runs 36% of the median local income ($89k/yr) — at the standard rent-burdened threshold; future hikes will face affordability resistance.
Forward outlook
- Local home prices are declining (-3.0%/yr); year-one equity from $615 of loan paydown is wiped out by about $3k of value loss. Plan a longer hold.
- Maricopa County population projected at +38% by 2050 — long-run rental-demand tailwind backs the buy-and-hold thesis.
- At projected returns (-3.0% appreciation + 0.0% rent growth), your $25k cash investment doubles in ~2 years — after that, you're playing with house money.
Negotiation context
- It's been on market 23 days — a 2% lower offer ($88k) is reasonable based on typical stale-listing flexibility.
Risks & watch-outs
- Climate carrying-cost: extreme-heat days projected 7→19/yr by 2055 (HVAC capex compounding) — expect insurance premiums to compound above CPI over the hold.
Questions for the listing agent
- Is there a deadline driving the sale (1031 exchange, divorce, estate, relocation)? That informs how much negotiation room exists.
- Schools are B-rated — typically a magnet for longer-tenancy family renters. What's the average tenant stay here, and is there a school-zone premium baked into asking?
- What's the average days-on-market for RENTAL listings here right now (not sales)? A rising rental-DOM trend means longer vacancies and softer asking-rent achievability than the comps imply.
- What's the recent tenant-quality profile in this submarket — average credit score on applications, eviction rate, late-payment / NSF rate, and stable-employment percentage? A property-management company in the area should have these aggregated.
- How much new for-sale + rental construction is in the pipeline within 1–3 miles? Heavy new supply typically softens prices + rents 12–24 months out; constrained supply supports both.
Investment metrics
- 1% rule
- 2.97% ✓
- Cap rate
- 26.13%
- Cash-on-cash
- 70.84%
- DSCR
- 4.15
- GRM
- 2.8
CMA / ARV
No comps found within radius.
Projected returns pro-forma
-3.0% appreciation · 0.0% rent growth · sell at horizon
- IRR
- 67.0%
- Equity multiple
- 3.87×
- Total profit
- $71,496
- Equity at exit
- $13,255
- IRR
- 70.3%
- Equity multiple
- 7.15×
- Total profit
- $153,060
- Equity at exit
- $7,686
Cash invested: $24,892 (down + closing). Projections, not guarantees.
Landlord ↔ Tenant lean methodology
- Overall (STATE)
- 87 Strongly Landlord-Friendly
- State Arizona
- 87 Strongly Landlord-Friendly · R+3
- County
- — inherits STATE
- City
- — inherits STATE
ZIP-level market 85225
- Home prices YoY
- -28.1%
- Rents YoY
- -1.7%
- Active inventory
- 182
- Price-to-rent
- 2.8×
Monthly cashflow live
- Estimated rent
- $2,638 high interval (Pro) →
- Mortgage (P&I)
- −$466
- Tax est. 1.5%
- −$111 /mo · $1,334/yr
- Insurance
- −$37
- HOA
- −$0
- Vacancy / Maint / Mgmt
- −$554
- Net cashflow
- $1,469
Break-even live
UW: 25.0% down · 7.5% · 30yr · 1.5% tax · 5.0% vac · 8.0% maint · 8.0% mgmt
Financing live
Cash to close
- Down payment
- $22,225
- Closing costs
- $2,667
- Reserves months
- —
- Total cash needed
- —
Loan-product check · same deal, 3 products live
Conventional
25% down · 7.5% · 30yr
- Down + closing
- —
- Monthly P&I
- —
- Monthly cashflow
- —
- DSCR
- —
- Eligible?
- —
Personal DTI + credit; lowest rate.
DSCR
20% down · 8.5% · 30yr
- Down + closing
- —
- Monthly P&I
- —
- Monthly cashflow
- —
- DSCR
- —
- Eligible?
- —
No personal income docs; deal must DSCR.
Hard money
10% down · 12.0% · 12mo
- Down + closing
- —
- Monthly P&I
- —
- Monthly cashflow
- —
- DSCR
- —
- Eligible?
- —
Short-term bridge; refi at stabilization.
Rent comps 6 comps
| Address | Beds | Baths | Sqft | Rent | $/sqft | DOM | Units | Dist |
|---|---|---|---|---|---|---|---|---|
| 650 W Kent Pl Chandler, AZ | 3.0 | 2.5 | 1933 | $2,995 | $1.55 | 4d | 1 | 0.31mi |
| 837 W Baylor Ln Chandler, AZ | 4.0 | 3.0 | 2222 | $2,695 | $1.21 | 43d | 1 | 0.63mi |
| 1168 N Burbank Ct Chandler, AZ | 4.0 | 4.0 | 2222 | $2,900 | $1.31 | 4d | 1 | 0.68mi |
| 532 W Dublin St Chandler, AZ | 3.0 | 2.0 | 2302 | $2,050 | $0.89 | 12d | 1 | 0.89mi |
| 1551 W Ironwood Dr Chandler, AZ | 4.0 | 2.5 | 2186 | $3,000 | $1.37 | 1d | 1 | 1.16mi |
| 1732 W Gary Dr Chandler, AZ | 3.0 | 3.0 | 2648 | $3,100 | $1.17 | 43d | 1 | 1.39mi |
Listing history 17 events
-
2026-06-18days on market $88,900 Active 23 DOM
-
2026-06-17days on market $88,900 Active 22 DOM
-
2026-06-16days on market $88,900 Active 21 DOM
-
2026-06-15days on market $88,900 Active 20 DOM
-
2026-06-13days on market $88,900 Active 18 DOM
-
2026-06-13days on market $88,900 Active 17 DOM
-
2026-06-09days on market $88,900 Active 14 DOM
-
2026-06-08days on market $88,900 Active 13 DOM
-
2026-06-07days on market $88,900 Active 12 DOM
-
2026-06-04days on market $88,900 Active 9 DOM
-
2026-06-03days on market $88,900 Active 8 DOM
-
2026-06-02days on market $88,900 Active 7 DOM
-
2026-06-01days on market $88,900 Active 6 DOM
-
2026-05-31days on market $88,900 Active 5 DOM
-
2026-05-26$88,900 Active
-
1994-05-27soldstatus $3,250,000
-
1983-04-01soldstatus $1,316,000
ⓘ Source: listings_history table (triggers on properties + properties_extension) + one-shot
backfill from property_details.listing_events for pre-trigger history.
Climate risk First Street
- Flood 1/10 Low FEMA zone X (shaded) · 0% chance over 30 yrs
- Wildfire 1/10 Low
- Heat 9/10 Extreme 7 d/yr ≥111°F today · 19 d/yr by 30 yrs out
- Wind 1/10 Low
- Air quality 2/10 Low 0 unhealthy d/yr today · 1 by 30 yrs out
Nearby sold comps map
Loading sold comps map…
Walkable amenities ~0.75 mi
Loading nearby amenities…
Taxation est. · year 1
- Rental income
- $31,653
- − Mortgage interest
- −$4,980
- − Property taxes
- −$1,334
- − Insurance
- −$444
- − Repairs & maintenance
- −$2,532
- − Management
- −$2,532
- − Depreciation
- −$2,586
- Taxable income
- $17,245
- Est. tax owed @ 24.0%
- −$4,139
- After-tax cash flow
- $13,495/yr
For passive investors: Depreciation is non-cash, so a rental often shows a tax loss while cash-flowing — sheltering income. Rental losses are passive: they offset passive income freely, and up to $25,000/yr can offset ordinary (W-2) income if you actively participate and your MAGI is under $100k (phasing out to $0 by $150k); unused losses carry forward. On sale, claimed depreciation is recaptured at up to 25%, and gains may owe capital-gains tax (a 1031 exchange can defer both). Figures are a year-1 estimate at your 24.0% rate — not tax advice; consult a CPA.
Schools (NCES district)
- District
- Chandler Unified District #80 (4242)
- NCES district ID
- 0401870
- Math proficiency
- 49% ▼ -8.00%
- Reading proficiency
- 57% ▼ -2.00%
- Median HH income
- $74,048
- Composite
- 47.54/100
- National rank
- #2268
- State rank
- #31 of 249 in AZ
Livability — Chandler
- Score
- 78/100
- State rank
- #9
- US rank
- #2508
Category grades
Schools grade is shown separately in the Schools card above.
Census & demographics
- Census place
- Chandler, AZ
- County
- Maricopa County · 4,537,380 people
- City population
- 299,016
- Metro
- Phoenix-Mesa-Chandler, AZ
- Population (ZIP)
- 72,297
- Household income
- $88,676
- Rent vs Own
- Severe rent burden
- 2327.0
Population outlook (Maricopa County) Hauer SSP2
- Today (2025)
- 4,979,203 people
- By 2030
- 5,378,229 · +8.0%
- By 2040
- 6,156,598 · +23.6%
- By 2050
- 6,872,376 · +38.0%
- By 2075
- 8,401,270 · +68.7%
- By 2100
- 9,247,439 · +85.7%
Race, ethnicity, and origin ACS 2023
- Neighborhood character
- Diverse neighborhood (Simpson 0.65)
- Race & ethnicity
- White 48% Hispanic / Latino 34% Two or more races 16% Black 7% Asian 6% Native American 2%
- Hispanic origin (detail)
- Mexican 29% Puerto Rican 1%
- Common ancestry
- Romanian 2% Lithuanian 2% Portuguese 1%
- Foreign-born
- 16% · Canada, Vietnam, China
- Languages at home
- 72% English-only · Spanish 21% Vietnamese 1% Chinese 1%
Political lean MEDSL · Maricopa
- 2024 margin
- Toss-up / Even · D 47.7% · R 51.2% · Other 1.1%
- 2008→2024 swing
- +7.1pp toward D · 2008: -10.6pp · 2024: -3.5pp
- All cycles
- 2024: R+3.5 2020: D+2.2 2016: R+3.5 2012: R+12.0 2008: R+10.6
Not yet ingested
- Civics
- —
Market trends
- HPI YoY
- ▼ -128.25%
- Current HPI
- 328.8354
- Rent YoY
- ▼ -1.66%
- Metro
- Phoenix-Mesa-Chandler, AZ
- State GDP YoY
- ▲ 4.54%
- F500 in state
- 20
Industry mix (Fortune 500 HQ in AZ)
| Industry | F500 HQs | Revenue |
|---|---|---|
| Technology | 2 | $13B |
|
||
| Mining / Metals | 1 | $23B |
|
||
| Environmental Services | 1 | $16B |
|
||
| Metals / Steel | 1 | $14B |
|
||
| Technology Distribution | 1 | $9B |
|
||
| Homebuilding | 1 | $8B |
|
||
Price history
-93.2% since first listed3 events — show timeline
- 2026-05-26 Listed $88,900 FSBO.com
- 1994-05-27 Sold (Public Records) $3,250,000 Public Records
- 1983-04-01 Sold (Public Records) $1,316,000 Public Records
Property tax history
+2.2%/yrLatest (2025): $30,177 · +1.6% YoY. Source: county tax records.
Cash-flow waterfall
monthlySold comps — $/sqft
last 12 mo · ≤1 miLoading sold comps…