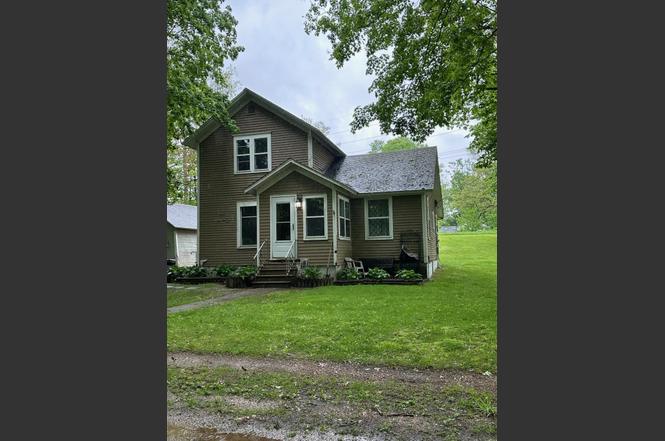
611 Rock River Ave · Three Rivers, MI
Flood risk 1/10 · Minimal
- FEMA flood zone
- X (unshaded)
- Chance of flooding over 30 yrs
- 0.0%
- Est. flood insurance / yr
- $473 – $860
Fire risk 1/10 · Minimal
- Est. fire insurance / yr
- $784 – $1,456
Heat risk 2/10 · Minimal
- Hot days now (above 100°F)
- 7 days/yr
- Hot days in 30 yrs
- 16 days/yr
Wind risk 2/10 · Minimal
- Chance of severe wind over 30 yrs
- —
Air-quality risk 2/10 · Minimal
- Unhealthy air days now
- 1 days/yr
- Unhealthy air days in 30 yrs
- 2 days/yr
Risk factors via First Street. Map © Google.
Why this score? — see what drove the C- grade
The composite is a weighted blend of 9 inputs, each scored 0–100. Each bar is that input's sub-score; the figure is the points it added to the 100-point composite (weight × sub-score).
- Cash flow +17.1/30.0
- ARV discount +15.0/15.0
- DSCR +5.3/10.0
- 1% rule +4.2/10.0
- Schools +3.5/10.0
- Livability +3.5/5.0
- Rent growth +2.5/5.0
- Condition / age +2.5/5.0
- Appreciation +0.0/10.0
$136,000
🖨 Deal sheet 📄 Offer letter ✓ Due diligence
Key facts
- 1.9 acre lot
- Garage
- Built 1940
Neighborhood map
What this means for you Summary
Snapshot
- This is a 3-bed/1.0-bath single-family listed at $136k.
Deal economics
- At list price, monthly cash flow is $94 ($1k/yr) — positive.
- The deal already cash-flows at list — no discount required.
- To meet the 1% rule (rent ≥ 1% of price), the offer needs to be $124k (8.5% below list).
- Recommended offer: $124k (8.5% below list) — sets the bar for 1% rule.
- Cap rate 7.1% vs local median 5.2% in Three Rivers — top-decile yield for the area; either an underpriced asset or a hidden risk that comps aren't pricing in. Stress-test before assuming the spread holds.
Location & tenants
- Location reads 70/100 on livability (#306 in MI) — a middle-class / working-renter tenant base. Strengths: cost of living A+, housing A+, health & safety A+; Watch: schools D+, crime D, amenities F.
- Three Rivers Community Schools (town): math 37% / reading 45% proficiency, ranked #200 of 540 in MI (top 37%) — families likely to look elsewhere, expect single-tenant / working-renter base with shorter leases.
- Market conditions: 178 active listings in the ZIP; 1 comparable units currently listed for rent nearby; 125 units permitted in St. Joseph County in 2024 (0 in 5+ unit buildings).
Forward outlook
- Local home prices are declining (-3.0%/yr); year-one equity from $940 of loan paydown is wiped out by about $4k of value loss. Plan a longer hold.
- St. Joseph County population projected at -16% by 2050 — secular population decline; favor cash flow + early exit over multi-decade hold.
Negotiation context
- Only 1 days on market — expect competitive offers; lowballing is unlikely to land.
- 7 sale attempts since 22y ago with the ask held roughly flat each time — persistent listings suggest the price (not the market) is what's stuck; bring a comps-based counter.
- Current owner paid $25k; list at $136k implies a 446% gain — meaningful room to come down on a strong offer.
Risks & watch-outs
- Watch-outs: built in 1940 — expect roof / HVAC / electrical / plumbing capex.
Questions for the listing agent
- Built in 1940 — when were the roof, HVAC, electrical panel, plumbing, and water heater last replaced?
- Is there a deadline driving the sale (1031 exchange, divorce, estate, relocation)? That informs how much negotiation room exists.
- Schools are D-rated, which usually means shorter tenancies and higher turnover. Who's the typical renter profile here, and what's been the actual vacancy rate?
- Crime grade is D in this area — have there been break-ins, vandalism, or insurance claims at this property in the last 3 years? What carrier currently insures it and at what premium?
- What's the average days-on-market for RENTAL listings here right now (not sales)? A rising rental-DOM trend means longer vacancies and softer asking-rent achievability than the comps imply.
- What's the recent tenant-quality profile in this submarket — average credit score on applications, eviction rate, late-payment / NSF rate, and stable-employment percentage? A property-management company in the area should have these aggregated.
- How much new for-sale + rental construction is in the pipeline within 1–3 miles? Heavy new supply typically softens prices + rents 12–24 months out; constrained supply supports both.
Investment metrics
- 1% rule
- 0.92% ✗
- Cap rate
- 7.12%
- Cash-on-cash
- 2.95%
- DSCR
- 1.13
- GRM
- 9.1
CMA / ARV
- ARV (on-the-fly)
- $177,216
- Comps found
- 9
Show comp detail 9 sales within ~0.75 mi
| Address | Dist | Beds/Ba | Sqft | Sold | Price | $/sf | Match |
|---|---|---|---|---|---|---|---|
| 508 Maple St | 0.15mi | 3/1.5 | 1,366 (+10%) | 1mo | $183,000 | $134 | 74 |
| 815 N Main St | 0.34mi | 3/1.5 | 1,328 (+6%) | 5mo | $240,000 | $181 | 67 |
| 519 N Main St | 0.29mi | 3/1.0 | 1,376 (+10%) | 4mo | $195,000 | $142 | 66 |
| 15731 Hoffman Rd | 0.50mi | 3/1.0 | 1,222 (-2%) | 15mo | $179,000 | $146 | 61 |
| 611 East St | 0.36mi | 3/1.0 | 1,373 (+10%) | 15mo | $170,000 | $124 | 54 |
| 619 Maple St | 0.15mi | 3/2.0 | 1,370 (+10%) | 22mo | $163,300 | $119 | 54 |
| 903 Maple St | 0.26mi | 4/1.5 (+1) | 1,400 (+12%) | 12mo | $180,000 | $129 | 50 |
| 116 N Douglas Ave | 0.67mi | 2/1.0 (-1) | 1,080 (-14%) | 1mo | $176,000 | $163 | 40 |
| — | 0.73mi | 3/2.0 | 1,200 (-4%) | 22mo | $867,500 | $723 | 37 |
Match score weights: distance 35% · size 25% · config 20% · recency 20%. Top-matched comps best support the ARV.
Projected returns pro-forma
-3.0% appreciation · 3.0% rent growth · sell at horizon
- IRR
- -11.7%
- Equity multiple
- 0.58×
- Total profit
- $-16,086
- Equity at exit
- $20,278
- IRR
- -2.5%
- Equity multiple
- 0.83×
- Total profit
- $-6,376
- Equity at exit
- $11,759
Cash invested: $38,080 (down + closing). Projections, not guarantees.
Landlord ↔ Tenant lean methodology
- Overall (STATE)
- 62 Landlord-Friendly
- State Michigan
- 62 Landlord-Friendly · EVEN
- County
- — inherits STATE
- City
- — inherits STATE
ZIP-level market 49093
- Active inventory
- 178
- Price-to-rent
- 9.1×
Monthly cashflow live
- Estimated rent
- $1,245 medium interval (Pro) →
- Mortgage (P&I)
- −$713
- Tax from tax record
- −$120 /mo · $1,441/yr
- Insurance
- −$57
- HOA
- −$0
- Vacancy / Maint / Mgmt
- −$261
- Net cashflow
- $94
Break-even live
UW: 25.0% down · 7.5% · 30yr · 1.5% tax · 5.0% vac · 8.0% maint · 8.0% mgmt
Financing live
Cash to close
- Down payment
- $34,000
- Closing costs
- $4,080
- Reserves months
- —
- Total cash needed
- —
Loan-product check · same deal, 3 products live
Conventional
25% down · 7.5% · 30yr
- Down + closing
- —
- Monthly P&I
- —
- Monthly cashflow
- —
- DSCR
- —
- Eligible?
- —
Personal DTI + credit; lowest rate.
DSCR
20% down · 8.5% · 30yr
- Down + closing
- —
- Monthly P&I
- —
- Monthly cashflow
- —
- DSCR
- —
- Eligible?
- —
No personal income docs; deal must DSCR.
Hard money
10% down · 12.0% · 12mo
- Down + closing
- —
- Monthly P&I
- —
- Monthly cashflow
- —
- DSCR
- —
- Eligible?
- —
Short-term bridge; refi at stabilization.
Rent comps 1 comps
| Address | Beds | Baths | Sqft | Rent | $/sqft | DOM | Units | Dist |
|---|---|---|---|---|---|---|---|---|
| 320 Thomas St Three Rivers, MI | 1.0–2.0 | 1.0–1.5 | 925 | $1,245 | $1.35 | 13d | 4 | 1.09mi |
Listing history 15 events
-
2024-12-17status Pending
-
2024-05-09status Pending
-
2024-05-09historical
-
2024-05-09$136,000
-
2024-05-09$136,000 Active
-
2024-05-09$136,000
-
2024-05-09historical
-
2009-03-12soldstatus $24,900
-
2009-03-12soldstatus $24,900
-
2008-09-18$25,900
-
2008-09-18$25,900
-
2005-07-06soldstatus $78,000
-
2005-07-06soldstatus $78,000
-
2004-09-23$77,700
-
2004-09-23$77,700
ⓘ Source: listings_history table (triggers on properties + properties_extension) + one-shot
backfill from property_details.listing_events for pre-trigger history.
Tax reassessment forecast MI · Partial reset (capped growth)
- Current annual tax
- $1,441 · $120/mo
- Projected year-2 tax
- $1,767 · $147/mo
- Expected delta
- +$327/yr (+$27/mo · 22.7%)
ⓘ Screening estimate from a state-policy table — verify with the county assessor before closing.
Climate risk First Street
- Flood 1/10 Low FEMA zone X (unshaded) · 0% chance over 30 yrs
- Wildfire 1/10 Low
- Heat 2/10 Low 7 d/yr ≥100°F today · 16 d/yr by 30 yrs out
- Wind 2/10 Low
- Air quality 2/10 Low 1 unhealthy d/yr today · 2 by 30 yrs out
Nearby sold comps map
Loading sold comps map…
Walkable amenities ~0.75 mi
Loading nearby amenities…
Taxation est. · year 1
- Rental income
- $14,940
- − Mortgage interest
- −$7,618
- − Property taxes
- −$1,441
- − Insurance
- −$680
- − Repairs & maintenance
- −$1,195
- − Management
- −$1,195
- − Depreciation
- −$3,956
- Taxable loss
- −$1,145
- Est. tax savings @ 24.0%
- +$275
- After-tax cash flow
- $1,399/yr
For passive investors: Depreciation is non-cash, so a rental often shows a tax loss while cash-flowing — sheltering income. Rental losses are passive: they offset passive income freely, and up to $25,000/yr can offset ordinary (W-2) income if you actively participate and your MAGI is under $100k (phasing out to $0 by $150k); unused losses carry forward. On sale, claimed depreciation is recaptured at up to 25%, and gains may owe capital-gains tax (a 1031 exchange can defer both). Figures are a year-1 estimate at your 24.0% rate — not tax advice; consult a CPA.
Schools (NCES district)
- District
- Three Rivers Community Schools
- NCES district ID
- 2633840
- Math proficiency
- 37% ▲ 1.00%
- Reading proficiency
- 45% ▼ -3.00%
- Median HH income
- $46,576
- Composite
- 34.97/100
- National rank
- #5058
- State rank
- #200 of 540 in MI
Livability — Three Rivers
- Score
- 70/100
- State rank
- #306
- US rank
- #7604
Category grades
Schools grade is shown separately in the Schools card above.
Census & demographics
- Census place
- Three Rivers, MI
- Population (ZIP)
- 18,439
Population outlook (St. Joseph County) Hauer SSP2
- Today (2025)
- 58,726 people
- By 2030
- 57,030 · -2.9%
- By 2040
- 53,266 · -9.3%
- By 2050
- 49,343 · -16.0%
- By 2075
- 40,441 · -31.1%
- By 2100
- 31,981 · -45.5%
Race, ethnicity, and origin ACS 2023
- Neighborhood character
- Predominantly White (84%)
- Race & ethnicity
- White 84% Two or more races 8% Hispanic / Latino 5% Black 5%
- Hispanic origin (detail)
- Mexican 4%
- Common ancestry
- Italian 11% Iranian 5% Romanian 3%
- Foreign-born
- 2% · Canada
- Languages at home
- 95% English-only · Spanish 3% Other Indo-European 1%
Political lean MEDSL · St. Joseph
- 2024 margin
- Solid R (+34.0) · D 32.2% · R 66.2% · Other 1.5%
- 2008→2024 swing
- -31.8pp toward R · 2008: -2.2pp · 2024: -34.0pp
- All cycles
- 2024: R+34.0 2020: R+31.7 2016: R+31.0 2012: R+12.3 2008: R+2.2
Not yet ingested
- Civics
- —
Market trends
- HPI YoY
- ▼ -159.07%
- Current HPI
- 226.5079
- Rent YoY
- —
- Metro
- —
- State GDP YoY
- ▲ 1.37%
- F500 in state
- 28
Industry mix (Fortune 500 HQ in MI)
| Industry | F500 HQs | Revenue |
|---|---|---|
| Automotive Parts | 3 | $48B |
|
||
| Automotive | 2 | $372B |
|
||
| Chemicals | 1 | $45B |
|
||
| Automotive Retail | 1 | $29B |
|
||
| Healthcare / Medical Devices | 1 | $23B |
|
||
| Automotive Technology | 1 | $20B |
|
||
Price history
+75.0% since first listed15 events — show timeline
- 2024-12-17 Pending — REALCOMP
- 2024-05-09 Pending — SW Michigan MLS
- 2024-05-09 Listing Removed — MiRealSource-MiMLS
- 2024-05-09 Listed $136,000 MiRealSource-MiMLS
- 2024-05-09 Listed $136,000 SW Michigan MLS
- 2024-05-09 Listed $136,000 REALCOMP
- 2024-05-09 Listing Removed — REALCOMP
- 2009-03-12 Sold (MLS) $24,900 REALCOMP
- 2009-03-12 Sold (MLS) $24,900 SW Michigan MLS
- 2008-09-18 Listed $25,900 REALCOMP
- 2008-09-18 Listed $25,900 SW Michigan MLS
- 2005-07-06 Sold (MLS) $78,000 REALCOMP
- 2005-07-06 Sold (MLS) $78,000 SW Michigan MLS
- 2004-09-23 Listed $77,700 REALCOMP
- 2004-09-23 Listed $77,700 SW Michigan MLS
Property tax history
+4.5%/yrLatest (2025): $1,441 · -36.9% YoY. Source: county tax records.
Cash-flow waterfall
monthlySold comps — $/sqft
last 12 mo · ≤1 miLoading sold comps…