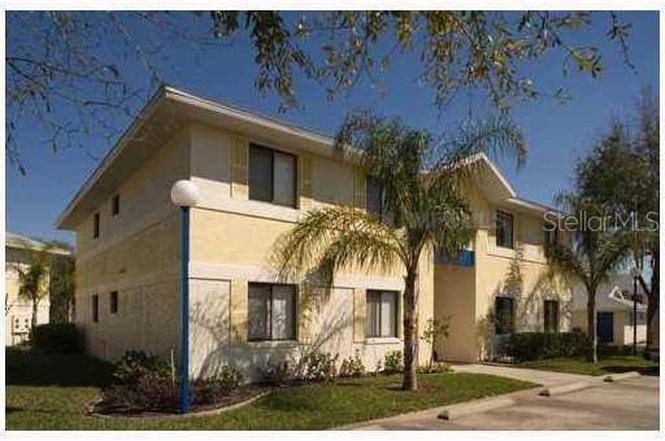
90 Hidden Lake Dr #178 · Sanford, FL
Flood risk 1/10 · Minimal
- FEMA flood zone
- X (unshaded)
- Chance of flooding over 30 yrs
- 0.0%
- Est. flood insurance / yr
- $507 – $1,088
Fire risk 1/10 · Minimal
- Est. fire insurance / yr
- $947 – $1,759
Heat risk 8/10 · Major
- Hot days now (above 107°F)
- 7 days/yr
- Hot days in 30 yrs
- 21 days/yr
Wind risk 9/10 · Severe
- Chance of severe wind over 30 yrs
- 99.0%
Air-quality risk 2/10 · Minimal
- Unhealthy air days now
- 1 days/yr
- Unhealthy air days in 30 yrs
- 1 days/yr
Risk factors via First Street. Map © Google.
Why this score? — see what drove the D grade
The composite is a weighted blend of 9 inputs, each scored 0–100. Each bar is that input's sub-score; the figure is the points it added to the 100-point composite (weight × sub-score).
- Cash flow +12.5/30.0
- ARV discount +7.5/15.0
- 1% rule +5.8/10.0
- Schools +5.1/10.0
- DSCR +3.7/10.0
- Livability +3.7/5.0
- Rent growth +2.9/5.0
- Condition / age +2.5/5.0
- Appreciation +0.0/10.0
$169,000
🖨 Deal sheet (PDF) 📄 Offer letter ✓ Due diligence
Listing remarks MLS
SHORT SALE, PRE APPROVED- CLOSE FAST . This is a beautiful condo in a great location. An Excellent Opportunity !! UNBELIEVABLE VALUE! 2 Bedroom/2 Full BathSold AS-IS PRE- APPROVED SHORT SALE UNBELIEVABLE VALUE! Fabulous 2 Bedroom/2 Full Bath Condominium featuring a spacious Kitchen . Second floor unit with screened lanai. Building is solid block construction from ground to roof, including solid concrete between the 1st and 2nd floor for increased sound insulation. Community amenities include play ground and swimming pool & lounge deck
Key facts
- Spacious kitchen
- Screened lanai
- Swimming pool
Tags
Property features AI
Finance
- Other: No lease restrictions reported; Association approval not required
- Financial info: Total monthly fees $270; total annual fees $3,240
- HOA & community: HOA: Villas Du Soleil Condo Association; Monthly HOA fee $270 (includes pool, maintenance structure, and grounds); Community amenities: pool, playground, association-owned recreation; Pets allowed
Exterior
- Parking: No parking details provided
- Security: Fire sprinkler system; Smoke detectors
- Utilities: Public water; Public sewer; Electricity connected; Cable connected
- Home design: Residential condominium; 2 total stories; One level living; Facing north
- Construction: Block and stucco construction; Shingle roof; Slab foundation; Building/unit in building number 90; Built area approximately 1021 (public records)
- Exterior features: Rear screened porch; Balcony; Outdoor storage; Corner lot; Asphalt road surface; Trees and landscaped grounds
Interior
- Kitchen: Dishwasher; Range hood; Disposal
- Bedrooms: 2 bedrooms
- Flooring: Ceramic tile; Laminate
- Bathrooms: 2 full bathrooms
- Heating & cooling: Central heating (electric); Central air conditioning
- Interior features: Ceiling fans; Open floor plan; Walk-in closets; Blinds
- Laundry & utility: Laundry closet; Washer; Dryer
Neighborhood map
What this means for you Summary
Snapshot
- This is a 2-bed/2.0-bath condo listed at $169k.
Deal economics
- At list price, monthly cash flow is $-24 ($-289/yr) — negative.
- To cash-flow at today's rent, offer at most $165k (2.5% below list).
- Meets the 1% rule at list price ($2k rent vs $169k).
- Recommended offer: $149k (12.0% below list) — sets the bar for market timing.
- Cap rate 6.1% vs local median 3.6% in Sanford — top-decile yield for the area; either an underpriced asset or a hidden risk that comps aren't pricing in. Stress-test before assuming the spread holds.
Location & tenants
- Location reads 73/100 on livability (#316 in FL) — a middle-class / working-renter tenant base. Strengths: cost of living A+, housing A+, health & safety A+; Watch: employment C-, crime F, amenities F.
- Seminole (suburban): math 57% / reading 61% proficiency, ranked #13 of 73 in FL (top 18%) — acceptable for families but not a draw, mixed tenant base, ~2y average lease.
- Zoned schools: Crystal Lake Elementary School (math 59% / reading 69%, grade B, #552 of 2,144 statewide, top 26%, 700 students, 48% FRL); Millennium Middle School (math 46% / reading 48%, grade D+, #291 of 571 statewide, top 52%, 1,347 students, 70% FRL); Seminole High School (math 35% / reading 51%, grade F, #255 of 667 statewide, top 39%, 4,036 students, 53% FRL) — zoned schools average 57% FRL vs 38% district-wide (19 pts higher); higher-poverty schools than district average — tighter screening recommended.
- Market conditions: Rents rising (+1.4%/yr); 287 active listings in the ZIP; 31 comparable units currently listed for rent nearby; rentals leasing fast (median 13d on market — plan ~1-2 weeks tenant-placement turnaround); 1,979 units permitted in Seminole County in 2024 (1,191 in 5+ unit buildings).
- This rent runs 31% of the median local income ($70k/yr) — at the standard rent-burdened threshold; future hikes will face affordability resistance.
Forward outlook
- Local home prices are declining (-3.0%/yr); year-one equity from $1k of loan paydown is wiped out by about $5k of value loss. Plan a longer hold.
- Seminole County population projected at +24% by 2050 — long-run rental-demand tailwind backs the buy-and-hold thesis.
Negotiation context
- It's been on market 142 days — a 12% lower offer ($149k) is reasonable based on typical stale-listing flexibility.
- 3 sale attempts since 17y ago with the ask held roughly flat each time — persistent listings suggest the price (not the market) is what's stuck; bring a comps-based counter.
- Current owner paid $108k; list at $169k implies a 56% gain — meaningful room to come down on a strong offer.
Risks & watch-outs
- Climate carrying-cost: severe wind risk, 99% chance of damaging wind over 30y; extreme-heat days projected 7→21/yr by 2055 (HVAC capex compounding) — expect insurance premiums to compound above CPI over the hold.
Questions for the listing agent
- What do current leases actually rent for vs. the listed asking? Can we see a recent rent roll and the last 12 months of T-12 income?
- It's been on market 142 days. Have you received any prior offers? Is the seller open to a 12% concession, seller financing, or rate buy-down credit?
- What does the HOA fee cover, when was the last increase, and are there any pending special assessments or reserve-fund shortfalls?
- Any open or pending special assessments — roof, HVAC, plumbing, elevator, façade? What's the per-unit balance and payoff schedule, and is the seller paying it off at close or rolling it to the buyer?
- Why hasn't it sold? Are there any deal-killer items the seller is aware of (foundation, flood, title, zoning, code violations)?
- Is there a deadline driving the sale (1031 exchange, divorce, estate, relocation)? That informs how much negotiation room exists.
- Schools are B-rated — typically a magnet for longer-tenancy family renters. What's the average tenant stay here, and is there a school-zone premium baked into asking?
- Crime grade is F in this area — have there been break-ins, vandalism, or insurance claims at this property in the last 3 years? What carrier currently insures it and at what premium?
- The area grade is low — what's the realistic commute time and amenity access for the typical tenant pool here? Any planned neighborhood developments (good or bad) we should know about?
- What's the average days-on-market for RENTAL listings here right now (not sales)? A rising rental-DOM trend means longer vacancies and softer asking-rent achievability than the comps imply.
- What's the recent tenant-quality profile in this submarket — average credit score on applications, eviction rate, late-payment / NSF rate, and stable-employment percentage? A property-management company in the area should have these aggregated.
- How much new apartment / multifamily construction is in the pipeline within 1–3 miles? Heavy new supply (>2% of stock underway) typically softens rents 12–24 months out; light construction supports rent growth.
Investment metrics
- 1% rule
- 1.08% ✓
- Cap rate
- 6.12%
- Cash-on-cash
- -0.61%
- DSCR
- 0.97
- GRM
- 7.7
CMA / ARV
No comps found within radius.
Projected returns pro-forma
-3.0% appreciation · 1.45% rent growth · sell at horizon
- IRR
- -19.4%
- Equity multiple
- 0.33×
- Total profit
- $-31,519
- Equity at exit
- $25,198
- IRR
- -16.4%
- Equity multiple
- 0.16×
- Total profit
- $-39,739
- Equity at exit
- $14,612
Cash invested: $47,320 (down + closing). Projections, not guarantees.
Landlord ↔ Tenant lean methodology
- Overall (STATE)
- 87 Strongly Landlord-Friendly
- State Florida
- 87 Strongly Landlord-Friendly · R+3
- County
- — inherits STATE
- City
- — inherits STATE
ZIP-level market 32773
- Home prices YoY
- -27.8%
- Rents YoY
- 1.4%
- Active inventory
- 287
- Price-to-rent
- 7.7×
Monthly cashflow live
- Estimated rent
- $1,831 high interval (Pro) →
- Mortgage (P&I)
- −$886
- Tax from tax record
- −$244 /mo · $2,925/yr
- Insurance
- −$70
- HOA
- −$270
- Vacancy / Maint / Mgmt
- −$384
- Net cashflow
- $-24
Break-even live
Sensitivity live
| Price | -10% $72 | -5% $24 | +0% $-24 | +5% $-72 | +10% $-120 |
|---|---|---|---|---|---|
| Rent | -10% $-169 | -5% $-96 | +0% $-24 | +5% $48 | +10% $121 |
| Rate | -1.0pp $61 | -0.5pp $19 | base $-24 | +0.5pp $-68 | +1.0pp $-112 |
UW: 25.0% down · 7.5% · 30yr · 1.5% tax · 5.0% vac · 8.0% maint · 8.0% mgmt
Financing live
Cash to close
- Down payment
- $42,250
- Closing costs
- $5,070
- Reserves months
- —
- Total cash needed
- —
Loan-product check · same deal, 3 products live
Conventional
25% down · 7.5% · 30yr
- Down + closing
- —
- Monthly P&I
- —
- Monthly cashflow
- —
- DSCR
- —
- Eligible?
- —
Personal DTI + credit; lowest rate.
DSCR
20% down · 8.5% · 30yr
- Down + closing
- —
- Monthly P&I
- —
- Monthly cashflow
- —
- DSCR
- —
- Eligible?
- —
No personal income docs; deal must DSCR.
Hard money
10% down · 12.0% · 12mo
- Down + closing
- —
- Monthly P&I
- —
- Monthly cashflow
- —
- DSCR
- —
- Eligible?
- —
Short-term bridge; refi at stabilization.
Rent comps 31 comps
| Address | Beds | Baths | Sqft | Rent | $/sqft | DOM | Units | Dist |
|---|---|---|---|---|---|---|---|---|
| 166 Lakeside Dr Sanford, FL | 3.0 | 1.0 | 1250 | $2,065 | $1.65 | 7d | 1 | 0.29mi |
| 100 Sweet Gum Ct Sanford, FL | 3.0 | 2.0 | 1315 | $1,995 | $1.52 | 7d | 1 | 0.49mi |
| 1036 Laurel Ridge Ln Sanford, FL | 3.0 | 2.5 | 1489 | $2,200 | $1.48 | 0d | 1 | 0.49mi |
| 801 Northlake Dr #801 Sanford, FL | 2.0 | 2.0 | 912 | $1,400 | $1.54 | 26d | 1 | 0.51mi |
| 120 Bent Oak Ct Sanford, FL | 3.0 | 2.0 | 1064 | $2,150 | $2.02 | 20d | 1 | 0.54mi |
| 305 Northlake Dr Sanford, FL | 2.0 | 2.0 | 912 | $1,345 | $1.47 | 26d | 1 | 0.57mi |
| 120 Sandpoint Ct Sanford, FL | 3.0 | 2.0 | 1462 | $2,300 | $1.57 | 22d | 1 | 0.79mi |
| 124 Clear Lake Cir Sanford, FL | 2.0 | 2.0 | 1116 | $1,650 | $1.48 | 24d | 1 | 0.97mi |
| 124 Clear Lake Cir Sanford, FL | 2.0 | 2.0 | 1116 | $1,650 | $1.48 | 22d | 1 | 0.97mi |
| 104 Hazel Blvd Sanford, FL | 3.0 | 2.0 | 1478 | $2,056 | $1.39 | 0d | 1 | 1.01mi |
| 423 Wilton Cir Sanford, FL | 2.0 | 2.5 | 1144 | $1,700 | $1.49 | 18d | 1 | 1.11mi |
| 429 Wilton Cir Sanford, FL | 3.0 | 2.5 | 1420 | $1,950 | $1.37 | 26d | 1 | 1.12mi |
| 500 W Airport Blvd Sanford, FL | 1.0–3.0 | 1.0–2.0 | 862 | $1,734 | $2.01 | 4d | 7 | 1.14mi |
| 102 Wilton Cir Unit 102 Sanford, FL | 3.0 | 2.5 | 1420 | $1,800 | $1.27 | 13d | 1 | 1.16mi |
| 102 Wilton Cir Unit 102 Sanford, FL | 3.0 | 2.5 | 1420 | $1,800 | $1.27 | 14d | 1 | 1.16mi |
| 506 Wilton Cir Sanford, FL | 2.0 | 2.5 | 1144 | $1,675 | $1.46 | 20d | 1 | 1.17mi |
| 1000 Stonebrook Dr Sanford, FL | 1.0–3.0 | 1.0–2.0 | 1000 | $1,854 | $1.85 | 0d | 19 | 1.20mi |
| 300 W Airport Blvd Sanford, FL | 2.0 | 1.0 | 687 | $1,595 | $2.32 | 18d | 9 | 1.21mi |
| 3560 Windleshore Way Sanford, FL | 3.0 | 2.5 | 1420 | $1,795 | $1.26 | 4d | 1 | 1.28mi |
| 3360 Windleshore Way Sanford, FL | 3.0 | 2.5 | 1420 | $2,000 | $1.41 | 5d | 1 | 1.29mi |
| 902 Vineland Pl Lake Mary, FL | 2.0 | 2.5 | 1095 | $1,750 | $1.60 | 0d | 1 | 1.30mi |
| 2865 Woodlands Park Ct Unit 2865 Lake Mary, FL | 2.0 | 1.5 | 1095 | $1,650 | $1.51 | 5d | 1 | 1.30mi |
| 500 Fox Quarry Ln Sanford, FL | 1.0–4.0 | 1.0–3.0 | 1134 | $1,372 | $1.21 | 4d | 16 | 1.30mi |
| 2912 Woodlands Park Ct Lake Mary, FL | 2.0 | 2.5 | 1095 | $1,780 | $1.63 | 26d | 1 | 1.33mi |
| 3251 Windleshore Way Sanford, FL | 2.0 | 2.5 | 1056 | $1,950 | $1.85 | 13d | 1 | 1.33mi |
| 3141 Windleshore Way Sanford, FL | 2.0 | 2.5 | 1144 | $1,800 | $1.57 | 20d | 1 | 1.33mi |
| 5361 Windsor Lake Cir Sanford, FL | 3.0 | 2.5 | 1420 | $1,900 | $1.34 | 0d | 1 | 1.34mi |
| 3036 Dellcrest Pl Lake Mary, FL | 3.0 | 2.0 | 1369 | $2,200 | $1.61 | 18d | 1 | 1.35mi |
| 7021 Kirkland Way Lake Mary, FL | 2.0 | 2.0 | 1020 | $1,850 | $1.81 | 7d | 1 | 1.39mi |
| 929 Old Mail Ln Sanford, FL | 3.0 | 2.0 | 1429 | $2,225 | $1.56 | 13d | 1 | 1.39mi |
| 188 E Crystal Lake Ave Lake Mary, FL | 1.0–3.0 | 1.0–2.0 | 950 | $1,870 | $1.97 | 0d | 7 | 1.41mi |
HOA detail condo
- Monthly dues
- $270 · $3,240/yr
- Likely covers
- pool
- Assessments
- None detected in remarks — confirm with the listing agent.
Listing history 9 events
-
2026-05-31days on market $169,000 Active 142 DOM
-
2026-01-09$169,000 Active
-
2021-03-19soldstatus $108,000
-
2017-02-28soldstatus $80,000
-
2017-02-20soldstatus $60,000
-
2010-11-30soldstatus $38,000 551-char remark
Show marketing remark (551 chars)
SHORT SALE, PRE APPROVED- CLOSE FAST . This is a beautiful condo in a great location. An Excellent Opportunity !! UNBELIEVABLE VALUE! 2 Bedroom/2 Full BathSold AS-IS PRE- APPROVED SHORT SALE UNBELIEVABLE VALUE! Fabulous 2 Bedroom/2 Full Bath Condominium featuring a spacious Kitchen . Second floor unit with screened lanai. Building is solid block construction from ground to roof, including solid concrete between the 1st and 2nd floor for increased sound insulation. Community amenities include play ground and swimming pool & lounge deck
-
2010-01-26$39,500 551-char remark
Show marketing remark (551 chars)
SHORT SALE, PRE APPROVED- CLOSE FAST . This is a beautiful condo in a great location. An Excellent Opportunity !! UNBELIEVABLE VALUE! 2 Bedroom/2 Full BathSold AS-IS PRE- APPROVED SHORT SALE UNBELIEVABLE VALUE! Fabulous 2 Bedroom/2 Full Bath Condominium featuring a spacious Kitchen . Second floor unit with screened lanai. Building is solid block construction from ground to roof, including solid concrete between the 1st and 2nd floor for increased sound insulation. Community amenities include play ground and swimming pool & lounge deck
-
2010-01-25historical
-
2009-12-08$54,900
ⓘ Source: listings_history table (triggers on properties + properties_extension) + one-shot
backfill from property_details.listing_events for pre-trigger history.
Tax reassessment forecast FL · Resets to sale price
- Current annual tax
- $2,925 · $244/mo
- Projected year-2 tax
- $2,925 · $244/mo
- Expected delta
- $0/yr ($0/mo · 0.0%)
ⓘ Screening estimate from a state-policy table — verify with the county assessor before closing.
Climate risk First Street
- Flood 1/10 Low FEMA zone X (unshaded) · 0% chance over 30 yrs
- Wildfire 1/10 Low
- Heat 8/10 Severe 7 d/yr ≥107°F today · 21 d/yr by 30 yrs out
- Wind 9/10 Extreme 99% chance of damaging wind over 30 yrs
- Air quality 2/10 Low 1 unhealthy d/yr today · 1 by 30 yrs out
Nearby sold comps map
Loading sold comps map…
Walkable amenities ~0.75 mi
Loading nearby amenities…
Taxation est. · year 1
- Rental income
- $21,970
- − Mortgage interest
- −$9,467
- − Property taxes
- −$2,925
- − Insurance
- −$845
- − Repairs & maintenance
- −$1,758
- − Management
- −$1,758
- − HOA
- −$3,240
- − Depreciation
- −$4,916
- Taxable loss
- −$2,939
- Est. tax savings @ 24.0%
- +$705
- After-tax cash flow
- $416/yr
For passive investors: Depreciation is non-cash, so a rental often shows a tax loss while cash-flowing — sheltering income. Rental losses are passive: they offset passive income freely, and up to $25,000/yr can offset ordinary (W-2) income if you actively participate and your MAGI is under $100k (phasing out to $0 by $150k); unused losses carry forward. On sale, claimed depreciation is recaptured at up to 25%, and gains may owe capital-gains tax (a 1031 exchange can defer both). Figures are a year-1 estimate at your 24.0% rate — not tax advice; consult a CPA.
Schools (NCES district)
- District
- Seminole
- NCES district ID
- 1201710
- Math proficiency
- 57% ▼ -7.00%
- Reading proficiency
- 61% ▼ -1.00%
- Median HH income
- $58,478
- Composite
- 51.05/100
- National rank
- #1769
- State rank
- #13 of 73 in FL
Livability — Sanford
- Score
- 73/100
- State rank
- #316
- US rank
- #5359
Category grades
Schools grade is shown separately in the Schools card above.
Census & demographics
- Census place
- Sanford, FL
- County
- Seminole County · 436,154 people
- City population
- 96,638
- Metro
- Orlando-Kissimmee-Sanford, FL
- Population (ZIP)
- 34,032
- Household income
- $70,442
- Rent vs Own
- Severe rent burden
- 1516.0
Population outlook (Seminole County) Hauer SSP2
- Today (2025)
- 515,494 people
- By 2030
- 545,713 · +5.9%
- By 2040
- 598,068 · +16.0%
- By 2050
- 640,663 · +24.3%
- By 2075
- 724,461 · +40.5%
- By 2100
- 755,530 · +46.6%
Race, ethnicity, and origin ACS 2023
- Neighborhood character
- Highly diverse neighborhood (Simpson 0.70)
- Race & ethnicity
- White 43% Hispanic / Latino 26% Black 20% Two or more races 16% Asian 7%
- Hispanic origin (detail)
- Mexican 3% Puerto Rican 12% Cuban 2% Dominican 2%
- Common ancestry
- Romanian 2% Slovak 1% Hispanic 1%
- Foreign-born
- 17% · Canada, Vietnam, Jamaica
- Languages at home
- 72% English-only · Spanish 21% Vietnamese 3% Other Indo-European 2%
Political lean MEDSL · Seminole
- 2024 margin
- Toss-up / Even · D 47.6% · R 51.1% · Other 1.3%
- 2008→2024 swing
- -0.8pp no change · 2008: -2.8pp · 2024: -3.5pp
- All cycles
- 2024: R+3.5 2020: D+2.8 2016: R+1.6 2012: R+6.5 2008: R+2.8
Not yet ingested
- Civics
- —
Market trends
- HPI YoY
- ▼ -126.55%
- Current HPI
- 328.5485
- Rent YoY
- ▲ 1.45%
- Metro
- Orlando-Kissimmee-Sanford, FL
- State GDP YoY
- ▲ 3.28%
- F500 in state
- 36
Industry mix (Fortune 500 HQ in FL)
| Industry | F500 HQs | Revenue |
|---|---|---|
| Industrial Technology | 2 | $29B |
|
||
| Insurance | 2 | $17B |
|
||
| Retail | 1 | $60B |
|
||
| Technology Distribution | 1 | $58B |
|
||
| Homebuilding | 1 | $35B |
|
||
| Technology Manufacturing | 1 | $35B |
|
||
Price history
+207.8% since first listed8 events — show timeline
- 2026-01-09 Listed $169,000 Stellar MLS as Distributed by MLS Grid
- 2021-03-19 Sold (Public Records) $108,000 Public Records
- 2017-02-28 Sold (Public Records) $80,000 Public Records
- 2017-02-20 Sold (Public Records) $60,000 Public Records
- 2010-11-30 Sold (MLS) $38,000 Stellar MLS as Distributed by MLS Grid
- 2010-01-26 Listed $39,500 Stellar MLS as Distributed by MLS Grid
- 2010-01-25 Listing Removed — Stellar MLS as Distributed by MLS Grid
- 2009-12-08 Listed $54,900 Stellar MLS as Distributed by MLS Grid
Property tax history
+27.6%/yrLatest (2025): $2,925 · +8.0% YoY. Source: county tax records.
Cash-flow waterfall
monthlySold comps — $/sqft
last 12 mo · ≤1 miLoading sold comps…