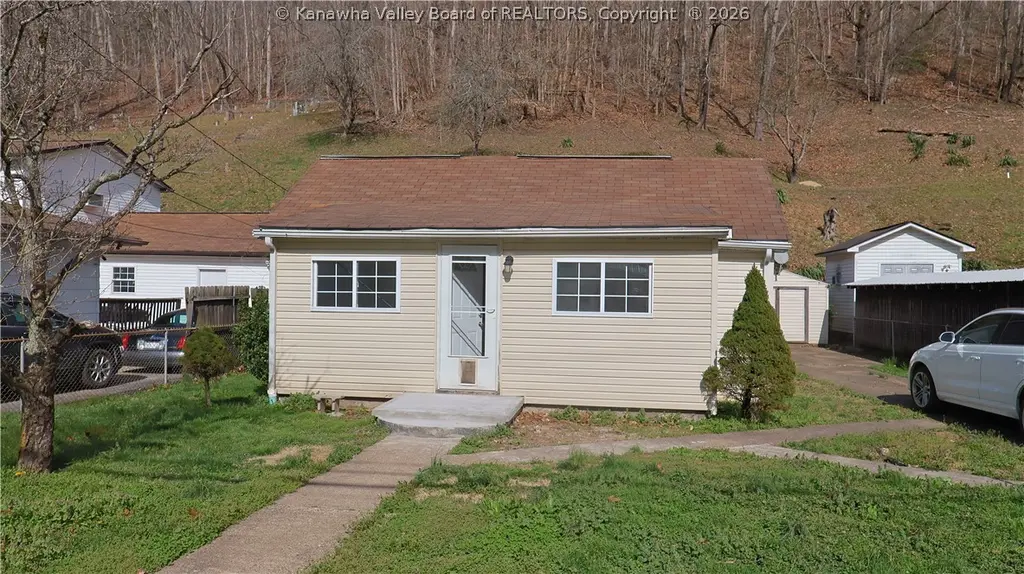
3566 Spring Fork Dr · Coal Fork, WV
Flood risk No data
- FEMA flood zone
- —
- Chance of flooding over 30 yrs
- —
- Est. flood insurance / yr
- —
Fire risk No data
- Est. fire insurance / yr
- —
Heat risk No data
- Hot days now (above threshold)
- —
- Hot days in 30 yrs
- —
Wind risk No data
- Chance of severe wind over 30 yrs
- —
Air-quality risk No data
- Unhealthy air days now
- —
- Unhealthy air days in 30 yrs
- —
Risk factors via First Street. Map © Google.
Why this score? — see what drove the B grade
The composite is a weighted blend of 9 inputs, each scored 0–100. Each bar is that input's sub-score; the figure is the points it added to the 100-point composite (weight × sub-score).
- Cash flow +30.0/30.0
- 1% rule +10.0/10.0
- DSCR +10.0/10.0
- Appreciation +7.0/10.0
- Rent growth +4.4/5.0
- Condition / age +3.8/5.0
- Livability +3.1/5.0
- Schools +2.9/10.0
- ARV discount +0.0/15.0
$112,000
🖨 Deal sheet (PDF) 📄 Offer letter ✓ Due diligence
Listing remarks
This home stands out for its inviting layout, comfortable living spaces, and overall sense of warmth. It offers the perfect balance of functionality and charm, making it ideal for everyday living. Located in a good neighborhood, it’s a place where you can truly settle in and feel at home.
Key facts
- 7,841 sq ft lot
- Listed 44 days
Property features AI
Exterior
- Parking: Parking pad; Other parking
- Utilities: Public water; Public sewer; Cable available
- Home design: Single-family residence; Single story
- Construction: Frame construction; Vinyl siding; Composition/shingle roof
- Exterior features: Outbuilding/storage; Storage
Interior
- Kitchen: Electric range; Refrigerator
- Bedrooms: Total rooms: 8
- Flooring: Vinyl flooring
- Bathrooms: 1 full bathroom
- Heating & cooling: Central air conditioning; Forced air heating
- Interior features: Insulated windows; Storage (built-in or on-site)
Neighborhood map
What this means for you Summary
Snapshot
- This is a 3-bed/1.0-bath single-family listed at $112k. Condition is rated good.
Deal economics
- At list price, monthly cash flow is $567 ($7k/yr) — positive.
- The deal already cash-flows at list — no discount required.
- Meets the 1% rule at list price ($2k rent vs $112k).
- Recommended offer: $109k (3.0% below list) — sets the bar for market timing.
Location & tenants
- Location reads 61/100 on livability (#201 in WV) — a middle-class / working-renter tenant base. Strengths: crime A+, cost of living A+; Watch: employment D, amenities F, commute F.
- Kanawha County Schools (suburban): math 29% / reading 40% proficiency, ranked #17 of 55 in WV (top 31%) — families likely to look elsewhere, expect single-tenant / working-renter base with shorter leases.
- Zoned schools: Malden Elementary School (math 22% / reading 17%, grade F, #350 of 377 statewide, top 95%, 152 students, 0% FRL); Riverside High School (math 17% / reading 47%, grade F, #55 of 110 statewide, top 59%, 1,220 students, 0% FRL) — zoned schools average 0% FRL vs 46% district-wide (46 pts lower); this property's tenant base skews higher-income than the district average.
- Market conditions: Rents rising fast (+7.6%/yr); 24 active listings in the ZIP; 103 units permitted in Kanawha County in 2024 (0 in 5+ unit buildings).
Forward outlook
- In year one you build about $5k of equity ($774 loan paydown + $4k appreciation (4.0% local appreciation)).
- Kanawha County population projected at -17% by 2050 — secular population decline; favor cash flow + early exit over multi-decade hold.
- At projected returns (4.0% appreciation + 7.6% rent growth), your $31k cash investment doubles in ~3 years — after that, you're playing with house money.
- By year 7, paydown + projected appreciation supports a ~$33k cash-out refi (75% LTV) — recoverable capital for the next deal without selling this one.
Negotiation context
- It's been on market 44 days — a 3% lower offer ($109k) is reasonable based on typical stale-listing flexibility.
Questions for the listing agent
- It's been on market 44 days. Have you received any prior offers? Is the seller open to a 3% concession, seller financing, or rate buy-down credit?
- Is there a deadline driving the sale (1031 exchange, divorce, estate, relocation)? That informs how much negotiation room exists.
- Schools are F-rated, which usually means shorter tenancies and higher turnover. Who's the typical renter profile here, and what's been the actual vacancy rate?
- What's the average days-on-market for RENTAL listings here right now (not sales)? A rising rental-DOM trend means longer vacancies and softer asking-rent achievability than the comps imply.
- What's the recent tenant-quality profile in this submarket — average credit score on applications, eviction rate, late-payment / NSF rate, and stable-employment percentage? A property-management company in the area should have these aggregated.
- How much new for-sale + rental construction is in the pipeline within 1–3 miles? Heavy new supply typically softens prices + rents 12–24 months out; constrained supply supports both.
Investment metrics
- 1% rule
- 1.52% ✓
- Cap rate
- 12.36%
- Cash-on-cash
- 21.68%
- DSCR
- 1.96
- GRM
- 5.5
CMA / ARV
- ARV (on-the-fly)
- $90,300
- Comps found
- 1
Show comp detail 1 sale within ~0.75 mi
| Address | Dist | Beds/Ba | Sqft | Sold | Price | $/sf | Match |
|---|---|---|---|---|---|---|---|
| 3523 Coal Fork Dr | 0.67mi | 3/1.0 | 1,232 (+2%) | 18mo | $93,000 | $75 | 50 |
Match score weights: distance 35% · size 25% · config 20% · recency 20%. Top-matched comps best support the ARV.
Projected returns pro-forma
3.99% appreciation · 7.59% rent growth · sell at horizon
- IRR
- 33.1%
- Equity multiple
- 3.03×
- Total profit
- $63,782
- Equity at exit
- $56,720
- IRR
- 34.8%
- Equity multiple
- 6.88×
- Total profit
- $184,404
- Equity at exit
- $92,717
Cash invested: $31,360 (down + closing). Projections, not guarantees.
Landlord ↔ Tenant lean methodology
- Overall (STATE)
- 83 Strongly Landlord-Friendly
- State West Virginia
- 83 Strongly Landlord-Friendly · R+22
- County
- — inherits STATE
- City
- — inherits STATE
ZIP-level market 25306
- Home prices YoY
- 2.1%
- Rents YoY
- 7.6%
- Active inventory
- 24
- Price-to-rent
- 5.5×
Monthly cashflow live
- Estimated rent
- $1,697 medium interval (Pro) →
- Mortgage (P&I)
- −$587
- Tax est. 1.5%
- −$140 /mo · $1,680/yr
- Insurance
- −$47
- HOA
- −$0
- Vacancy / Maint / Mgmt
- −$356
- Net cashflow
- $567
Break-even live
Sensitivity live
| Price | -10% $644 | -5% $605 | +0% $567 | +5% $528 | +10% $489 |
|---|---|---|---|---|---|
| Rent | -10% $433 | -5% $500 | +0% $567 | +5% $634 | +10% $701 |
| Rate | -1.0pp $623 | -0.5pp $595 | base $567 | +0.5pp $538 | +1.0pp $508 |
UW: 25.0% down · 7.5% · 30yr · 1.5% tax · 5.0% vac · 8.0% maint · 8.0% mgmt
Financing live
Cash to close
- Down payment
- $28,000
- Closing costs
- $3,360
- Reserves months
- —
- Total cash needed
- —
Loan-product check · same deal, 3 products live
Conventional
25% down · 7.5% · 30yr
- Down + closing
- —
- Monthly P&I
- —
- Monthly cashflow
- —
- DSCR
- —
- Eligible?
- —
Personal DTI + credit; lowest rate.
DSCR
20% down · 8.5% · 30yr
- Down + closing
- —
- Monthly P&I
- —
- Monthly cashflow
- —
- DSCR
- —
- Eligible?
- —
No personal income docs; deal must DSCR.
Hard money
10% down · 12.0% · 12mo
- Down + closing
- —
- Monthly P&I
- —
- Monthly cashflow
- —
- DSCR
- —
- Eligible?
- —
Short-term bridge; refi at stabilization.
Listing history 11 events
-
2026-06-21days on market $112,000 Active 44 DOM
-
2026-06-19days on market $112,000 Active 42 DOM
-
2026-06-18days on market $112,000 Active 41 DOM
-
2026-06-17days on market $112,000 Active 40 DOM
-
2026-06-16days on market $112,000 Active 39 DOM
-
2026-06-15days on market $112,000 Active 38 DOM
-
2026-06-14days on market $112,000 Active 36 DOM
-
2026-06-12days on market $112,000 Active 35 DOM
-
2026-06-09status $112,000 Active 32 DOM
-
2026-04-28status Pending
-
2026-03-27$112,000 Active
ⓘ Source: listings_history table (triggers on properties + properties_extension) + one-shot
backfill from property_details.listing_events for pre-trigger history.
Nearby sold comps map
Loading sold comps map…
Walkable amenities ~0.75 mi
Loading nearby amenities…
Taxation est. · year 1
- Rental income
- $20,364
- − Mortgage interest
- −$6,274
- − Property taxes
- −$1,680
- − Insurance
- −$560
- − Repairs & maintenance
- −$1,629
- − Management
- −$1,629
- − Depreciation
- −$3,258
- Taxable income
- $5,334
- Est. tax owed @ 24.0%
- −$1,280
- After-tax cash flow
- $5,519/yr
For passive investors: Depreciation is non-cash, so a rental often shows a tax loss while cash-flowing — sheltering income. Rental losses are passive: they offset passive income freely, and up to $25,000/yr can offset ordinary (W-2) income if you actively participate and your MAGI is under $100k (phasing out to $0 by $150k); unused losses carry forward. On sale, claimed depreciation is recaptured at up to 25%, and gains may owe capital-gains tax (a 1031 exchange can defer both). Figures are a year-1 estimate at your 24.0% rate — not tax advice; consult a CPA.
Condition & rehab AI · 9 photos
This single-family home is in good condition with a good layout and curb appeal. It's a great investment opportunity with potential for modest improvements to boost its value.
Value-add opportunities
- Both Painting the exterior and interior walls — Fresh paint enhances curb appeal and interior aesthetics.
- Both Landscaping improvements — A well-maintained yard can increase both resale and rental value.
- Both HVAC maintenance — A clean and efficient HVAC system improves comfort and energy efficiency, benefiting both buyers and renters.
Renovation cost estimate screening
Value-add ROI direction
- Both Painting the exterior and interior walls — Fresh paint enhances curb appeal and interior aesthetics. ↑
- Both Landscaping improvements — A well-maintained yard can increase both resale and rental value. ↑
- Both HVAC maintenance — A clean and efficient HVAC system improves comfort and energy efficiency, benefiting both buyers and renters. ↑
ⓘ Cost ranges are severity-bucket heuristics (US national rule-of-thumb). Get contractor quotes + a written scope before underwriting a rehab budget.
Schools (NCES district)
- District
- Kanawha County Schools
- NCES district ID
- 5400600
- Math proficiency
- 29% ▼ -13.00%
- Reading proficiency
- 40% ▼ -7.00%
- Median HH income
- $44,329
- Composite
- 29.35/100
- National rank
- #6540
- State rank
- #17 of 55 in WV
Livability — Coal Fork
- Score
- 61/100
- State rank
- #201
- US rank
- #17993
Category grades
Schools grade is shown separately in the Schools card above.
Census & demographics
- Census place
- Coal Fork, WV
- County
- Kanawha County · 33,502 people
- Metro
- Charleston, WV
- Population (ZIP)
- 6,040
- Household income
- $71,654
- Rent vs Own
- Severe rent burden
- 124.0
Population outlook (Kanawha County) Hauer SSP2
- Today (2025)
- 178,946 people
- By 2030
- 172,906 · -3.4%
- By 2040
- 159,874 · -10.7%
- By 2050
- 148,148 · -17.2%
- By 2075
- 123,257 · -31.1%
- By 2100
- 96,454 · -46.1%
Race, ethnicity, and origin ACS 2023
- Neighborhood character
- Predominantly White (86%)
- Race & ethnicity
- White 86% Black 6% Hispanic / Latino 3% Two or more races 3% Asian 3%
- Common ancestry
- Italian 4% Slovak 3% Iranian 1%
- Foreign-born
- 3% · Canada
- Languages at home
- 97% English-only · Other Asian/Pacific 1% Other Indo-European 1%
Political lean MEDSL · Kanawha
- 2024 margin
- R (+17.4) · D 40.2% · R 57.6% · Other 2.2%
- 2008→2024 swing
- -17.0pp toward R · 2008: -0.4pp · 2024: -17.4pp
- All cycles
- 2024: R+17.4 2020: R+14.7 2016: R+20.6 2012: R+11.9 2008: R+0.4
Not yet ingested
- Civics
- —
Market trends
- HPI YoY
- ▲ 3.99%
- Current HPI
- 195.9623
- Rent YoY
- ▲ 7.59%
- Metro
- Charleston, WV
- State GDP YoY
- —
- F500 in state
- 0
Price history
2 events — show timeline
- 2026-04-28 Pending — KVBOR
- 2026-03-27 Listed $112,000 KVBOR
Cash-flow waterfall
monthlySold comps — $/sqft
last 12 mo · ≤1 miLoading sold comps…