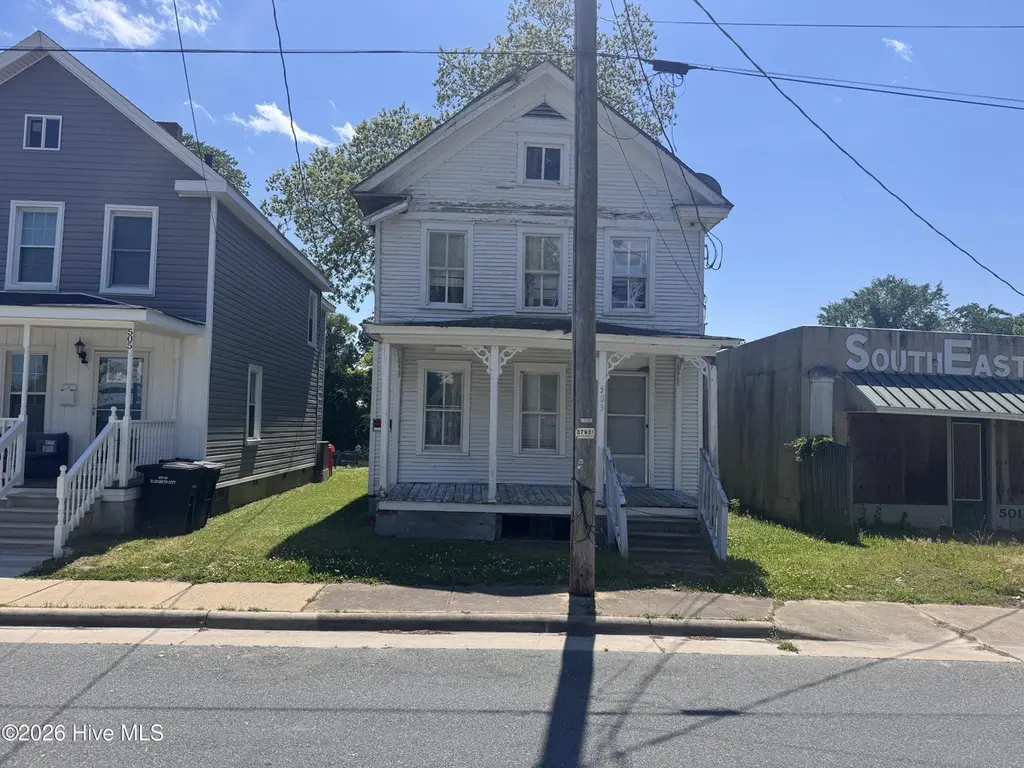
503 Pearl St · Elizabeth City, NC
Flood risk 9/10 · Severe
- FEMA flood zone
- AE
- Chance of flooding over 30 yrs
- 0.99%
- Est. flood insurance / yr
- $1,737 – $8,500
Fire risk 2/10 · Minimal
- Est. fire insurance / yr
- $906 – $1,684
Heat risk 10/10 · Severe
- Hot days now (above 107°F)
- 7 days/yr
- Hot days in 30 yrs
- 18 days/yr
Wind risk 8/10 · Major
- Chance of severe wind over 30 yrs
- 99.0%
Air-quality risk 1/10 · Minimal
- Unhealthy air days now
- 0 days/yr
- Unhealthy air days in 30 yrs
- 0 days/yr
Risk factors via First Street. Map © Google.
Why this score? — see what drove the D grade
The composite is a weighted blend of 9 inputs, each scored 0–100. Each bar is that input's sub-score; the figure is the points it added to the 100-point composite (weight × sub-score).
- Cash flow +15.0/30.0
- ARV discount +7.5/15.0
- 1% rule +5.0/10.0
- DSCR +5.0/10.0
- Livability +3.6/5.0
- Rent growth +3.5/5.0
- Condition / age +2.5/5.0
- Schools +2.4/10.0
- Appreciation +0.0/10.0
$35,000
🖨 Deal sheet 📄 Offer letter ✓ Due diligence
Listing remarks
Investor and renovation opportunity in a prime Elizabeth City location. Walkable to historic downtown, the Pasquotank River waterfront, dining, and local amenities. This two-story Folk Victorian features original hardwood floors, a covered front porch with decorative millwork, three bedrooms, one full bath, and a spacious rear yard with detached outbuilding. The main level includes a living area, flex room, and kitchen with existing cabinetry. Property is in need of full renovation and is priced accordingly. Sold strictly as-is seller will make no repairs. Cash or renovation financing only. All inspections welcome prior to offer. Confirmed appointment required to access property. As-Is Sale
Key facts
- Covered front porch
- Historic downtown
- Decorative millwork
Tags
Property features AI
Exterior
- Parking: On-street parking
- Utilities: Public water; Public sewer; Water connected; Sewer connected
- Home design: Single family residence; Two levels; Entry level is 1
- Construction: Wood siding and frame construction; Shingle roof; Crawl space / no basement; Built as residential (single family)
- Exterior features: Front porch; Rear porch; Has view
Interior
- Flooring: Vinyl flooring; Hardwood flooring
- Bathrooms: 1 full bathroom; 1 half bathroom
- Heating & cooling: No heating; No cooling
- Interior features: See remarks
- Laundry & utility: Washer hookup; Electric water heater
Neighborhood map
What this means for you Summary
Snapshot
- This is a 4-bed/1.5-bath single-family listed at $35k.
Deal economics
- At list price, monthly cash flow is $703 ($8k/yr) — positive.
- The deal already cash-flows at list — no discount required.
- Meets the 1% rule at list price ($2k rent vs $35k).
- Cap rate 45.0% vs local median 2.9% in Elizabeth City — top-decile yield for the area; either an underpriced asset or a hidden risk that comps aren't pricing in. Stress-test before assuming the spread holds.
Location & tenants
- Location reads 71/100 on livability (#119 in NC) — a middle-class / working-renter tenant base. Strengths: cost of living A+, housing A+, health & safety A+; Watch: crime D+, commute F, employment F.
- Elizabeth City-Pasquotank Public Schools (rural): math 21% / reading 34% proficiency, ranked #152 of 178 in NC (top 85%) — low school quality limits family demand, transient renter base, plan for 1-2y turnover.
- Zoned schools: P W Moore Elementary (math 8% / reading 17%, grade F, #1,362 of 1,410 statewide, top 97%, 353 students, 98% FRL); Elizabeth City Middle (math 16% / reading 31%, grade F, #402 of 475 statewide, top 85%, 515 students, 99% FRL); Northeastern High (math 37% / reading 42%, grade F, #393 of 535 statewide, top 75%, 701 students, 100% FRL) — zoned schools average 99% FRL vs 56% district-wide (42 pts higher); higher-poverty schools than district average — tighter screening recommended.
- Market conditions: Rents rising fast (+4.0%/yr); 343 active listings in the ZIP; 1 comparable units currently listed for rent nearby; 153 units permitted in Pasquotank County in 2024 (0 in 5+ unit buildings).
- This rent runs 31% of the median local income ($67k/yr) — at the standard rent-burdened threshold; future hikes will face affordability resistance.
Forward outlook
- Local home prices are declining (-3.0%/yr); year-one equity from $242 of loan paydown is wiped out by about $1k of value loss. Plan a longer hold.
- Pasquotank County population projected at -19% by 2050 — secular population decline; favor cash flow + early exit over multi-decade hold.
- At projected returns (-3.0% appreciation + 4.0% rent growth), your $10k cash investment doubles in ~2 years — after that, you're playing with house money.
Negotiation context
- Only 4 days on market — expect competitive offers; lowballing is unlikely to land.
- Current owner paid $14k; list at $35k implies a 141% gain — meaningful room to come down on a strong offer.
Risks & watch-outs
- Watch-outs: flood insurance adds $427/mo; built in 1936 — expect roof / HVAC / electrical / plumbing capex.
- Climate carrying-cost: in FEMA flood zone AE (mandatory federal flood insurance); severe wind risk, 99% chance of damaging wind over 30y; extreme-heat days projected 7→18/yr by 2055 (HVAC capex compounding) — expect insurance premiums to compound above CPI over the hold.
Questions for the listing agent
- Built in 1936 — when were the roof, HVAC, electrical panel, plumbing, and water heater last replaced?
- What's the actual annual flood-insurance premium (NFIP or private), and is the property in a SFHA with mandatory coverage?
- Is there a deadline driving the sale (1031 exchange, divorce, estate, relocation)? That informs how much negotiation room exists.
- Schools are F-rated, which usually means shorter tenancies and higher turnover. Who's the typical renter profile here, and what's been the actual vacancy rate?
- Crime grade is D in this area — have there been break-ins, vandalism, or insurance claims at this property in the last 3 years? What carrier currently insures it and at what premium?
- The area grade is low — what's the realistic commute time and amenity access for the typical tenant pool here? Any planned neighborhood developments (good or bad) we should know about?
- What's the average days-on-market for RENTAL listings here right now (not sales)? A rising rental-DOM trend means longer vacancies and softer asking-rent achievability than the comps imply.
- What's the recent tenant-quality profile in this submarket — average credit score on applications, eviction rate, late-payment / NSF rate, and stable-employment percentage? A property-management company in the area should have these aggregated.
- How much new for-sale + rental construction is in the pipeline within 1–3 miles? Heavy new supply typically softens prices + rents 12–24 months out; constrained supply supports both.
Investment metrics
- 1% rule
- 4.99% ✓
- Cap rate
- 45.02%
- Cash-on-cash
- 138.32%
- DSCR
- 7.15
- GRM
- 1.7
CMA / ARV
- ARV (on-the-fly)
- $177,504
- Comps found
- 12
Show comp detail 12 sales within ~0.75 mi
| Address | Dist | Beds/Ba | Sqft | Sold | Price | $/sf | Match |
|---|---|---|---|---|---|---|---|
| 503 Pearl St | 0.00mi | 4/1.5 | 1,376 (0%) | 0mo | $39,000 | $28 | 100 |
| 409 E Broad St | 0.25mi | 3/2.5 (-1) | 1,376 (0%) | 11mo | $220,000 | $160 | 71 |
| 802 2nd St | 0.23mi | 3/2.0 (-1) | 1,281 (-7%) | 7mo | $165,000 | $129 | 65 |
| 803 1st St | 0.22mi | 3/3.0 (-1) | 1,308 (-5%) | 12mo | $277,500 | $212 | 60 |
| 704 Grady St | 0.38mi | 3/1.0 (-1) | 1,275 (-7%) | 5mo | $149,900 | $118 | 59 |
| 406 Factory St | 0.47mi | 3/2.0 (-1) | 1,280 (-7%) | 1mo | $182,500 | $143 | 58 |
| 608 S Martin St | 0.59mi | 3/1.0 (-1) | 1,360 (-1%) | 12mo | $60,000 | $44 | 54 |
| 808 Wilson St | 0.59mi | 3/1.5 (-1) | 1,236 (-10%) | 8mo | $112,000 | $91 | 44 |
| 509 Madrin St | 0.64mi | 3/2.0 (-1) | 1,304 (-5%) | 12mo | $142,000 | $109 | 44 |
| 708 Southern Ave | 0.58mi | 3/1.0 (-1) | 1,486 (+8%) | 15mo | $50,000 | $34 | 40 |
| 806 Agawam St | 0.72mi | 3/2.0 (-1) | 1,221 (-11%) | 11mo | $261,800 | $214 | 32 |
| 902 Hunnicutt Ave | 0.73mi | 3/2.0 (-1) | 1,541 (+12%) | 12mo | $259,000 | $168 | 29 |
Match score weights: distance 35% · size 25% · config 20% · recency 20%. Top-matched comps best support the ARV.
Projected returns pro-forma
-3.0% appreciation · 4.02% rent growth · sell at horizon
- IRR
- 88.5%
- Equity multiple
- 5.21×
- Total profit
- $41,212
- Equity at exit
- $5,219
- IRR
- 91.9%
- Equity multiple
- 11.44×
- Total profit
- $102,320
- Equity at exit
- $3,026
Cash invested: $9,800 (down + closing). Projections, not guarantees.
Landlord ↔ Tenant lean methodology
- Overall (STATE)
- 85 Strongly Landlord-Friendly
- State North Carolina
- 85 Strongly Landlord-Friendly · R+3
- County
- — inherits STATE
- City
- — inherits STATE
ZIP-level market 27909
- Rents YoY
- 4.0%
- Active inventory
- 343
- Price-to-rent
- 1.7×
Monthly cashflow live
- Estimated rent
- $1,745 medium interval (Pro) →
- Mortgage (P&I)
- −$184
- Tax from tax record
- −$51 /mo · $613/yr
- Insurance
- −$15
- Flood insurance flood zone
- −$427 /mo · $5,118/yr
- HOA
- −$0
- Vacancy / Maint / Mgmt
- −$367
- Net cashflow
- $703
Break-even live
UW: 25.0% down · 7.5% · 30yr · 1.5% tax · 5.0% vac · 8.0% maint · 8.0% mgmt
Financing live
Cash to close
- Down payment
- $8,750
- Closing costs
- $1,050
- Reserves months
- —
- Total cash needed
- —
Loan-product check · same deal, 3 products live
Conventional
25% down · 7.5% · 30yr
- Down + closing
- —
- Monthly P&I
- —
- Monthly cashflow
- —
- DSCR
- —
- Eligible?
- —
Personal DTI + credit; lowest rate.
DSCR
20% down · 8.5% · 30yr
- Down + closing
- —
- Monthly P&I
- —
- Monthly cashflow
- —
- DSCR
- —
- Eligible?
- —
No personal income docs; deal must DSCR.
Hard money
10% down · 12.0% · 12mo
- Down + closing
- —
- Monthly P&I
- —
- Monthly cashflow
- —
- DSCR
- —
- Eligible?
- —
Short-term bridge; refi at stabilization.
Rent comps 1 comps
| Address | Beds | Baths | Sqft | Rent | $/sqft | DOM | Units | Dist |
|---|---|---|---|---|---|---|---|---|
| 805 Hunter St Elizabeth City, NC | 3.0 | 1.0 | 924 | $1,250 | $1.35 | 12d | 1 | 0.65mi |
Listing history 2 events
-
2026-05-25$35,000 Active
-
2016-04-15soldstatus $14,500
ⓘ Source: listings_history table (triggers on properties + properties_extension) + one-shot
backfill from property_details.listing_events for pre-trigger history.
Tax reassessment forecast NC · Resets to sale price
- Current annual tax
- $613 · $51/mo
- Projected year-2 tax
- $613 · $51/mo
- Expected delta
- $0/yr ($0/mo · 0.0%)
ⓘ Screening estimate from a state-policy table — verify with the county assessor before closing.
Climate risk First Street
- Flood 9/10 Extreme FEMA zone AE · 99% chance over 30 yrs
- Wildfire 2/10 Low
- Heat 10/10 Extreme 7 d/yr ≥107°F today · 18 d/yr by 30 yrs out
- Wind 8/10 Severe 99% chance of damaging wind over 30 yrs
- Air quality 1/10 Low 0 unhealthy d/yr today · 0 by 30 yrs out
Nearby sold comps map
Loading sold comps map…
Walkable amenities ~0.75 mi
Loading nearby amenities…
Taxation est. · year 1
- Rental income
- $20,945
- − Mortgage interest
- −$1,961
- − Property taxes
- −$613
- − Insurance
- −$5,294
- − Repairs & maintenance
- −$1,676
- − Management
- −$1,676
- − Depreciation
- −$1,018
- Taxable income
- $8,708
- Est. tax owed @ 24.0%
- −$2,090
- After-tax cash flow
- $6,347/yr
For passive investors: Depreciation is non-cash, so a rental often shows a tax loss while cash-flowing — sheltering income. Rental losses are passive: they offset passive income freely, and up to $25,000/yr can offset ordinary (W-2) income if you actively participate and your MAGI is under $100k (phasing out to $0 by $150k); unused losses carry forward. On sale, claimed depreciation is recaptured at up to 25%, and gains may owe capital-gains tax (a 1031 exchange can defer both). Figures are a year-1 estimate at your 24.0% rate — not tax advice; consult a CPA.
Schools (NCES district)
- District
- Elizabeth City-Pasquotank Public Schools
- NCES district ID
- 3703540
- Math proficiency
- 21% ▼ -7.00%
- Reading proficiency
- 34% ▼ -1.00%
- Median HH income
- $45,294
- Composite
- 23.63/100
- National rank
- #7847
- State rank
- #152 of 178 in NC
Livability — Elizabeth City
- Score
- 71/100
- State rank
- #119
- US rank
- #7304
Category grades
Schools grade is shown separately in the Schools card above.
Census & demographics
- Census place
- Elizabeth City, NC
- County
- Pasquotank County · 40,869 people
- City population
- 40,869
- Metro
- Elizabeth City, NC
- Population (ZIP)
- 40,869
- Household income
- $66,732
- Rent vs Own
- Severe rent burden
- 1160.0
Population outlook (Pasquotank County) Hauer SSP2
- Today (2025)
- 38,172 people
- By 2030
- 36,890 · -3.4%
- By 2040
- 33,845 · -11.3%
- By 2050
- 31,086 · -18.6%
- By 2075
- 27,191 · -28.8%
- By 2100
- 26,093 · -31.6%
Race, ethnicity, and origin ACS 2023
- Neighborhood character
- Diverse neighborhood (Simpson 0.59)
- Race & ethnicity
- White 54% Black 35% Hispanic / Latino 6% Two or more races 6% Asian 1%
- Hispanic origin (detail)
- Mexican 2% Puerto Rican 2%
- Common ancestry
- Slovak 2% Romanian 1% Lithuanian 1%
- Foreign-born
- 3% · Canada, Vietnam
- Languages at home
- 96% English-only · Spanish 2% Other Asian/Pacific 1% Vietnamese 1%
Political lean MEDSL · Pasquotank
- 2024 margin
- Toss-up / Even · D 47.1% · R 52.0%
- 2008→2024 swing
- -18.6pp toward R · 2008: 13.7pp · 2024: -4.9pp
- All cycles
- 2024: R+4.9 2020: D+0.3 2016: D+2.2 2012: D+15.9 2008: D+13.7
Not yet ingested
- Civics
- —
Market trends
- HPI YoY
- ▼ -141.03%
- Current HPI
- 164.7511
- Rent YoY
- ▲ 4.02%
- Metro
- Elizabeth City, NC
- State GDP YoY
- ▲ 3.28%
- F500 in state
- 26
Industry mix (Fortune 500 HQ in NC)
| Industry | F500 HQs | Revenue |
|---|---|---|
| Financial Services | 2 | $213B |
|
||
| Retail | 2 | $95B |
|
||
| Industrial Conglomerate | 1 | $38B |
|
||
| Metals / Steel | 1 | $35B |
|
||
| Utilities | 1 | $30B |
|
||
| Industrial Machinery | 1 | $19B |
|
||
Price history
+141.4% since first listed2 events — show timeline
- 2026-05-25 Listed $35,000 Hive MLS
- 2016-04-15 Sold (Public Records) $14,500 Public Records
Cash-flow waterfall
monthlySold comps — $/sqft
last 12 mo · ≤1 miLoading sold comps…