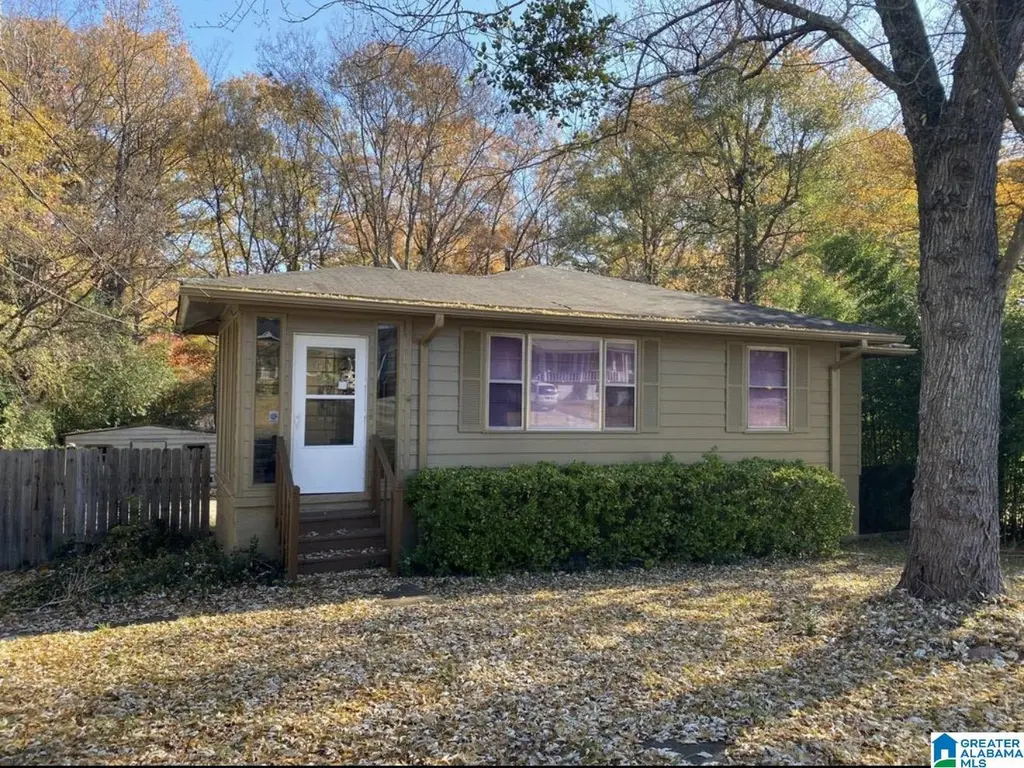
1617 1st St NE · Center Point, AL
Flood risk 1/10 · Minimal
- FEMA flood zone
- X (unshaded)
- Chance of flooding over 30 yrs
- 0.0%
- Est. flood insurance / yr
- $473 – $860
Fire risk 1/10 · Minimal
- Est. fire insurance / yr
- $916 – $1,700
Heat risk 6/10 · Moderate
- Hot days now (above 105°F)
- 7 days/yr
- Hot days in 30 yrs
- 19 days/yr
Wind risk 6/10 · Moderate
- Chance of severe wind over 30 yrs
- 27.0%
Air-quality risk 5/10 · Moderate
- Unhealthy air days now
- 7 days/yr
- Unhealthy air days in 30 yrs
- 9 days/yr
Risk factors via First Street. Map © Google.
Why this score? — see what drove the C- grade
The composite is a weighted blend of 9 inputs, each scored 0–100. Each bar is that input's sub-score; the figure is the points it added to the 100-point composite (weight × sub-score).
- Cash flow +21.2/30.0
- ARV discount +9.0/15.0
- DSCR +6.8/10.0
- 1% rule +4.9/10.0
- Rent growth +3.3/5.0
- Livability +3.2/5.0
- Condition / age +2.5/5.0
- Schools +1.8/10.0
- Appreciation +0.0/10.0
$130,000
🖨 Deal sheet 📄 Offer letter ✓ Due diligence
Listing remarks MLS
Great opportunity on spacious home in quiet neighborhood. Much larger than appears from the outside. Sunroom, living room, formal dining room, kitchen, breakfast room with sliding glass doors that open to the private deck, 3 bedrooms and a full bath all on the main level. Downstairs is a den with stone wood burning fireplace and glass doors that open to the private patio in fenced in backyard, half bath, large bedroom with walk-in closet. Call today to tour this home. Won’t last long!
Key facts
- Finished basement
- Deck
- Cash-flowing asset
Tags
Property features AI
Exterior
- Parking: Driveway parking
- Utilities: Public water; Connected sewer; Gas water heater; Internet availability unknown
- Home design: Existing home; Basement entry/foundation
- Construction: Concrete/block and wood siding construction
- Exterior features: Fenced yard; Storage building; Covered and open decks
Interior
- Kitchen: Electric stove; Laminate countertops
- Bedrooms: Multiple bedrooms on the main level; Additional bedroom in the basement
- Flooring: Carpet; Hardwood; Tile
- Bathrooms: One full bathroom with tub/shower combo (shared bath); One half bathroom in the basement
- Heating & cooling: Central heating; Central air conditioning
- Interior features: Carpet, hardwood, and tile flooring; One wood-burning fireplace with stone surround in the den; Ceilings listed as other (see remarks); Finished and unfinished full basement (concrete block foundation); Main level living area with additional finished basement space; No special interior features listed
- Laundry & utility: Washer hookup; Electric dryer hookup; Laundry located in the basement
Neighborhood map
What this means for you Summary
Snapshot
- This is a 3-bed/1.0-bath single-family listed at $130k.
Deal economics
- At list price, monthly cash flow is $188 ($2k/yr) — positive.
- The deal already cash-flows at list — no discount required.
- To meet the 1% rule (rent ≥ 1% of price), the offer needs to be $129k (0.9% below list).
- Recommended offer: $128k (1.5% below list) — sets the bar for market timing.
Location & tenants
- Location reads 63/100 on livability (#193 in AL) — a middle-class / working-renter tenant base. Strengths: cost of living A+, commute A, housing A; Watch: crime D, amenities F, employment F.
- Jefferson County (suburban): math 9% / reading 32% proficiency, ranked #104 of 129 in AL (top 81%) — low school quality limits family demand, transient renter base, plan for 1-2y turnover.
- Zoned schools: Center Point Elementary School (618 students, 82% FRL); Center Point High School (math 2% / reading 2%, grade F, #291 of 305 statewide, top 100%, 774 students, 91% FRL) — zoned schools average 86% FRL vs 49% district-wide (38 pts higher); higher-poverty schools than district average — tighter screening recommended.
- Zoned-school proficiency averages 2% at this address vs 20% district-wide (-18 pts) — the specific schools serving this property underperform the Jefferson County average; the district grade overstates school quality for this exact location.
- Market conditions: Rents rising (+3.0%/yr); 334 active listings in the ZIP; 40 comparable units currently listed for rent nearby; rentals at typical pace (median 24d on market — plan ~3-4 weeks tenant-placement turnaround); 2,114 units permitted in Jefferson County in 2024 (556 in 5+ unit buildings).
Forward outlook
- Local home prices are declining (-3.0%/yr); year-one equity from $899 of loan paydown is wiped out by about $4k of value loss. Plan a longer hold.
- Jefferson County population projected to shrink 4% by 2050 — rents likely to lag national; underwrite the cash flow, not the appreciation.
Negotiation context
- It's been on market 18 days — a 2% lower offer ($128k) is reasonable based on typical stale-listing flexibility.
- 2 sale attempts since 5y ago with the ask held roughly flat each time — persistent listings suggest the price (not the market) is what's stuck; bring a comps-based counter.
- Current owner paid $80k; list at $130k implies a 63% gain — meaningful room to come down on a strong offer.
Risks & watch-outs
- Climate carrying-cost: major wind risk, 27% chance of damaging wind over 30y; extreme-heat days projected 7→19/yr by 2055 (HVAC capex compounding) — expect insurance premiums to compound above CPI over the hold.
Questions for the listing agent
- Built in 1961 — when were the roof, HVAC, electrical panel, plumbing, and water heater last replaced?
- Is there a deadline driving the sale (1031 exchange, divorce, estate, relocation)? That informs how much negotiation room exists.
- Schools are F-rated, which usually means shorter tenancies and higher turnover. Who's the typical renter profile here, and what's been the actual vacancy rate?
- Crime grade is D in this area — have there been break-ins, vandalism, or insurance claims at this property in the last 3 years? What carrier currently insures it and at what premium?
- What's the average days-on-market for RENTAL listings here right now (not sales)? A rising rental-DOM trend means longer vacancies and softer asking-rent achievability than the comps imply.
- What's the recent tenant-quality profile in this submarket — average credit score on applications, eviction rate, late-payment / NSF rate, and stable-employment percentage? A property-management company in the area should have these aggregated.
- How much new for-sale + rental construction is in the pipeline within 1–3 miles? Heavy new supply typically softens prices + rents 12–24 months out; constrained supply supports both.
Investment metrics
- 1% rule
- 0.99% ✗
- Cap rate
- 8.03%
- Cash-on-cash
- 6.20%
- DSCR
- 1.28
- GRM
- 8.4
CMA / ARV
- ARV (on-the-fly)
- $134,358
- Comps found
- 12
Show comp detail 12 sales within ~0.75 mi
| Address | Dist | Beds/Ba | Sqft | Sold | Price | $/sf | Match |
|---|---|---|---|---|---|---|---|
| 1637 1st St NE | 0.07mi | 3/1.0 | 1,296 (-6%) | 9mo | $115,300 | $89 | 80 |
| 1705 Lake Park Cir | 0.26mi | 2/2.0 (-1) | 1,339 (-2%) | 1mo | $125,000 | $93 | 75 |
| 1632 Bobolink Ln NE | 0.38mi | 3/2.0 | 1,327 (-3%) | 9mo | $130,000 | $98 | 66 |
| 1341 Hatfield Ln | 0.46mi | 3/1.5 | 1,318 (-4%) | 6mo | $100,500 | $76 | 65 |
| 1517 NW 3rd St | 0.52mi | 3/2.0 | 1,377 (+0%) | 8mo | $86,000 | $62 | 65 |
| 1736 Reed Rd NE | 0.60mi | 3/2.0 | 1,469 (+7%) | 1mo | $190,000 | $129 | 55 |
| 504 Lakeside Cir | 0.31mi | 2/2.0 (-1) | 1,555 (+13%) | 2mo | $210,000 | $135 | 52 |
| 550 Lakeside Cir | 0.34mi | 2/2.0 (-1) | 1,526 (+11%) | 7mo | $209,900 | $138 | 50 |
| 432 Argonne Dr NE | 0.34mi | 3/2.0 | 1,566 (+14%) | 8mo | $101,700 | $65 | 50 |
| 25 NW 19th Ave | 0.51mi | 3/2.0 | 1,232 (-10%) | 9mo | $175,000 | $142 | 48 |
| 348 17th Ave NW | 0.65mi | 4/2.0 (+1) | 1,456 (+6%) | 4mo | $175,000 | $120 | 47 |
| 1712 4th Pl NW | 0.71mi | 3/1.0 | 1,182 (-14%) | 3mo | $90,000 | $76 | 41 |
Match score weights: distance 35% · size 25% · config 20% · recency 20%. Top-matched comps best support the ARV.
Projected returns pro-forma
-3.0% appreciation · 3.04% rent growth · sell at horizon
- IRR
- -6.7%
- Equity multiple
- 0.75×
- Total profit
- $-9,057
- Equity at exit
- $19,383
- IRR
- 2.9%
- Equity multiple
- 1.21×
- Total profit
- $7,659
- Equity at exit
- $11,240
Cash invested: $36,400 (down + closing). Projections, not guarantees.
Landlord ↔ Tenant lean methodology
- Overall (STATE)
- 90 Strongly Landlord-Friendly
- State Alabama
- 90 Strongly Landlord-Friendly · R+15
- County
- — inherits STATE
- City
- — inherits STATE
ZIP-level market 35215
- Home prices YoY
- -34.4%
- Rents YoY
- 3.0%
- Active inventory
- 334
- Price-to-rent
- 8.4×
Monthly cashflow live
- Estimated rent
- $1,289 high interval (Pro) →
- Mortgage (P&I)
- −$682
- Tax from tax record
- −$94 /mo · $1,131/yr
- Insurance
- −$54
- HOA
- −$0
- Vacancy / Maint / Mgmt
- −$271
- Net cashflow
- $188
Break-even live
UW: 25.0% down · 7.5% · 30yr · 1.5% tax · 5.0% vac · 8.0% maint · 8.0% mgmt
Financing live
Cash to close
- Down payment
- $32,500
- Closing costs
- $3,900
- Reserves months
- —
- Total cash needed
- —
Loan-product check · same deal, 3 products live
Conventional
25% down · 7.5% · 30yr
- Down + closing
- —
- Monthly P&I
- —
- Monthly cashflow
- —
- DSCR
- —
- Eligible?
- —
Personal DTI + credit; lowest rate.
DSCR
20% down · 8.5% · 30yr
- Down + closing
- —
- Monthly P&I
- —
- Monthly cashflow
- —
- DSCR
- —
- Eligible?
- —
No personal income docs; deal must DSCR.
Hard money
10% down · 12.0% · 12mo
- Down + closing
- —
- Monthly P&I
- —
- Monthly cashflow
- —
- DSCR
- —
- Eligible?
- —
Short-term bridge; refi at stabilization.
Rent comps 40 comps
| Address | Beds | Baths | Sqft | Rent | $/sqft | DOM | Units | Dist |
|---|---|---|---|---|---|---|---|---|
| 1628 1st St NE Center Point, AL | 3.0 | 1.0 | 1027 | $1,165 | $1.13 | 43d | 1 | 0.06mi |
| 1541 Charter East Cir NE Birmingham, AL | 1.0–2.0 | 1.0–1.5 | 807 | $1,095 | $1.36 | 2d | 8 | 0.22mi |
| 1629 1st St NW Center Point, AL | 3.0 | 1.0 | 900 | $1,025 | $1.14 | 23d | 1 | 0.23mi |
| 1628 1st St NW Center Point, AL | 3.0 | 1.0 | 1124 | $1,150 | $1.02 | 43d | 1 | 0.26mi |
| 1720 2nd St NE Center Point, AL | 3.0 | 2.0 | 1100 | $1,400 | $1.27 | 43d | 1 | 0.27mi |
| 213 Meadwood Dr NE Center Point, AL | 3.0 | 1.0 | 1194 | $995 | $0.83 | 43d | 1 | 0.33mi |
| 239 Lake Drive Cir NE Birmingham, AL | 3.0 | 1.0 | 1159 | $1,125 | $0.97 | 3d | 1 | 0.40mi |
| 241 Lake Drive Cir NE Birmingham, AL | 2.0 | 1.0 | 1358 | $1,025 | $0.75 | 2d | 1 | 0.40mi |
| 341 Argonne Dr NE Center Point, AL | 3.0 | 1.0 | 1040 | $1,300 | $1.25 | 3d | 1 | 0.46mi |
| 1617 3rd Pl NW Center Point, AL | 3.0 | 2.0 | 1404 | $1,150 | $0.82 | 23d | 1 | 0.52mi |
| 113 19th Ave NW Center Point, AL | 3.0 | 2.0 | 1407 | $1,250 | $0.89 | 11d | 1 | 0.54mi |
| 305 18th Ct NW Center Point, AL | 3.0 | 1.5 | 1270 | $1,100 | $0.87 | 43d | 1 | 0.58mi |
| 224 13th Ave NE Birmingham, AL | 3.0 | 1.5 | 1213 | $1,273 | $1.05 | 21d | 1 | 0.59mi |
| 107 Sterling Ct NW Center Point, AL | 2.0 | 1.5–2.0 | 1026 | $1,062 | $1.04 | 3d | 4 | 0.61mi |
| 1905 2nd St NW Center Point, AL | 3.0 | 1.0 | 1258 | $1,395 | $1.11 | 43d | 1 | 0.61mi |
| 405 18th Ave NW Center Point, AL | 3.0 | 2.0 | 1162 | $1,299 | $1.12 | 43d | 1 | 0.62mi |
| 428 15th Ter NW Center Point, AL | 3.0 | 2.0 | 1528 | $1,795 | $1.17 | 3d | 1 | 0.66mi |
| 434 15th Ter NW Center Point, AL | 3.0 | 2.0 | 1053 | $1,200 | $1.14 | 43d | 1 | 0.70mi |
| 1700 4th Pl NW Center Point, AL | 3.0 | 1.0 | 914 | $1,075 | $1.18 | 23d | 1 | 0.71mi |
| 1712 4th Pl NW Center Point, AL | 3.0 | 1.0 | 1182 | $1,150 | $0.97 | 23d | 1 | 0.72mi |
| 1700 Serene Dr Birmingham, AL | 4.0 | 1.5 | 1543 | $1,630 | $1.06 | 2d | 1 | 0.73mi |
| 108 13th Ave NW Center Point, AL | 4.0 | 2.0 | 1444 | $1,265 | $0.88 | 23d | 1 | 0.76mi |
| 324 13th Ter NW Center Point, AL | 3.0 | 1.5 | 1418 | $1,295 | $0.91 | 23d | 1 | 0.79mi |
| 1259 Huffman Rd Center Point, AL | 3.0 | 2.0 | 1662 | $1,556 | $0.94 | 43d | 1 | 0.80mi |
| 1340 Orlando Cir NE Birmingham, AL | 3.0 | 2.0 | 1329 | $1,166 | $0.88 | 23d | 1 | 0.80mi |
| 405 13th Ct NW Center Point, AL | 4.0 | 1.5 | 1248 | $1,415 | $1.13 | 21d | 1 | 0.85mi |
| 1360 Orlando Cir NE Birmingham, AL | 3.0 | 2.0 | 1489 | $1,455 | $0.98 | 23d | 1 | 0.85mi |
| 1237 Linwood St Birmingham, AL | 3.0 | 1.5 | 1066 | $995 | $0.93 | 43d | 1 | 0.89mi |
| 1612 Glenwood St NW Center Point, AL | 4.0 | 3.0 | 1344 | $1,480 | $1.10 | 23d | 1 | 0.89mi |
| 500 15th Ave NW Center Point, AL | 3.0 | 1.0 | 1079 | $1,050 | $0.97 | 3d | 1 | 0.91mi |
| 1225 Birchwood St Birmingham, AL | 3.0 | 2.0 | 1092 | $1,175 | $1.08 | 3d | 1 | 0.95mi |
| 1356 5th Pl NW Center Point, AL | 3.0 | 1.0 | 1064 | $1,105 | $1.04 | 43d | 1 | 0.97mi |
| 1333 5th Pl NW Center Point, AL | 3.0 | 2.0 | 1056 | $1,275 | $1.21 | 43d | 1 | 0.97mi |
| 424 Tupelo Way Center Point, AL | 4.0 | 2.0 | 1233 | $1,300 | $1.05 | 43d | 1 | 0.98mi |
| 1153 Linwood St Birmingham, AL | 3.0 | 2.0 | 1250 | $1,295 | $1.04 | 3d | 1 | 0.99mi |
| 1232 Oakwood St Birmingham, AL | 3.0 | 1.5 | 1301 | $1,223 | $0.94 | 23d | 1 | 1.00mi |
| 1845 Stonehenge Dr Birmingham, AL | 3.0 | 2.0 | 1358 | $1,323 | $0.97 | 14d | 1 | 1.00mi |
| 400 13th Ave NW Birmingham, AL | 2.0 | 1.0 | 1100 | $890 | $0.81 | 43d | 1 | 1.00mi |
| 1328 5th Pl NW Center Point, AL | 3.0 | 1.0 | 1250 | $1,050 | $0.84 | 16d | 1 | 1.01mi |
| 1732 6th St NW Center Point, AL | 3.0 | 1.5 | 1300 | $1,250 | $0.96 | 3d | 1 | 1.02mi |
Listing history 13 events
-
2026-06-18days on market $130,000 Active 18 DOM
-
2026-06-17days on market $130,000 Active 17 DOM
-
2026-06-16days on market $130,000 Active 16 DOM
-
2026-06-15days on market $130,000 Active 15 DOM
-
2026-06-13days on market $130,000 Active 13 DOM
-
2026-06-10days on market $130,000 Active 10 DOM
-
2026-06-09days on market $130,000 Active 9 DOM
-
2026-06-08days on market $130,000 Active 8 DOM
-
2026-06-07days on market $130,000 Active 7 DOM
-
2026-06-03days on market $130,000 Active 3 DOM
-
2026-06-02days on market $130,000 Active 2 DOM
-
2026-06-01remarks 699-char remark
-
2026-06-01$130,000 Active 1 DOM
ⓘ Source: listings_history table (triggers on properties + properties_extension) + one-shot
backfill from property_details.listing_events for pre-trigger history.
Tax reassessment forecast AL · Resets to sale price
- Current annual tax
- $1,131 · $94/mo
- Projected year-2 tax
- $1,131 · $94/mo
- Expected delta
- $0/yr ($0/mo · 0.0%)
ⓘ Screening estimate from a state-policy table — verify with the county assessor before closing.
Climate risk First Street
- Flood 1/10 Low FEMA zone X (unshaded) · 0% chance over 30 yrs
- Wildfire 1/10 Low
- Heat 6/10 Major 7 d/yr ≥105°F today · 19 d/yr by 30 yrs out
- Wind 6/10 Major 27% chance of damaging wind over 30 yrs
- Air quality 5/10 Major 7 unhealthy d/yr today · 9 by 30 yrs out
Nearby sold comps map
Loading sold comps map…
Walkable amenities ~0.75 mi
Loading nearby amenities…
Taxation est. · year 1
- Rental income
- $15,466
- − Mortgage interest
- −$7,282
- − Property taxes
- −$1,131
- − Insurance
- −$650
- − Repairs & maintenance
- −$1,237
- − Management
- −$1,237
- − Depreciation
- −$3,782
- Taxable income
- $147
- Est. tax owed @ 24.0%
- −$35
- After-tax cash flow
- $2,222/yr
For passive investors: Depreciation is non-cash, so a rental often shows a tax loss while cash-flowing — sheltering income. Rental losses are passive: they offset passive income freely, and up to $25,000/yr can offset ordinary (W-2) income if you actively participate and your MAGI is under $100k (phasing out to $0 by $150k); unused losses carry forward. On sale, claimed depreciation is recaptured at up to 25%, and gains may owe capital-gains tax (a 1031 exchange can defer both). Figures are a year-1 estimate at your 24.0% rate — not tax advice; consult a CPA.
Schools (NCES district)
- District
- Jefferson County
- NCES district ID
- 0101920
- Math proficiency
- 9% ▼ -24.00%
- Reading proficiency
- 32% ▼ -5.00%
- Median HH income
- $51,712
- Composite
- 18.4/100
- National rank
- #8937
- State rank
- #104 of 129 in AL
Livability — Center Point
- Score
- 63/100
- State rank
- #193
- US rank
- #15671
Category grades
Schools grade is shown separately in the Schools card above.
Census & demographics
- Census place
- Center Point, AL
- County
- Jefferson County · 527,445 people
- City population
- 210,422
- Metro
- Birmingham-Hoover, AL
- Population (ZIP)
- 43,903
- Household income
- $52,793
- Rent vs Own
- Severe rent burden
- 1729.0
Population outlook (Jefferson County) Hauer SSP2
- Today (2025)
- 669,185 people
- By 2030
- 669,694 · +0.1%
- By 2040
- 661,388 · -1.2%
- By 2050
- 643,086 · -3.9%
- By 2075
- 577,267 · -13.7%
- By 2100
- 474,758 · -29.1%
Race, ethnicity, and origin ACS 2023
- Neighborhood character
- Predominantly Black (75%)
- Race & ethnicity
- Black 75% White 15% Hispanic / Latino 7% Two or more races 3%
- Hispanic origin (detail)
- Mexican 4%
- Common ancestry
- Lithuanian 1% Italian 1% Slovak 1%
- Foreign-born
- 4% · Canada
- Languages at home
- 92% English-only · Spanish 7%
Political lean MEDSL · Jefferson
- 2024 margin
- D (+10.4) · D 54.6% · R 44.2% · Other 1.2%
- 2008→2024 swing
- +5.4pp toward D · 2008: 5.1pp · 2024: 10.4pp
- All cycles
- 2024: D+10.4 2020: D+13.2 2016: D+7.2 2012: D+6.0 2008: D+5.1
Not yet ingested
- Civics
- —
Market trends
- HPI YoY
- ▼ -112.97%
- Current HPI
- 215.0607
- Rent YoY
- ▲ 3.04%
- Metro
- Birmingham-Hoover, AL
- State GDP YoY
- ▲ 2.94%
- F500 in state
- 4
Industry mix (Fortune 500 HQ in AL)
| Industry | F500 HQs | Revenue |
|---|---|---|
| Financial Services | 1 | $8B |
|
||
| Healthcare | 1 | $5B |
|
||
Price history
+129.3% since first listed7 events — show timeline
- 2026-05-31 Listed $130,000 Greater Alabama MLS
- 2021-09-17 Sold (Public Records) $79,900 Public Records
- 2021-09-16 Sold (MLS) $79,900 Greater Alabama MLS
- 2021-08-03 Contingent — Greater Alabama MLS
- 2021-07-27 Listed $79,900 Greater Alabama MLS
- 2018-07-07 Price Changed $72,900 Greater Alabama MLS
- 1993-05-27 Sold (Public Records) $56,700 Public Records
Property tax history
+5.8%/yrLatest (2025): $1,131 · +0.0% YoY. Source: county tax records.
Cash-flow waterfall
monthlySold comps — $/sqft
last 12 mo · ≤1 miLoading sold comps…