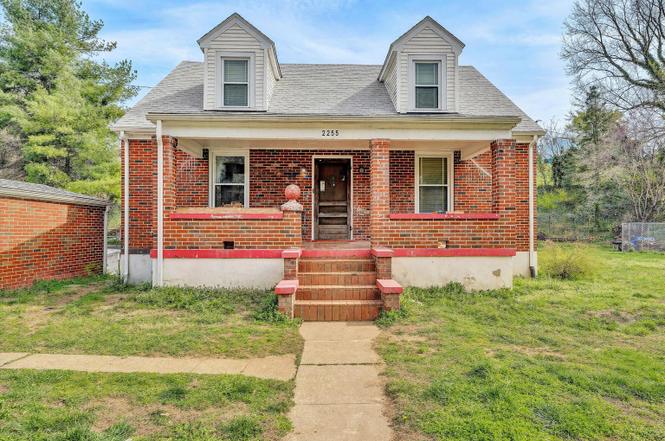
2255 Dunkirk Ave NE · Roanoke, VA
Flood risk 10/10 · Severe
- FEMA flood zone
- AE
- Chance of flooding over 30 yrs
- 0.99%
- Est. flood insurance / yr
- $2,026 – $9,024
Fire risk 1/10 · Minimal
- Est. fire insurance / yr
- $666 – $1,236
Heat risk 5/10 · Moderate
- Hot days now (above 101°F)
- 7 days/yr
- Hot days in 30 yrs
- 18 days/yr
Wind risk 2/10 · Minimal
- Chance of severe wind over 30 yrs
- 1.0%
Air-quality risk 2/10 · Minimal
- Unhealthy air days now
- 1 days/yr
- Unhealthy air days in 30 yrs
- 1 days/yr
Risk factors via First Street. Map © Google.
Why this score? — see what drove the D- grade
The composite is a weighted blend of 9 inputs, each scored 0–100. Each bar is that input's sub-score; the figure is the points it added to the 100-point composite (weight × sub-score).
- ARV discount +11.7/15.0
- Cash flow +7.2/30.0
- Rent growth +5.0/5.0
- Schools +4.1/10.0
- Livability +3.7/5.0
- Condition / age +2.5/5.0
- 1% rule +1.4/10.0
- DSCR +1.3/10.0
- Appreciation +0.0/10.0
$214,998
🖨 Deal sheet 📄 Offer letter ✓ Due diligence
Listing remarks MLS
Nice Brick home! This 4 Bedroom home has new Roof, Replacement windows, HVAC approx. 5 years old, Hot water heater 2 years old. Nice yard two porches & garage & carport! Sold in ''as-is'' seller to make no repairs. Inspections welcome for Purchasers info only. Seller to provide a home warranty for the first year.
Key facts
- Hardwood floors
- Replacement windows
- Detached garage
Tags
Neighborhood map
What this means for you Summary
Snapshot
- This is a 2-bed/1.0-bath single-family listed at $215k.
Deal economics
- At list price, monthly cash flow is $-761 ($-9k/yr) — negative.
- To cash-flow at today's rent, offer at most $81k (62.5% below list).
- To meet the 1% rule (rent ≥ 1% of price), the offer needs to be $138k (36.0% below list).
- Recommended offer: $81k (62.5% below list) — sets the bar for cash-flow.
Location & tenants
- Location reads 73/100 on livability (#163 in VA) — a middle-class / working-renter tenant base. Strengths: cost of living A+, health & safety A+, housing A; Watch: amenities C-, employment D, crime F.
- Roanoke City Public School District (urban): math 40% / reading 58% proficiency, ranked #102 of 131 in VA (top 78%) — families likely to look elsewhere, expect single-tenant / working-renter base with shorter leases; 67% free/reduced lunch — lower-income household profile, screen leases tightly.
- Zoned schools: Fallon Park Elementary (math 33% / reading 42%, grade F, #931 of 1,108 statewide, top 84%, 533 students, 99% FRL); John P. Fishwick Middle (math 33% / reading 60%, grade D+, #264 of 342 statewide, top 77%, 501 students, 98% FRL); William Fleming High (math 66% / reading 68%, grade B, #185 of 319 statewide, top 61%, 1,911 students, 96% FRL) — zoned schools average 98% FRL vs 67% district-wide (31 pts higher); higher-poverty schools than district average — tighter screening recommended.
- Market conditions: Rents rising fast (+10.5%/yr); 194 active listings in the ZIP; 15 comparable units currently listed for rent nearby; rentals lingering (median 44d on market — plan ~5-8 weeks vacancy on turnover, expect pricing pressure); 53% of comp listings sitting > 30 days — soft ceiling on asking rent; 113 units permitted in Roanoke city in 2024 (0 in 5+ unit buildings).
- This rent runs 31% of the median local income ($53k/yr) — at the standard rent-burdened threshold; future hikes will face affordability resistance.
Forward outlook
- Local home prices are declining (-3.0%/yr); year-one equity from $1k of loan paydown is wiped out by about $6k of value loss. Plan a longer hold.
- Roanoke County population projected at +11% by 2050 — modest demand growth; plan on rents tracking national, not racing it.
Negotiation context
- It's been on market 41 days — a 3% lower offer ($209k) is reasonable based on typical stale-listing flexibility.
- 3 sale attempts since 14y ago with the ask held roughly flat each time — persistent listings suggest the price (not the market) is what's stuck; bring a comps-based counter.
- Current owner paid $127k; list at $215k implies a 69% gain — meaningful room to come down on a strong offer.
Risks & watch-outs
- Watch-outs: flood insurance adds $460/mo; built in 1948 — expect roof / HVAC / electrical / plumbing capex.
- Climate carrying-cost: in FEMA flood zone AE (mandatory federal flood insurance); extreme-heat days projected 7→18/yr by 2055 (HVAC capex compounding) — expect insurance premiums to compound above CPI over the hold.
Questions for the listing agent
- What do current leases actually rent for vs. the listed asking? Can we see a recent rent roll and the last 12 months of T-12 income?
- It's been on market 41 days. Have you received any prior offers? Is the seller open to a 62% concession, seller financing, or rate buy-down credit?
- Built in 1948 — when were the roof, HVAC, electrical panel, plumbing, and water heater last replaced?
- What's the actual annual flood-insurance premium (NFIP or private), and is the property in a SFHA with mandatory coverage?
- Is there a deadline driving the sale (1031 exchange, divorce, estate, relocation)? That informs how much negotiation room exists.
- Schools are A-rated — typically a magnet for longer-tenancy family renters. What's the average tenant stay here, and is there a school-zone premium baked into asking?
- Crime grade is F in this area — have there been break-ins, vandalism, or insurance claims at this property in the last 3 years? What carrier currently insures it and at what premium?
- The area grade is low — what's the realistic commute time and amenity access for the typical tenant pool here? Any planned neighborhood developments (good or bad) we should know about?
- What's the average days-on-market for RENTAL listings here right now (not sales)? A rising rental-DOM trend means longer vacancies and softer asking-rent achievability than the comps imply.
- What's the recent tenant-quality profile in this submarket — average credit score on applications, eviction rate, late-payment / NSF rate, and stable-employment percentage? A property-management company in the area should have these aggregated.
- How much new for-sale + rental construction is in the pipeline within 1–3 miles? Heavy new supply typically softens prices + rents 12–24 months out; constrained supply supports both.
Investment metrics
- 1% rule
- 0.64% ✗
- Cap rate
- 4.62%
- Cash-on-cash
- -5.98%
- DSCR
- 0.73
- GRM
- 13.0
CMA / ARV
- ARV (on-the-fly)
- $237,150
- Comps found
- 12
Show comp detail 12 sales within ~0.75 mi
| Address | Dist | Beds/Ba | Sqft | Sold | Price | $/sf | Match |
|---|---|---|---|---|---|---|---|
| 421 7th St | 0.21mi | 3/1.0 (+1) | 1,252 (-2%) | 1mo | $100,000 | $80 | 81 |
| 446 Tinker Ave | 0.12mi | 2/1.0 | 1,200 (-6%) | 14mo | $196,000 | $163 | 73 |
| 2213 Carvin St NE | 0.18mi | 2/1.0 | 1,373 (+8%) | 7mo | $180,147 | $131 | 73 |
| 2315 Vale Ave | 0.07mi | 3/2.0 (+1) | 1,166 (-8%) | 4mo | $246,000 | $211 | 70 |
| 1526 20th St NE | 0.74mi | 2/1.0 | 1,240 (-3%) | 14mo | $139,950 | $113 | 50 |
| 2912 Vinyard Ave NE | 0.67mi | 3/2.0 (+1) | 1,295 (+2%) | 11mo | $280,000 | $216 | 48 |
| 440 W Cleveland Ave | 0.37mi | 3/2.0 (+1) | 1,368 (+7%) | 18mo | $120,000 | $88 | 47 |
| 520 S Poplar St | 0.69mi | 3/1.5 (+1) | 1,336 (+5%) | 10mo | $249,100 | $186 | 45 |
| 1522 Archbold Ave NE | 0.67mi | 3/2.5 (+1) | 1,260 (-1%) | 16mo | $250,000 | $198 | 43 |
| 303 E Madison Ave | 0.56mi | 2/1.0 | 1,122 (-12%) | 16mo | $195,500 | $174 | 41 |
| 1507 23rd St NE | 0.71mi | 3/2.0 (+1) | 1,139 (-11%) | 2mo | $249,000 | $219 | 39 |
| 305 N Blair St | 0.65mi | 2/2.0 | 1,399 (+10%) | 14mo | $262,500 | $188 | 38 |
Match score weights: distance 35% · size 25% · config 20% · recency 20%. Top-matched comps best support the ARV.
Projected returns pro-forma
-3.0% appreciation · 8.0% rent growth · sell at horizon
- IRR
- -38.0%
- Equity multiple
- -0.26×
- Total profit
- $-75,768
- Equity at exit
- $32,057
- IRR
- -25.7%
- Equity multiple
- -0.57×
- Total profit
- $-94,290
- Equity at exit
- $18,589
Cash invested: $60,199 (down + closing). Projections, not guarantees.
Landlord ↔ Tenant lean methodology
- Overall (STATE)
- 55 Moderately Landlord-Leaning
- State Virginia
- 55 Moderately Landlord-Leaning · D+2
- County
- — inherits STATE
- City
- — inherits STATE
ZIP-level market 24012
- Rents YoY
- 10.5%
- Active inventory
- 194
- Price-to-rent
- 13.0×
Monthly cashflow live
- Estimated rent
- $1,375 high interval (Pro) →
- Mortgage (P&I)
- −$1,127
- Tax from tax record
- −$169 /mo · $2,032/yr
- Insurance
- −$90
- Flood insurance flood zone
- −$460 /mo · $5,525/yr
- HOA
- −$0
- Vacancy / Maint / Mgmt
- −$289
- Net cashflow
- $-761
Break-even live
UW: 25.0% down · 7.5% · 30yr · 1.5% tax · 5.0% vac · 8.0% maint · 8.0% mgmt
Financing live
Cash to close
- Down payment
- $53,750
- Closing costs
- $6,450
- Reserves months
- —
- Total cash needed
- —
Loan-product check · same deal, 3 products live
Conventional
25% down · 7.5% · 30yr
- Down + closing
- —
- Monthly P&I
- —
- Monthly cashflow
- —
- DSCR
- —
- Eligible?
- —
Personal DTI + credit; lowest rate.
DSCR
20% down · 8.5% · 30yr
- Down + closing
- —
- Monthly P&I
- —
- Monthly cashflow
- —
- DSCR
- —
- Eligible?
- —
No personal income docs; deal must DSCR.
Hard money
10% down · 12.0% · 12mo
- Down + closing
- —
- Monthly P&I
- —
- Monthly cashflow
- —
- DSCR
- —
- Eligible?
- —
Short-term bridge; refi at stabilization.
Rent comps 15 comps
| Address | Beds | Baths | Sqft | Rent | $/sqft | DOM | Units | Dist |
|---|---|---|---|---|---|---|---|---|
| 1708 Baldwin Ave NE Unit A Roanoke, VA | 2.0 | 1.5 | 952 | $1,550 | $1.63 | 43d | 1 | 0.42mi |
| 233 W Cleveland Ave Vinton, VA | 2.0 | 1.0 | 1270 | $1,250 | $0.98 | 43d | 1 | 0.42mi |
| 2802 Vinyard Ave NE Unit 2 Roanoke, VA | 2.0 | 1.0 | 950 | $1,295 | $1.36 | 13d | 1 | 0.54mi |
| 2812 Vinyard Ave NE Unit 2 Roanoke, VA | 2.0 | 1.0 | 950 | $1,295 | $1.36 | 21d | 1 | 0.55mi |
| 317 Jefferson Ave Vinton, VA | 2.0 | 1.0 | 980 | $1,525 | $1.56 | 43d | 1 | 0.69mi |
| 312 Bowman St Unit 212 Vinton, VA | 2.0 | 1.0 | 1246 | $850 | $0.68 | 21d | 1 | 0.74mi |
| 528 E Cleveland Ave Unit 5 Vinton, VA | 2.0 | 1.0 | 889 | $1,495 | $1.68 | 43d | 1 | 0.80mi |
| 528 E Cleveland Ave Unit 6 Vinton, VA | 2.0 | 1.0 | 875 | $1,525 | $1.74 | 43d | 1 | 0.80mi |
| 1905 Wise Ave SE Roanoke, VA | 2.0 | 1.0 | 1044 | $1,123 | $1.08 | 13d | 1 | 0.85mi |
| 3006 Hickory Woods Dr NE Roanoke, VA | 1.0–3.0 | 1.0–2.0 | 922 | $1,608 | $1.74 | 13d | 20 | 0.93mi |
| 1817 Dale Ave SE Roanoke, VA | 3.0 | 1.0 | 1820 | $2,100 | $1.15 | 43d | 1 | 1.10mi |
| 3343 Glade Creek Blvd NE Roanoke, VA | 1.0–3.0 | 1.0–2.0 | 1131 | $1,802 | $1.59 | 13d | 28 | 1.13mi |
| 1016 15th St SE #2 Roanoke, VA | 3.0 | 1.5 | 1084 | $995 | $0.92 | 13d | 1 | 1.24mi |
| 909 13th St SE Roanoke, VA | 3.0 | 1.0 | 1870 | $1,199 | $0.64 | 43d | 1 | 1.36mi |
| 1015 12th St SE Roanoke, VA | 3.0 | 1.0 | 1072 | $923 | $0.86 | 43d | 1 | 1.47mi |
Listing history 10 events
-
2026-04-23status Pending
-
2026-04-08price $214,998
-
2026-03-13$222,998 Active
-
2021-01-13soldstatus $127,000
-
2021-01-13soldstatus $127,000
-
2021-01-12soldstatus $127,000 326-char remark
Show marketing remark (326 chars)
Nice Brick home! This 4 Bedroom home has new Roof, Replacement windows, HVAC approx. 5 years old, Hot water heater 2 years old. Nice yard two porches & garage & carport! Sold in ''as-is'' seller to make no repairs. Inspections welcome for Purchasers info only. Seller to provide a home warranty for the first year.
-
2020-11-23$132,500 326-char remark
Show marketing remark (326 chars)
Nice Brick home! This 4 Bedroom home has new Roof, Replacement windows, HVAC approx. 5 years old, Hot water heater 2 years old. Nice yard two porches & garage & carport! Sold in ''as-is'' seller to make no repairs. Inspections welcome for Purchasers info only. Seller to provide a home warranty for the first year.
-
2012-11-16soldstatus $87,000
-
2012-11-15soldstatus $87,000 210-char remark
Show marketing remark (210 chars)
Nice Brick Home with Front Sitting Porch, Single Garage & Carport. Back covered Porch- Priced to Sell! Sold in ''as-is'' condition except for termite letter. Inspections welcome for Purchasers info only.
-
2012-05-21$94,950 210-char remark
Show marketing remark (210 chars)
Nice Brick Home with Front Sitting Porch, Single Garage & Carport. Back covered Porch- Priced to Sell! Sold in ''as-is'' condition except for termite letter. Inspections welcome for Purchasers info only.
ⓘ Source: listings_history table (triggers on properties + properties_extension) + one-shot
backfill from property_details.listing_events for pre-trigger history.
Tax reassessment forecast VA · Resets to sale price
- Current annual tax
- $2,032 · $169/mo
- Projected year-2 tax
- $2,032 · $169/mo
- Expected delta
- $0/yr ($0/mo · 0.0%)
ⓘ Screening estimate from a state-policy table — verify with the county assessor before closing.
Climate risk First Street
- Flood 10/10 Extreme FEMA zone AE · 99% chance over 30 yrs
- Wildfire 1/10 Low
- Heat 5/10 Major 7 d/yr ≥101°F today · 18 d/yr by 30 yrs out
- Wind 2/10 Low 100% chance of damaging wind over 30 yrs
- Air quality 2/10 Low 1 unhealthy d/yr today · 1 by 30 yrs out
Nearby sold comps map
Loading sold comps map…
Walkable amenities ~0.75 mi
Loading nearby amenities…
Taxation est. · year 1
- Rental income
- $16,501
- − Mortgage interest
- −$12,043
- − Property taxes
- −$2,032
- − Insurance
- −$6,600
- − Repairs & maintenance
- −$1,320
- − Management
- −$1,320
- − Depreciation
- −$6,254
- Taxable loss
- −$13,069
- Est. tax savings @ 24.0%
- +$3,137
- After-tax cash flow
- $-5,990/yr
For passive investors: Depreciation is non-cash, so a rental often shows a tax loss while cash-flowing — sheltering income. Rental losses are passive: they offset passive income freely, and up to $25,000/yr can offset ordinary (W-2) income if you actively participate and your MAGI is under $100k (phasing out to $0 by $150k); unused losses carry forward. On sale, claimed depreciation is recaptured at up to 25%, and gains may owe capital-gains tax (a 1031 exchange can defer both). Figures are a year-1 estimate at your 24.0% rate — not tax advice; consult a CPA.
Schools (NCES district)
- District
- Roanoke City Public School District
- NCES district ID
- 5103300
- Math proficiency
- 40% ▼ -38.00%
- Reading proficiency
- 58% ▼ -12.00%
- Median HH income
- $38,592
- Composite
- 40.8/100
- National rank
- #3639
- State rank
- #102 of 131 in VA
Livability — Roanoke
- Score
- 73/100
- State rank
- #163
- US rank
- #5055
Category grades
Schools grade is shown separately in the Schools card above.
Census & demographics
- Census place
- Roanoke, VA
- County
- Roanoke City · 101,625 people
- City population
- 168,930
- Metro
- Roanoke, VA
- Population (ZIP)
- 28,235
- Household income
- $52,973
- Rent vs Own
- Severe rent burden
- 1360.0
Population outlook (Roanoke County) Hauer SSP2
- Today (2025)
- 106,094 people
- By 2030
- 108,927 · +2.7%
- By 2040
- 114,104 · +7.5%
- By 2050
- 118,032 · +11.3%
- By 2075
- 123,363 · +16.3%
- By 2100
- 116,827 · +10.1%
Race, ethnicity, and origin ACS 2023
- Neighborhood character
- Diverse neighborhood (Simpson 0.59)
- Race & ethnicity
- White 60% Black 16% Hispanic / Latino 14% Two or more races 13% Asian 4%
- Hispanic origin (detail)
- Mexican 4% Dominican 1%
- Common ancestry
- Romanian 2% Slovak 2% Serbian 1%
- Foreign-born
- 11% · Canada, Vietnam, Jamaica
- Languages at home
- 84% English-only · Spanish 11% Other Asian/Pacific 2% Vietnamese 2%
Political lean MEDSL · Roanoke
- 2024 margin
- Strong D (+23.6) · D 61.1% · R 37.5% · Other 1.4%
- 2008→2024 swing
- +0.2pp no change · 2008: 23.4pp · 2024: 23.6pp
- All cycles
- 2024: D+23.6 2020: D+25.8 2016: D+17.6 2012: D+21.5 2008: D+23.4
Not yet ingested
- Civics
- —
Market trends
- HPI YoY
- ▼ -137.94%
- Current HPI
- 186.9007
- Rent YoY
- ▲ 10.46%
- Metro
- Roanoke, VA
- State GDP YoY
- ▲ 2.40%
- F500 in state
- 50
Industry mix (Fortune 500 HQ in VA)
| Industry | F500 HQs | Revenue |
|---|---|---|
| Aerospace / Defense | 4 | $236B |
|
||
| Technology / Defense | 3 | $32B |
|
||
| Financial Services | 2 | $176B |
|
||
| Utilities | 2 | $27B |
|
||
| Insurance | 2 | $25B |
|
||
| Technology | 2 | $15B |
|
||
Price history
+126.4% since first listed10 events — show timeline
- 2026-04-23 Pending — MLSRV
- 2026-04-08 Price Changed $214,998 MLSRV
- 2026-03-13 Listed $222,998 MLSRV
- 2021-01-13 Sold (Public Records) $127,000 Public Records
- 2021-01-13 Sold (Public Records) $127,000 Public Records
- 2021-01-12 Sold (MLS) $127,000 MLSRV
- 2020-11-23 Listed $132,500 MLSRV
- 2012-11-16 Sold (Public Records) $87,000 Public Records
- 2012-11-15 Sold (MLS) $87,000 MLSRV
- 2012-05-21 Listed $94,950 MLSRV
Property tax history
+7.2%/yrLatest (2025): $2,032 · +7.1% YoY. Source: county tax records.
Cash-flow waterfall
monthlySold comps — $/sqft
last 12 mo · ≤1 miLoading sold comps…