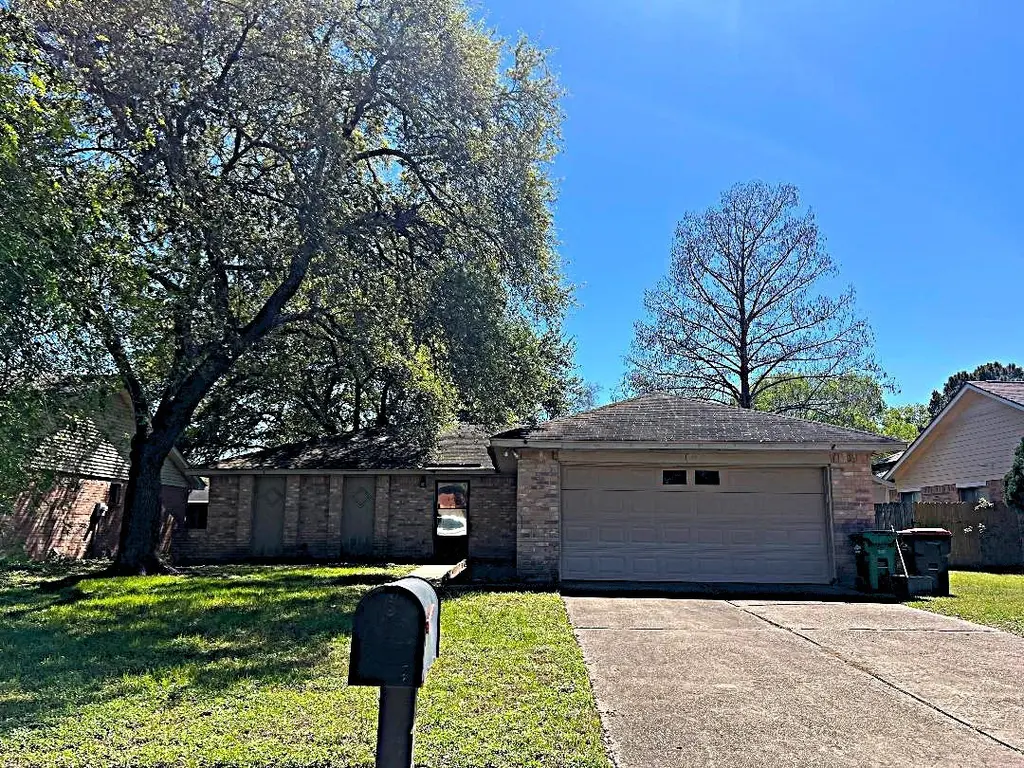
13907 Flagstone Dr · Houston, TX
Flood risk 4/10 · Minor
- FEMA flood zone
- X (unshaded)
- Chance of flooding over 30 yrs
- 0.2%
- Est. flood insurance / yr
- $507 – $1,088
Fire risk 1/10 · Minimal
- Est. fire insurance / yr
- $1,222 – $2,270
Heat risk 9/10 · Severe
- Hot days now (above 110°F)
- 7 days/yr
- Hot days in 30 yrs
- 21 days/yr
Wind risk 8/10 · Major
- Chance of severe wind over 30 yrs
- 99.0%
Air-quality risk 3/10 · Minor
- Unhealthy air days now
- 2 days/yr
- Unhealthy air days in 30 yrs
- 3 days/yr
Risk factors via First Street. Map © Google.
Why this score? — see what drove the D grade
The composite is a weighted blend of 9 inputs, each scored 0–100. Each bar is that input's sub-score; the figure is the points it added to the 100-point composite (weight × sub-score).
- ARV discount +14.0/15.0
- Cash flow +7.0/30.0
- Schools +4.4/10.0
- Appreciation +4.3/10.0
- Livability +3.7/5.0
- 1% rule +3.2/10.0
- Rent growth +2.6/5.0
- Condition / age +2.5/5.0
- DSCR +1.2/10.0
$185,000
🖨 Deal sheet (PDF) 📄 Offer letter ✓ Due diligence
Listing remarks MLS
This home has many windows, allowing plenty of natural sunlight to flow into every room, creating a bright, comfortable atmosphere. Soaring ceilings and a split floor plan make this home ideal for both comfortable living and entertaining. Fresh paint, move-in-ready home in a quiet, well-established community! Tile flooring throughout. The kitchen comes equipped with electric stove, refrigerator, microwave, garbage disposal, and W/D. Low-E windows help reduce electricity costs by improving energy efficiency in both hot summers and cold winters. They are also easy to remove for cleaning. The second bedroom has a large walk-in closet. All room dimensions are approximate and should be independently verified. The backyard includes a good-sized storage shed. Conveniently located with easy access to Hwy 529, 6, and 290. Zoned to the highly regarded Cypress-Fairbanks ISD. Whether it's a home or a great investment property offering an excellent combination of location, functionality, and value.
Key facts
- Spacious backyard
- Split floor plan
- Storage shed
Tags
Neighborhood map
What this means for you Summary
Snapshot
- This is a 2-bed/2.0-bath single-family listed at $185k.
Deal economics
- At list price, monthly cash flow is $-273 ($-3k/yr) — negative.
- To cash-flow at today's rent, offer at most $137k (26.1% below list).
- To meet the 1% rule (rent ≥ 1% of price), the offer needs to be $151k (18.2% below list).
- Recommended offer: $137k (26.1% below list) — sets the bar for cash-flow.
- Cap rate 4.5% vs local median 3.2% in Houston — top-decile yield for the area; either an underpriced asset or a hidden risk that comps aren't pricing in. Stress-test before assuming the spread holds.
Location & tenants
- Location reads 74/100 on livability (#184 in TX, #4,771 nationally) — a middle-class / working-renter tenant base. Strengths: amenities A+, cost of living A+, housing A+; Watch: crime F.
- Cypress-Fairbanks ISD (suburban): math 45% / reading 52% proficiency, ranked #161 of 826 in TX (top 20%) — families likely to look elsewhere, expect single-tenant / working-renter base with shorter leases.
- Zoned schools: Hairgrove El (math 52% / reading 53%, grade C-, #720 of 4,322 statewide, top 17%, 769 students, 88% FRL); Labay Middle (math 46% / reading 47%, grade D+, #443 of 1,662 statewide, top 28%, 1,199 students, 70% FRL); Cypress-Fairbanks J J A E P (12 students, 0% FRL).
- Market conditions: Rents flat; 177 active listings in the ZIP; 40 comparable units currently listed for rent nearby; rentals at typical pace (median 15d on market — plan ~3-4 weeks tenant-placement turnaround); solid renter incomes; 29,883 units permitted in Harris County in 2024 (8,621 in 5+ unit buildings).
Forward outlook
- Local home prices are declining (-1.5%/yr); year-one equity from $1k of loan paydown is wiped out by about $3k of value loss. Plan a longer hold.
- Harris County population projected at +47% by 2050 — long-run rental-demand tailwind backs the buy-and-hold thesis.
Negotiation context
- It's been on market 85 days — a 6% lower offer ($174k) is reasonable based on typical stale-listing flexibility.
- 4 sale attempts since 17y ago; this cycle's ask has dropped $15k (8%) from the opening price — seller is motivated, your offer sets the floor, not the list.
- Current owner paid $46k; list at $185k implies a 303% gain — meaningful room to come down on a strong offer.
Risks & watch-outs
- Climate carrying-cost: severe wind risk, 99% chance of damaging wind over 30y; extreme-heat days projected 7→21/yr by 2055 (HVAC capex compounding) — expect insurance premiums to compound above CPI over the hold.
Questions for the listing agent
- What do current leases actually rent for vs. the listed asking? Can we see a recent rent roll and the last 12 months of T-12 income?
- It's been on market 85 days. Have you received any prior offers? Is the seller open to a 26% concession, seller financing, or rate buy-down credit?
- What does the HOA fee cover, when was the last increase, and are there any pending special assessments or reserve-fund shortfalls?
- Why hasn't it sold? Are there any deal-killer items the seller is aware of (foundation, flood, title, zoning, code violations)?
- Is there a deadline driving the sale (1031 exchange, divorce, estate, relocation)? That informs how much negotiation room exists.
- Schools are D-rated, which usually means shorter tenancies and higher turnover. Who's the typical renter profile here, and what's been the actual vacancy rate?
- Crime grade is F in this area — have there been break-ins, vandalism, or insurance claims at this property in the last 3 years? What carrier currently insures it and at what premium?
- The area grade is low — what's the realistic commute time and amenity access for the typical tenant pool here? Any planned neighborhood developments (good or bad) we should know about?
- What's the average days-on-market for RENTAL listings here right now (not sales)? A rising rental-DOM trend means longer vacancies and softer asking-rent achievability than the comps imply.
- What's the recent tenant-quality profile in this submarket — average credit score on applications, eviction rate, late-payment / NSF rate, and stable-employment percentage? A property-management company in the area should have these aggregated.
- How much new for-sale + rental construction is in the pipeline within 1–3 miles? Heavy new supply typically softens prices + rents 12–24 months out; constrained supply supports both.
Investment metrics
- 1% rule
- 0.82% ✗
- Cap rate
- 4.52%
- Cash-on-cash
- -6.32%
- DSCR
- 0.72
- GRM
- 10.2
CMA / ARV
- ARV (median comp)
- $216,412
- List price
- $185,000
- Delta
- -14.51%
- Verdict
- UNDERPRICED
- Comps
- 20 within 1.0 mi
Show comp detail 12 sales within ~0.75 mi
| Address | Dist | Beds/Ba | Sqft | Sold | Price | $/sf | Match |
|---|---|---|---|---|---|---|---|
| 7614 Andiron Cir | 0.07mi | 2/2.0 | 1,248 (0%) | 11mo | $224,990 | $180 | 88 |
| 7614 Kite Hill Dr | 0.20mi | 3/2.0 (+1) | 1,301 (+4%) | 4mo | $195,000 | $150 | 75 |
| 7407 Wovenwood Lane Ln | 0.22mi | 2/2.0 | 1,160 (-7%) | 12mo | $169,999 | $147 | 68 |
| 7439 Kite Hill Dr | 0.24mi | 3/2.0 (+1) | 1,356 (+9%) | 2mo | $219,000 | $162 | 68 |
| 7607 Wovenwood Ln | 0.07mi | 3/2.0 (+1) | 1,430 (+15%) | 6mo | $215,000 | $150 | 62 |
| 7534 Shaddock Dr | 0.39mi | 3/2.0 (+1) | 1,125 (-10%) | 3mo | $230,000 | $204 | 58 |
| 13222 Noblecrest Dr | 0.65mi | 3/2.0 (+1) | 1,348 (+8%) | 2mo | $212,000 | $157 | 49 |
| 7331 Burkridge Dr | 0.70mi | 3/2.0 (+1) | 1,302 (+4%) | 8mo | $229,900 | $177 | 49 |
| 13322 Chaston Dr | 0.58mi | 3/2.0 (+1) | 1,364 (+9%) | 6mo | $219,997 | $161 | 47 |
| 7507 Lemma Dr | 0.52mi | 3/2.0 (+1) | 1,099 (-12%) | 11mo | $220,000 | $200 | 42 |
| 13215 Vista Oro Dr | 0.64mi | 3/1.5 (+1) | 1,430 (+15%) | 2mo | $169,900 | $119 | 37 |
| 13143 Pebblewalk Cir S | 0.74mi | 3/2.0 (+1) | 1,085 (-13%) | 4mo | $149,900 | $138 | 36 |
Match score weights: distance 35% · size 25% · config 20% · recency 20%. Top-matched comps best support the ARV.
Projected returns pro-forma
-1.47% appreciation · 0.25% rent growth · sell at horizon
- IRR
- -19.0%
- Equity multiple
- 0.24×
- Total profit
- $-39,127
- Equity at exit
- $40,523
- IRR
- -16.1%
- Equity multiple
- -0.17×
- Total profit
- $-60,553
- Equity at exit
- $39,122
Cash invested: $51,800 (down + closing). Projections, not guarantees.
Landlord ↔ Tenant lean methodology
- Overall (STATE)
- 87 Strongly Landlord-Friendly
- State Texas
- 87 Strongly Landlord-Friendly · R+5
- County
- — inherits STATE
- City
- — inherits STATE
ZIP-level market 77041
- Home prices YoY
- -0.6%
- Rents YoY
- 0.2%
- Active inventory
- 177
- Price-to-rent
- 10.2×
Monthly cashflow live
- Estimated rent
- $1,513 high interval (Pro) →
- Mortgage (P&I)
- −$970
- Tax from tax record
- −$383 /mo · $4,590/yr
- Insurance
- −$77
- HOA
- −$38
- Vacancy / Maint / Mgmt
- −$318
- Net cashflow
- $-273
Break-even live
Sensitivity live
| Price | -10% $-168 | -5% $-220 | +0% $-273 | +5% $-325 | +10% $-378 |
|---|---|---|---|---|---|
| Rent | -10% $-392 | -5% $-333 | +0% $-273 | +5% $-213 | +10% $-153 |
| Rate | -1.0pp $-180 | -0.5pp $-226 | base $-273 | +0.5pp $-321 | +1.0pp $-370 |
UW: 25.0% down · 7.5% · 30yr · 1.5% tax · 5.0% vac · 8.0% maint · 8.0% mgmt
Financing live
Cash to close
- Down payment
- $46,250
- Closing costs
- $5,550
- Reserves months
- —
- Total cash needed
- —
Loan-product check · same deal, 3 products live
Conventional
25% down · 7.5% · 30yr
- Down + closing
- —
- Monthly P&I
- —
- Monthly cashflow
- —
- DSCR
- —
- Eligible?
- —
Personal DTI + credit; lowest rate.
DSCR
20% down · 8.5% · 30yr
- Down + closing
- —
- Monthly P&I
- —
- Monthly cashflow
- —
- DSCR
- —
- Eligible?
- —
No personal income docs; deal must DSCR.
Hard money
10% down · 12.0% · 12mo
- Down + closing
- —
- Monthly P&I
- —
- Monthly cashflow
- —
- DSCR
- —
- Eligible?
- —
Short-term bridge; refi at stabilization.
Rent comps 40 comps
| Address | Beds | Baths | Sqft | Rent | $/sqft | DOM | Units | Dist |
|---|---|---|---|---|---|---|---|---|
| 8261 Sunbury Ln Houston, TX | 2.0 | 2.0 | 900 | $1,322 | $1.47 | 45d | 1 | 0.70mi |
| 14811 West Rd Houston, TX | 2.0 | 2.0 | 943 | $1,455 | $1.54 | 26d | 1 | 0.71mi |
| 14811 West Rd Houston, TX | 2.0 | 2.0 | 943 | $1,455 | $1.54 | 45d | 1 | 0.71mi |
| 14811 West Rd Unit 422 Houston, TX | 2.0 | 2.0 | 1081 | $1,658 | $1.53 | 9d | 1 | 0.74mi |
| 14811 West Rd Unit 324 Houston, TX | 1.0 | 1.0 | 730 | $1,393 | $1.91 | 9d | 1 | 0.74mi |
| 14811 West Rd Unit 325 Houston, TX | 1.0 | 1.0 | 730 | $1,382 | $1.89 | 0d | 1 | 0.74mi |
| 14811 West Rd Unit 14838 Houston, TX | 2.0 | 2.0 | 943 | $1,599 | $1.70 | 14d | 1 | 0.74mi |
| 14811 West Rd Unit 14826 Houston, TX | 1.0 | 1.0 | 730 | $1,432 | $1.96 | 12d | 1 | 0.74mi |
| 14811 West Rd Unit 425 Houston, TX | 2.0 | 2.0 | 1081 | $1,642 | $1.52 | 0d | 1 | 0.74mi |
| 14811 West Rd Unit 424 Houston, TX | 2.0 | 2.0 | 1081 | $1,658 | $1.53 | 7d | 1 | 0.74mi |
| 14811 West Rd Unit 14832 Houston, TX | 1.0 | 1.0 | 730 | $1,423 | $1.95 | 45d | 1 | 0.74mi |
| 14811 West Rd Unit 14848 Houston, TX | 2.0 | 2.0 | 1187 | $1,809 | $1.52 | 45d | 1 | 0.74mi |
| 14811 West Rd Unit 14826 Houston, TX | 1.0 | 1.0 | 730 | $1,428 | $1.96 | 14d | 1 | 0.74mi |
| 14811 West Rd Unit 14834 Houston, TX | 2.0 | 2.0 | 1081 | $1,682 | $1.56 | 12d | 1 | 0.74mi |
| 8200 Sunbury Ln Houston, TX | 2.0 | 2.0 | 800 | $1,164 | $1.46 | 45d | 1 | 0.75mi |
| 8523 Jackrabbit Rd Houston, TX | 1.0 | 1.0 | 890 | $1,280 | $1.44 | 26d | 1 | 0.76mi |
| 13200 Firebrick Dr Houston, TX | 2.0 | 2.0 | 1131 | $1,708 | $1.51 | 26d | 1 | 0.76mi |
| 8255 Sunbury Ln Apt 424 Houston, TX | 2.0 | 2.0 | 900 | $1,051 | $1.17 | 18d | 1 | 0.84mi |
| 8255 Sunbury Ln Unit 8288 Houston, TX | 3.0 | 2.0 | 1185 | $1,561 | $1.32 | 18d | 1 | 0.84mi |
| 18 Easton Commons Dr Houston, TX | 2.0 | 1.0 | 800 | $1,123 | $1.40 | 19d | 1 | 0.89mi |
| 8255 Sunbury Ln Houston, TX | 1.0–3.0 | 1.0–2.0 | 892 | $1,304 | $1.46 | 1d | 27 | 0.90mi |
| 8255 Sunbury Ln Houston, TX | 1.0 | 1.0 | 781 | $985 | $1.26 | 45d | 1 | 0.90mi |
| 8440 Easton Commons Dr Unit 2165 Houston, TX | 2.0 | 2.0 | 907 | $1,193 | $1.32 | 0d | 1 | 0.97mi |
| 8440 Easton Commons Dr Unit 8497 Houston, TX | 2.0 | 2.0 | 907 | $1,233 | $1.36 | 12d | 1 | 0.97mi |
| 13339 West Rd Houston, TX | 2.0 | 2.0 | 1327 | $1,500 | $1.13 | 45d | 1 | 1.06mi |
| 15125 West Rd Houston, TX | 1.0–3.0 | 1.0–2.0 | 969 | $1,528 | $1.58 | 1d | 29 | 1.10mi |
| 8550 Easton Commons Dr Unit 8607 Houston, TX | 2.0 | 2.0 | 725 | $1,147 | $1.58 | 18d | 1 | 1.11mi |
| 8550 Easton Commons Dr Unit 8571 Houston, TX | 1.0 | 1.0 | 890 | $1,262 | $1.42 | 18d | 1 | 1.11mi |
| 8550 Easton Commons Dr Unit 8583 Houston, TX | 3.0 | 2.0 | 1325 | $1,837 | $1.39 | 18d | 1 | 1.11mi |
| 13330 West Rd Houston, TX | 1.0–3.0 | 1.0–2.0 | 1021 | $1,472 | $1.44 | 0d | 38 | 1.11mi |
| 13333 West Rd Unit 2162 Houston, TX | 2.0 | 2.0 | 995 | $1,415 | $1.42 | 7d | 1 | 1.14mi |
| 13333 West Rd Unit 13370 Houston, TX | 2.0 | 2.0 | 995 | $1,439 | $1.45 | 12d | 1 | 1.14mi |
| 13333 West Rd Unit 525 Houston, TX | 3.0 | 2.0 | 1337 | $1,873 | $1.40 | 0d | 1 | 1.14mi |
| 13333 West Rd Unit 2165 Houston, TX | 2.0 | 2.0 | 995 | $1,440 | $1.45 | 0d | 1 | 1.14mi |
| 13333 West Rd Unit 3174 Houston, TX | 3.0 | 2.0 | 1337 | $1,924 | $1.44 | 0d | 1 | 1.14mi |
| 13333 West Rd Unit 422 Houston, TX | 2.0 | 2.0 | 995 | $1,415 | $1.42 | 9d | 1 | 1.14mi |
| 13333 West Rd Unit 13366 Houston, TX | 3.0 | 2.0 | 1337 | $1,934 | $1.45 | 45d | 1 | 1.14mi |
| 13333 West Rd Unit 2228 Houston, TX | 2.0 | 2.0 | 995 | $1,399 | $1.41 | 0d | 1 | 1.14mi |
| 13333 West Rd Unit 13354 Houston, TX | 1.0 | 1.0 | 809 | $1,319 | $1.63 | 14d | 1 | 1.14mi |
| 13333 West Rd Unit 13390 Houston, TX | 2.0 | 2.0 | 995 | $1,500 | $1.51 | 45d | 1 | 1.14mi |
HOA detail
- Monthly dues
- $38 · $456/yr
- Likely covers
- trashelectric
Listing history 18 events
-
2026-06-15statusdays on market $185,000 Pending 85 DOM
-
2026-06-13days on market $185,000 Active 84 DOM
-
2026-06-13days on market $185,000 Active 83 DOM
-
2026-06-09days on market $185,000 Active 80 DOM
-
2026-05-31days on market $185,000 Active 79 DOM
-
2026-05-16price $185,000 1000-char remark
Show marketing remark (1000 chars)
This home has many windows, allowing plenty of natural sunlight to flow into every room, creating a bright, comfortable atmosphere. Soaring ceilings and a split floor plan make this home ideal for both comfortable living and entertaining. Fresh paint, move-in-ready home in a quiet, well-established community! Tile flooring throughout. The kitchen comes equipped with electric stove, refrigerator, microwave, garbage disposal, and W/D. Low-E windows help reduce electricity costs by improving energy efficiency in both hot summers and cold winters. They are also easy to remove for cleaning. The second bedroom has a large walk-in closet. All room dimensions are approximate and should be independently verified. The backyard includes a good-sized storage shed. Conveniently located with easy access to Hwy 529, 6, and 290. Zoned to the highly regarded Cypress-Fairbanks ISD. Whether it's a home or a great investment property offering an excellent combination of location, functionality, and value.
-
2026-03-13$200,000 Active 1000-char remark
Show marketing remark (1000 chars)
This home has many windows, allowing plenty of natural sunlight to flow into every room, creating a bright, comfortable atmosphere. Soaring ceilings and a split floor plan make this home ideal for both comfortable living and entertaining. Fresh paint, move-in-ready home in a quiet, well-established community! Tile flooring throughout. The kitchen comes equipped with electric stove, refrigerator, microwave, garbage disposal, and W/D. Low-E windows help reduce electricity costs by improving energy efficiency in both hot summers and cold winters. They are also easy to remove for cleaning. The second bedroom has a large walk-in closet. All room dimensions are approximate and should be independently verified. The backyard includes a good-sized storage shed. Conveniently located with easy access to Hwy 529, 6, and 290. Zoned to the highly regarded Cypress-Fairbanks ISD. Whether it's a home or a great investment property offering an excellent combination of location, functionality, and value.
-
2014-12-02soldstatus
-
2014-12-01soldstatus Sold 193-char remark
Show marketing remark (193 chars)
Quality remodel, cute as a button and a great back yard. Take a look at this split floor plan and make your appt today. Great street and easy access to 529, hwy 6, and 290. It won't last long.
-
2014-11-30status Pending 193-char remark
Show marketing remark (193 chars)
Quality remodel, cute as a button and a great back yard. Take a look at this split floor plan and make your appt today. Great street and easy access to 529, hwy 6, and 290. It won't last long.
-
2014-11-07status Active 193-char remark
Show marketing remark (193 chars)
Quality remodel, cute as a button and a great back yard. Take a look at this split floor plan and make your appt today. Great street and easy access to 529, hwy 6, and 290. It won't last long.
-
2014-10-23status Pending, Continue to Show 193-char remark
Show marketing remark (193 chars)
Quality remodel, cute as a button and a great back yard. Take a look at this split floor plan and make your appt today. Great street and easy access to 529, hwy 6, and 290. It won't last long.
-
2014-10-13status Option Pending 193-char remark
Show marketing remark (193 chars)
Quality remodel, cute as a button and a great back yard. Take a look at this split floor plan and make your appt today. Great street and easy access to 529, hwy 6, and 290. It won't last long.
-
2014-09-26$97,000 Active 193-char remark
Show marketing remark (193 chars)
Quality remodel, cute as a button and a great back yard. Take a look at this split floor plan and make your appt today. Great street and easy access to 529, hwy 6, and 290. It won't last long.
-
2009-06-20historical
-
2009-05-23$83,900
-
1996-10-21soldstatus $45,850
-
1990-11-01soldstatus $41,111
ⓘ Source: listings_history table (triggers on properties + properties_extension) + one-shot
backfill from property_details.listing_events for pre-trigger history.
Tax reassessment forecast TX · Resets to sale price
- Current annual tax
- $4,590 · $383/mo
- Projected year-2 tax
- $4,590 · $383/mo
- Expected delta
- $0/yr ($0/mo · 0.0%)
ⓘ Screening estimate from a state-policy table — verify with the county assessor before closing.
Climate risk First Street
- Flood 4/10 Moderate FEMA zone X (unshaded) · 20% chance over 30 yrs
- Wildfire 1/10 Low
- Heat 9/10 Extreme 7 d/yr ≥110°F today · 21 d/yr by 30 yrs out
- Wind 8/10 Severe 99% chance of damaging wind over 30 yrs
- Air quality 3/10 Moderate 2 unhealthy d/yr today · 3 by 30 yrs out
Nearby sold comps map
Loading sold comps map…
Walkable amenities ~0.75 mi
Loading nearby amenities…
Taxation est. · year 1
- Rental income
- $18,151
- − Mortgage interest
- −$10,363
- − Property taxes
- −$4,590
- − Insurance
- −$925
- − Repairs & maintenance
- −$1,452
- − Management
- −$1,452
- − HOA
- −$456
- − Depreciation
- −$5,382
- Taxable loss
- −$6,469
- Est. tax savings @ 24.0%
- +$1,553
- After-tax cash flow
- $-1,721/yr
For passive investors: Depreciation is non-cash, so a rental often shows a tax loss while cash-flowing — sheltering income. Rental losses are passive: they offset passive income freely, and up to $25,000/yr can offset ordinary (W-2) income if you actively participate and your MAGI is under $100k (phasing out to $0 by $150k); unused losses carry forward. On sale, claimed depreciation is recaptured at up to 25%, and gains may owe capital-gains tax (a 1031 exchange can defer both). Figures are a year-1 estimate at your 24.0% rate — not tax advice; consult a CPA.
Schools (NCES district)
- District
- Cypress-Fairbanks ISD
- NCES district ID
- 4816110
- Math proficiency
- 45% ▼ -12.00%
- Reading proficiency
- 52% ▼ -2.00%
- Median HH income
- $72,025
- Composite
- 43.63/100
- National rank
- #2968
- State rank
- #161 of 826 in TX
Livability — Houston
- Score
- 74/100
- State rank
- #184
- US rank
- #4771
Category grades
Schools grade is shown separately in the Schools card above.
Census & demographics
- County
- Harris County · 4,702,590 people
- City population
- 3,226,434
- Metro
- Houston-The Woodlands-Sugar Land, TX
- Population (ZIP)
- 33,349
- Household income
- $77,083
- Rent vs Own
- Severe rent burden
- 537.0
Population outlook (Harris County) Hauer SSP2
- Today (2025)
- 5,571,493 people
- By 2030
- 6,089,821 · +9.3%
- By 2040
- 7,142,806 · +28.2%
- By 2050
- 8,185,864 · +46.9%
- By 2075
- 10,574,329 · +89.8%
- By 2100
- 12,109,958 · +117.4%
Race, ethnicity, and origin ACS 2023
- Neighborhood character
- Diverse neighborhood (Simpson 0.67)
- Race & ethnicity
- Hispanic / Latino 50% Two or more races 25% White 23% Asian 16% Black 9% Native American 3%
- Hispanic origin (detail)
- Mexican 36% Cuban 2% Salvadoran 1%
- Common ancestry
- Italian 1% Portuguese 1% Romanian 1%
- Foreign-born
- 38% · Canada, Vietnam, China
- Languages at home
- 45% English-only · Spanish 39% Vietnamese 8% Other Indo-European 3%
Political lean MEDSL · Harris
- 2024 margin
- Lean D (+5.5) · D 52.0% · R 46.4% · Other 1.6%
- 2008→2024 swing
- +3.9pp toward D · 2008: 1.6pp · 2024: 5.5pp
- All cycles
- 2024: D+5.5 2020: D+13.3 2016: D+12.4 2012: D+0.1 2008: D+1.6
Not yet ingested
- Civics
- —
Market trends
- HPI YoY
- ▼ -1.47%
- Current HPI
- 241.5096
- Rent YoY
- ▲ 0.25%
- Metro
- Houston-The Woodlands-Sugar Land, TX
- State GDP YoY
- ▲ 3.95%
- F500 in state
- 110
Industry mix (Fortune 500 HQ in TX)
| Industry | F500 HQs | Revenue |
|---|---|---|
| Energy | 16 | $1,198B |
|
||
| Technology | 5 | $198B |
|
||
| Engineering / Construction | 4 | $72B |
|
||
| Energy Services | 3 | $60B |
|
||
| Utilities | 3 | $41B |
|
||
| Healthcare | 2 | $330B |
|
||
Price history
+350.0% since first listed13 events — show timeline
- 2026-05-16 Price Changed $185,000 HARMLS
- 2026-03-13 Listed $200,000 HARMLS
- 2014-12-02 Sold (Public Records) — Public Records
- 2014-12-01 Sold (MLS) — HARMLS
- 2014-11-30 Pending — HARMLS
- 2014-11-07 Relisted — HARMLS
- 2014-10-23 Pending — HARMLS
- 2014-10-13 Pending — HARMLS
- 2014-09-26 Listed $97,000 HARMLS
- 2009-06-20 Listing Removed — HARMLS
- 2009-05-23 Listed $83,900 HARMLS
- 1996-10-21 Sold (Public Records) $45,850 Public Records
- 1990-11-01 Sold (Public Records) $41,111 Public Records
Property tax history
+3.2%/yrLatest (2025): $4,590 · -7.0% YoY. Source: county tax records.
Cash-flow waterfall
monthlySold comps — $/sqft
last 12 mo · ≤1 miLoading sold comps…