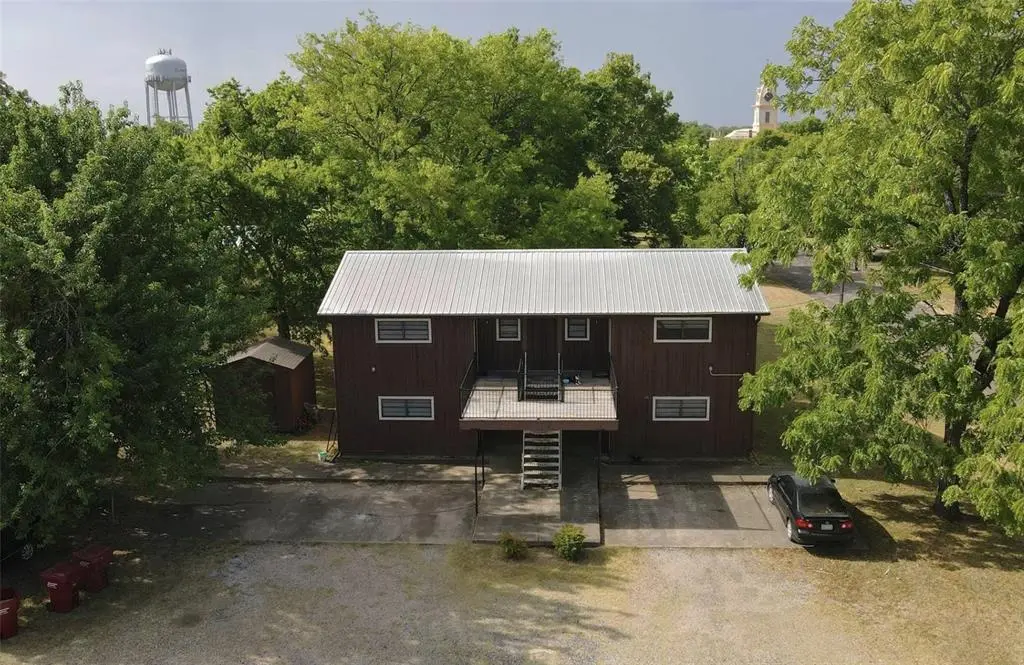
 Fourplex
104 E South St · Clarksville, TX
Flood risk 1/10 · Minimal
- FEMA flood zone
- X
- Chance of flooding over 30 yrs
- 0.0%
- Est. flood insurance / yr
- $507 – $1,088
Fire risk 6/10 · Moderate
- Est. fire insurance / yr
- $1,222 – $2,270
Heat risk 7/10 · Major
- Hot days now (above 110°F)
- 7 days/yr
- Hot days in 30 yrs
- 22 days/yr
Wind risk 4/10 · Minor
- Chance of severe wind over 30 yrs
- 18.0%
Air-quality risk 2/10 · Minimal
- Unhealthy air days now
- 0 days/yr
- Unhealthy air days in 30 yrs
- 1 days/yr
Risk factors via First Street. Map © Google.
Why this score? — see what drove the B+ grade
The composite is a weighted blend of 9 inputs, each scored 0–100. Each bar is that input's sub-score; the figure is the points it added to the 100-point composite (weight × sub-score).
- Cash flow +30.0/30.0
- 1% rule +10.0/10.0
- DSCR +10.0/10.0
- Appreciation +10.0/10.0
- ARV discount +7.5/15.0
- Livability +3.4/5.0
- Rent growth +2.5/5.0
- Schools +1.9/10.0
- Condition / age +1.0/5.0
$269,000
🖨 Deal sheet 📄 Offer letter ✓ Due diligence
Multi-family units
County records classify this as Multi-Family (2-4 Unit). Listing-text estimate: 4 units. confirmed
Listing remarks MLS
Check out this 4-Plex. Perfect starter for a portfolio or an addition for a seasoned investor. Property is located at 104 W South St in Clarksville, TX, presents a value add opportunity. Rents are in high demand, income producing with immediate opportunity for value add. Tenants pay electricity and owner pays water. Call today, Seller will look at all reasonable offers.
Key facts
- 0.46 acre lot
- 5 parking spots
- Built 1984
Neighborhood map
What this means for you Summary
Snapshot
- This is a 4 × 2-bed/1-bath units multifamily listed at $269k. Condition is rated poor.
Deal economics
- At list price, monthly cash flow is $2k ($19k/yr) — positive. Per door: $404/mo.
- The deal already cash-flows at list — no discount required.
- Meets the 1% rule at list price ($4k rent vs $269k).
- Recommended offer: $237k (12.0% below list) — sets the bar for market timing.
- Cap rate 13.5% vs local median 6.1% in Clarksville — top-decile yield for the area; either an underpriced asset or a hidden risk that comps aren't pricing in. Stress-test before assuming the spread holds.
Location & tenants
- Location reads 67/100 on livability (#523 in TX) — a middle-class / working-renter tenant base. Strengths: crime A+, cost of living A+; Watch: schools F, amenities F, commute F.
- Clarksville ISD (town): math 20% / reading 27% proficiency, ranked #752 of 826 in TX (top 91%) — low school quality limits family demand, transient renter base, plan for 1-2y turnover; 77% free/reduced lunch — lower-income household profile, screen leases tightly.
- Market conditions: 87 active listings in the ZIP; 14 units permitted in Red River County in 2024 (0 in 5+ unit buildings).
Forward outlook
- In year one you build about $29k of equity ($2k loan paydown + $27k appreciation (10.0% local appreciation)).
- Red River County population projected at -25% by 2050 — secular population decline; favor cash flow + early exit over multi-decade hold.
- At projected returns (10.0% appreciation + 3.0% rent growth), your $75k cash investment doubles in ~2 years — after that, you're playing with house money.
- By year 2, paydown + projected appreciation supports a ~$46k cash-out refi (75% LTV) — recoverable capital for the next deal without selling this one.
Negotiation context
- It's been on market 137 days — a 12% lower offer ($237k) is reasonable based on typical stale-listing flexibility.
Risks & watch-outs
- Climate carrying-cost: major wildfire risk; extreme-heat days projected 7→22/yr by 2055 (HVAC capex compounding) — expect insurance premiums to compound above CPI over the hold.
Questions for the listing agent
- It's been on market 137 days. Have you received any prior offers? Is the seller open to a 12% concession, seller financing, or rate buy-down credit?
- Can we see the unit-by-unit rent roll, current vacancy, and any below-market leases? What's the average tenancy length?
- What capital expenditures (roof, boiler, parking lot, exteriors) have been made in the last 5 years, and what's planned in the next 2?
- Have any recent inspections been done? Can we get a copy of the seller's disclosures and any deferred-maintenance estimates?
- Why hasn't it sold? Are there any deal-killer items the seller is aware of (foundation, flood, title, zoning, code violations)?
- Is there a deadline driving the sale (1031 exchange, divorce, estate, relocation)? That informs how much negotiation room exists.
- Schools are F-rated, which usually means shorter tenancies and higher turnover. Who's the typical renter profile here, and what's been the actual vacancy rate?
- What's the average days-on-market for RENTAL listings here right now (not sales)? A rising rental-DOM trend means longer vacancies and softer asking-rent achievability than the comps imply.
- What's the recent tenant-quality profile in this submarket — average credit score on applications, eviction rate, late-payment / NSF rate, and stable-employment percentage? A property-management company in the area should have these aggregated.
- How much new apartment / multifamily construction is in the pipeline within 1–3 miles? Heavy new supply (>2% of stock underway) typically softens rents 12–24 months out; light construction supports rent growth.
Investment metrics
- 1% rule
- 1.64% ✓
- Cap rate
- 13.51%
- Cash-on-cash
- 25.77%
- DSCR
- 2.15
- GRM
- 5.1
CMA / ARV
No comps found within radius.
Projected returns pro-forma
10.0% appreciation · 3.0% rent growth · sell at horizon
- IRR
- 43.7%
- Equity multiple
- 4.31×
- Total profit
- $249,609
- Equity at exit
- $242,337
- IRR
- 37.8%
- Equity multiple
- 9.69×
- Total profit
- $654,161
- Equity at exit
- $522,608
Cash invested: $75,320 (down + closing). Projections, not guarantees.
Landlord ↔ Tenant lean methodology
- Overall (STATE)
- 87 Strongly Landlord-Friendly
- State Texas
- 87 Strongly Landlord-Friendly · R+5
- County
- — inherits STATE
- City
- — inherits STATE
ZIP-level market 75426
- Home prices YoY
- 11.5%
- Active inventory
- 87
- Price-to-rent
- 20.4×
Monthly cashflow live
- Estimated rent
- $4,401 medium interval (Pro) →
- Mortgage (P&I)
- −$1,411
- Tax est. 1.5%
- −$336 /mo · $4,035/yr
- Insurance
- −$112
- HOA
- −$0
- Vacancy / Maint / Mgmt
- −$924
- Net cashflow
- $1,618
Break-even live
4-unit breakdown (identical units grouped — click to expand)
| Units | Beds | Baths | Est. rent |
|---|---|---|---|
| 4× units | 2 | 1 | $4,400 |
| #1 | 2 | 1 | $1,100 |
| #2 | 2 | 1 | $1,100 |
| #3 | 2 | 1 | $1,100 |
| #4 | 2 | 1 | $1,100 |
| Total (4 units) | $4,401 | ||
UW: 25.0% down · 7.5% · 30yr · 1.5% tax · 5.0% vac · 8.0% maint · 8.0% mgmt
Financing live
Cash to close
- Down payment
- $67,250
- Closing costs
- $8,070
- Reserves months
- —
- Total cash needed
- —
Loan-product check · same deal, 3 products live
Conventional
25% down · 7.5% · 30yr
- Down + closing
- —
- Monthly P&I
- —
- Monthly cashflow
- —
- DSCR
- —
- Eligible?
- —
Personal DTI + credit; lowest rate.
DSCR
20% down · 8.5% · 30yr
- Down + closing
- —
- Monthly P&I
- —
- Monthly cashflow
- —
- DSCR
- —
- Eligible?
- —
No personal income docs; deal must DSCR.
Hard money
10% down · 12.0% · 12mo
- Down + closing
- —
- Monthly P&I
- —
- Monthly cashflow
- —
- DSCR
- —
- Eligible?
- —
Short-term bridge; refi at stabilization.
Listing history 17 events
-
2026-06-19days on market $269,000 Active 137 DOM
-
2026-06-18days on market $269,000 Active 136 DOM
-
2026-06-17days on market $269,000 Active 135 DOM
-
2026-06-16days on market $269,000 Active 134 DOM
-
2026-06-15days on market $269,000 Active 133 DOM
-
2026-06-14days on market $269,000 Active 131 DOM
-
2026-06-12days on market $269,000 Active 130 DOM
-
2026-06-09days on market $269,000 Active 127 DOM
-
2026-06-08days on market $269,000 Active 126 DOM
-
2026-06-07days on market $269,000 Active 125 DOM
-
2026-06-07days on market $269,000 Active 124 DOM
-
2026-06-03days on market $269,000 Active 121 DOM
-
2026-06-02days on market $269,000 Active 120 DOM
-
2026-06-01days on market $269,000 Active 119 DOM
-
2026-05-31days on market $269,000 Active 118 DOM
-
2026-05-30days on market $269,000 Active 117 DOM
-
2026-02-02$269,000 Active 373-char remark
Show marketing remark (373 chars)
Check out this 4-Plex. Perfect starter for a portfolio or an addition for a seasoned investor. Property is located at 104 W South St in Clarksville, TX, presents a value add opportunity. Rents are in high demand, income producing with immediate opportunity for value add. Tenants pay electricity and owner pays water. Call today, Seller will look at all reasonable offers.
ⓘ Source: listings_history table (triggers on properties + properties_extension) + one-shot
backfill from property_details.listing_events for pre-trigger history.
Climate risk First Street
- Flood 1/10 Low FEMA zone X · 0% chance over 30 yrs
- Wildfire 6/10 Major
- Heat 7/10 Severe 7 d/yr ≥110°F today · 22 d/yr by 30 yrs out
- Wind 4/10 Moderate 18% chance of damaging wind over 30 yrs
- Air quality 2/10 Low 0 unhealthy d/yr today · 1 by 30 yrs out
Nearby sold comps map
Loading sold comps map…
Walkable amenities ~0.75 mi
Loading nearby amenities…
Taxation est. · year 1
- Rental income
- $52,812
- − Mortgage interest
- −$15,068
- − Property taxes
- −$4,035
- − Insurance
- −$1,345
- − Repairs & maintenance
- −$4,225
- − Management
- −$4,225
- − Depreciation
- −$7,825
- Taxable income
- $16,088
- Est. tax owed @ 24.0%
- −$3,861
- After-tax cash flow
- $15,552/yr
For passive investors: Depreciation is non-cash, so a rental often shows a tax loss while cash-flowing — sheltering income. Rental losses are passive: they offset passive income freely, and up to $25,000/yr can offset ordinary (W-2) income if you actively participate and your MAGI is under $100k (phasing out to $0 by $150k); unused losses carry forward. On sale, claimed depreciation is recaptured at up to 25%, and gains may owe capital-gains tax (a 1031 exchange can defer both). Figures are a year-1 estimate at your 24.0% rate — not tax advice; consult a CPA.
Condition & rehab AI · 2 photos
This 4-plex property requires extensive repairs, particularly to the roof and driveway, and has significant deferred maintenance. Immediate value can be added through landscaping and basic repairs, but a comprehensive renovation is needed for long-term sustainability and increased value.
Repairs flagged
- Major roof — Signs of significant damage
- Major driveway — Severe cracking and deterioration
Value-add opportunities
- Both Landscaping and driveway repair — Improves curb appeal and functionality
- Both Roof replacement — Essential for structural integrity and safety
Renovation cost estimate screening
| Repair item | Severity | Est. cost |
|---|---|---|
| roof · Signs of significant damage | Major | $15,000–50,000 |
| driveway · Severe cracking and deterioration | Major | $15,000–50,000 |
| Total estimated repair cost · 2 items | $30,000–100,000 |
Value-add ROI direction
- Both Landscaping and driveway repair — Improves curb appeal and functionality ↑
- Both Roof replacement — Essential for structural integrity and safety ↑
ⓘ Cost ranges are severity-bucket heuristics (US national rule-of-thumb). Get contractor quotes + a written scope before underwriting a rehab budget.
Schools (NCES district)
- District
- Clarksville ISD
- NCES district ID
- 4814190
- Math proficiency
- 20% ▼ -12.00%
- Reading proficiency
- 27% ▼ -2.00%
- Median HH income
- $31,795
- Composite
- 19.05/100
- National rank
- #8842
- State rank
- #752 of 826 in TX
Livability — Clarksville
- Score
- 67/100
- State rank
- #523
- US rank
- #10265
Category grades
Schools grade is shown separately in the Schools card above.
Census & demographics
- Census place
- Clarksville, TX
- Population (ZIP)
- 4,199
Population outlook (Red River County) Hauer SSP2
- Today (2025)
- 11,454 people
- By 2030
- 10,874 · -5.1%
- By 2040
- 9,715 · -15.2%
- By 2050
- 8,552 · -25.3%
- By 2075
- 6,042 · -47.2%
- By 2100
- 4,037 · -64.8%
Race, ethnicity, and origin ACS 2023
- Neighborhood character
- Diverse neighborhood (Simpson 0.56)
- Race & ethnicity
- White 52% Black 40% Hispanic / Latino 5% Two or more races 3%
- Hispanic origin (detail)
- Mexican 3%
- Common ancestry
- Slovak 1%
- Foreign-born
- 2% · Canada, China
- Languages at home
- 96% English-only · Spanish 3% Chinese 1%
Political lean MEDSL · Red River
- 2024 margin
- Solid R (+61.8) · D 19.0% · R 80.8%
- 2008→2024 swing
- -23.7pp toward R · 2008: -38.0pp · 2024: -61.8pp
- All cycles
- 2024: R+61.8 2020: R+56.3 2016: R+53.9 2012: R+40.7 2008: R+38.0
Not yet ingested
- Civics
- —
Market trends
- HPI YoY
- ▲ 17.13%
- Current HPI
- 166.5937
- Rent YoY
- —
- Metro
- —
- State GDP YoY
- ▲ 3.95%
- F500 in state
- 110
Industry mix (Fortune 500 HQ in TX)
| Industry | F500 HQs | Revenue |
|---|---|---|
| Energy | 16 | $1,198B |
|
||
| Technology | 5 | $198B |
|
||
| Engineering / Construction | 4 | $72B |
|
||
| Energy Services | 3 | $60B |
|
||
| Utilities | 3 | $41B |
|
||
| Healthcare | 2 | $330B |
|
||
Price history
1 event — show timeline
- 2026-02-02 Listed $269,000 NTREIS
Cash-flow waterfall
monthlySold comps — $/sqft
last 12 mo · ≤1 miLoading sold comps…