7111 142nd Ave N Lot 101 · Largo, FL
Flood risk 3/10 · Minor
- FEMA flood zone
- X (unshaded)
- Chance of flooding over 30 yrs
- 0.1%
- Est. flood insurance / yr
- $507 – $1,088
Fire risk 1/10 · Minimal
- Est. fire insurance / yr
- $947 – $1,759
Heat risk 10/10 · Severe
- Hot days now (above 107°F)
- 6 days/yr
- Hot days in 30 yrs
- 22 days/yr
Wind risk 10/10 · Severe
- Chance of severe wind over 30 yrs
- 99.0%
Air-quality risk 3/10 · Minor
- Unhealthy air days now
- 3 days/yr
- Unhealthy air days in 30 yrs
- 3 days/yr
Risk factors via First Street. Map © Google.
Why this score? — see what drove the C grade
The composite is a weighted blend of 9 inputs, each scored 0–100. Each bar is that input's sub-score; the figure is the points it added to the 100-point composite (weight × sub-score).
- Cash flow +19.5/30.0
- 1% rule +10.0/10.0
- ARV discount +7.5/15.0
- DSCR +6.2/10.0
- Schools +4.3/10.0
- Livability +4.1/5.0
- Condition / age +4.0/5.0
- Rent growth +2.2/5.0
- Appreciation +0.0/10.0
$50,000
🖨 Deal sheet 📄 Offer letter ✓ Due diligence
Listing remarks
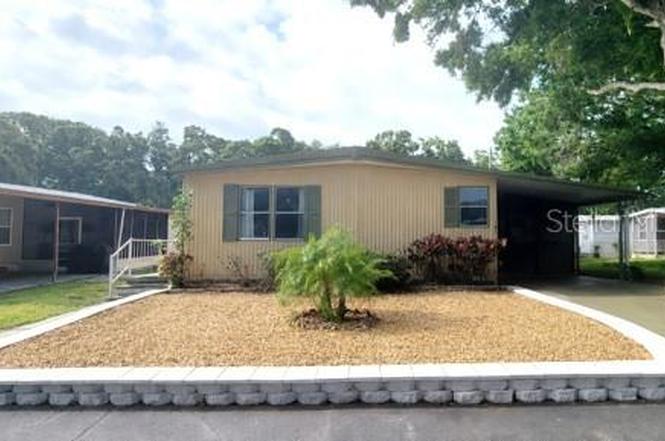
Welcome to this well-maintained 1982 manufactured home offering approximately 960 square feet of living space (24 x 40) in the heart of Pinellas County, Florida. This charming 2-bedroom, 2-bathroom double-wide features a spacious great room, an attached screened porch, covered carport suitable for a golf cart, and a convenient storage shed, providing comfortable Florida living both indoors and out. Numerous updates have been completed within the past two years, including new laminate flooring throughout, remodeled showers in both bathrooms, a new central HVAC system, new vapor barrier, new AC ductwork, and a new electrical panel, offering added peace of mind for the next owner. Located with
Key facts
- Remodeled showers
- Covered carport
- New vapor barrier
Tags
Property features AI
Finance
- Other: Directions and community location available; Furnished: negotiable
- Financial info: Total monthly fees: $1,035; Total annual fees: $12,420; Lease restrictions apply
- HOA & community: Community pool; Clubhouse; Shuffleboard court; Community mailbox; Golf carts allowed; Senior community; Pets allowed (cats and dogs, max ~30 lbs); On-site property manager; Association approval required; Association fees include maintenance of grounds, sewer, trash and water
Exterior
- Parking: Driveway; Golf cart parking; 1-space carport
- Utilities: Public water; Public sewer; Cable available; Phone available
- Home design: Manufactured home (double wide); One level; Faces north; Entry on one level
- Construction: Metal siding; Metal roof; Crawlspace with pillar/post/pier foundation; Make: BROO; Double wide body type
- Exterior features: Enclosed porch / Florida room; Porch; Rain gutters; Shed(s); Mature landscaping; Corner lot; Paved lot; Asphalt road
Interior
- Kitchen: Dishwasher; Range; Microwave; Refrigerator; Electric water heater
- Bedrooms: 2 bedrooms
- Bathrooms: 2 full bathrooms
- Heating & cooling: Electric heating; Central air conditioning
- Interior features: Ceiling fans; Living room / dining room combo; Open floorplan; Thermostat; Walk-in closet(s); Aluminum-framed windows; Smoke detector(s)
- Laundry & utility: Washer hookup; Dryer hookup; Inside laundry / laundry room
Neighborhood map
What this means for you Summary
Snapshot
- This is a 2-bed/2.0-bath manufactured listed at $50k. Condition is rated good.
Deal economics
- At list price, monthly cash flow is $57 ($685/yr) — positive.
- The deal already cash-flows at list — no discount required.
- Meets the 1% rule at list price ($2k rent vs $50k).
- Cap rate 7.7% vs local median 4.2% in Largo — top-decile yield for the area; either an underpriced asset or a hidden risk that comps aren't pricing in. Stress-test before assuming the spread holds.
Location & tenants
- Location reads 82/100 on livability (#82 in FL, #1,240 nationally) — a professional / high-income tenant draw. Strengths: commute A+, cost of living A+, housing A+; Watch: employment D+, amenities F.
- Pinellas (suburban): math 51% / reading 51% proficiency, ranked #31 of 73 in FL (top 42%) — acceptable for families but not a draw, mixed tenant base, ~2y average lease.
- Market conditions: Rents soft (-1.1%/yr); 220 active listings in the ZIP; 40 comparable units currently listed for rent nearby; rentals at typical pace (median 15d on market — plan ~3-4 weeks tenant-placement turnaround); 2,676 units permitted in Pinellas County in 2024 (1,422 in 5+ unit buildings).
- This rent runs 36% of the median local income ($60k/yr) — at the standard rent-burdened threshold; future hikes will face affordability resistance.
Forward outlook
- Local home prices are declining (-3.0%/yr); year-one equity from $346 of loan paydown is wiped out by about $2k of value loss. Plan a longer hold.
- Pinellas County population projected at +14% by 2050 — modest demand growth; plan on rents tracking national, not racing it.
Negotiation context
- Only 1 days on market — expect competitive offers; lowballing is unlikely to land.
Risks & watch-outs
- Watch-outs: HOA is 57% of rent.
- Climate carrying-cost: severe wind risk, 99% chance of damaging wind over 30y; extreme-heat days projected 6→22/yr by 2055 (HVAC capex compounding) — expect insurance premiums to compound above CPI over the hold.
Questions for the listing agent
- What does the HOA fee cover, when was the last increase, and are there any pending special assessments or reserve-fund shortfalls?
- Is there a deadline driving the sale (1031 exchange, divorce, estate, relocation)? That informs how much negotiation room exists.
- What's the average days-on-market for RENTAL listings here right now (not sales)? A rising rental-DOM trend means longer vacancies and softer asking-rent achievability than the comps imply.
- What's the recent tenant-quality profile in this submarket — average credit score on applications, eviction rate, late-payment / NSF rate, and stable-employment percentage? A property-management company in the area should have these aggregated.
- How much new for-sale + rental construction is in the pipeline within 1–3 miles? Heavy new supply typically softens prices + rents 12–24 months out; constrained supply supports both.
Investment metrics
- 1% rule
- 3.64% ✓
- Cap rate
- 7.66%
- Cash-on-cash
- 4.89%
- DSCR
- 1.22
- GRM
- 2.3
CMA / ARV
- ARV (on-the-fly)
- $135,360
- Comps found
- 11
Show comp detail 11 sales within ~0.75 mi
| Address | Dist | Beds/Ba | Sqft | Sold | Price | $/sf | Match |
|---|---|---|---|---|---|---|---|
| 1100 Belcher Rd S #371 | 0.75mi | 2/2.0 | 960 (0%) | 2mo | $130,000 | $135 | 64 |
| 1100 Belcher Rd S #120 | 0.75mi | 2/2.0 | 960 (0%) | 14mo | $185,000 | $193 | 53 |
| 1100 Belcher Rd S #8 | 0.75mi | 2/2.0 | 893 (-7%) | 2mo | $95,000 | $106 | 52 |
| 1100 Belcher Rd S #403 | 0.75mi | 2/2.0 | 1,008 (+5%) | 8mo | $240,000 | $238 | 50 |
| 1100 Belcher Rd S #121 | 0.75mi | 2/2.0 | 1,008 (+5%) | 9mo | $190,000 | $188 | 49 |
| 1100 Belcher Rd S #23 | 0.75mi | 2/1.5 | 1,036 (+8%) | 3mo | $109,900 | $106 | 47 |
| 1100 Belcher Rd S #720 | 0.75mi | 2/2.0 | 864 (-10%) | 3mo | $130,000 | $150 | 46 |
| 1100 Belcher Rd S #115 | 0.75mi | 2/2.0 | 880 (-8%) | 10mo | $82,000 | $93 | 43 |
| 1100 Belcher Rd S #559 | 0.75mi | 2/2.0 | 1,032 (+8%) | 14mo | $145,000 | $141 | 41 |
| 1100 Belcher Rd S #537 | 0.75mi | 2/2.0 | 1,044 (+9%) | 12mo | $185,000 | $177 | 41 |
| 1100 Belcher Rd S #605 | 0.75mi | 2/2.0 | 1,104 (+15%) | 3mo | $110,000 | $100 | 38 |
Match score weights: distance 35% · size 25% · config 20% · recency 20%. Top-matched comps best support the ARV.
Projected returns pro-forma
-3.0% appreciation · 0.0% rent growth · sell at horizon
- IRR
- -20.9%
- Equity multiple
- 0.35×
- Total profit
- $-9,135
- Equity at exit
- $7,455
- IRR
- —
- Equity multiple
- -0.51×
- Total profit
- $-21,186
- Equity at exit
- $4,323
Cash invested: $14,000 (down + closing). Projections, not guarantees.
Landlord ↔ Tenant lean methodology
- Overall (STATE)
- 87 Strongly Landlord-Friendly
- State Florida
- 87 Strongly Landlord-Friendly · R+3
- County
- — inherits STATE
- City
- — inherits STATE
ZIP-level market 33771
- Home prices YoY
- -30.2%
- Rents YoY
- -1.1%
- Active inventory
- 220
- Price-to-rent
- 2.3×
Monthly cashflow live
- Estimated rent
- $1,820 high interval (Pro) →
- Mortgage (P&I)
- −$262
- Tax est. 1.5%
- −$62 /mo · $750/yr
- Insurance
- −$21
- HOA
- −$1,035
- Vacancy / Maint / Mgmt
- −$382
- Net cashflow
- $57
Break-even live
UW: 25.0% down · 7.5% · 30yr · 1.5% tax · 5.0% vac · 8.0% maint · 8.0% mgmt
Financing live
Cash to close
- Down payment
- $12,500
- Closing costs
- $1,500
- Reserves months
- —
- Total cash needed
- —
Loan-product check · same deal, 3 products live
Conventional
25% down · 7.5% · 30yr
- Down + closing
- —
- Monthly P&I
- —
- Monthly cashflow
- —
- DSCR
- —
- Eligible?
- —
Personal DTI + credit; lowest rate.
DSCR
20% down · 8.5% · 30yr
- Down + closing
- —
- Monthly P&I
- —
- Monthly cashflow
- —
- DSCR
- —
- Eligible?
- —
No personal income docs; deal must DSCR.
Hard money
10% down · 12.0% · 12mo
- Down + closing
- —
- Monthly P&I
- —
- Monthly cashflow
- —
- DSCR
- —
- Eligible?
- —
Short-term bridge; refi at stabilization.
Rent comps 40 comps
| Address | Beds | Baths | Sqft | Rent | $/sqft | DOM | Units | Dist |
|---|---|---|---|---|---|---|---|---|
| 7001 142nd Ave N Lot 179 Largo, FL | 2.0 | 2.0 | 1100 | $2,495 | $2.27 | 16d | 1 | 0.16mi |
| 7001 142nd Ave N #157 Largo, FL | 2.0 | 1.0 | 800 | $1,795 | $2.24 | 17d | 1 | 0.20mi |
| 7001 142nd Ave Largo, FL | 2.0 | 2.0 | 1100 | $1,700 | $1.55 | 24d | 1 | 0.20mi |
| 305 Glades Cir Largo, FL | 1.0–3.0 | 1.0–1.5 | 875 | $1,563 | $1.79 | 1d | 34 | 0.49mi |
| 13500 Rodgers Ave Largo, FL | 1.0 | 1.0 | 700 | $1,474 | $2.11 | 1d | 5 | 0.55mi |
| 3736 141st Pl Largo, FL | 2.0 | 1.0 | 805 | $1,650 | $2.05 | 24d | 1 | 0.66mi |
| 3767 138th Ave N Unit B Largo, FL | 2.0 | 1.0 | 780 | $1,495 | $1.92 | 2d | 1 | 0.71mi |
| 7298 Ulmerton Rd Largo, FL | 1.0–2.0 | 1.0–2.0 | 755 | $1,750 | $2.32 | 1d | 4 | 0.74mi |
| 7298 Ulmerton Rd Largo, FL | 1.0–2.0 | 1.0–2.0 | 755 | $1,750 | $2.32 | 3d | 3 | 0.74mi |
| 7298 Ulmerton Rd Largo, FL | 1.0–3.0 | 1.0–2.0 | 977 | $1,750 | $1.79 | 17d | 4 | 0.74mi |
| 3718 138th Ave N Unit 2 Largo, FL | 2.0 | 1.0 | 750 | $1,500 | $2.00 | 24d | 1 | 0.75mi |
| 1601 Palm Way Largo, FL | 3.0 | 1.0 | 1084 | $1,950 | $1.80 | 24d | 1 | 0.78mi |
| 19137 US Highway 19 N Unit 2 Clearwater, FL | 2.0 | 2.0 | 1062 | $1,738 | $1.64 | 24d | 1 | 0.80mi |
| 6430 142nd Ave N Clearwater, FL | 1.0–3.0 | 1.0–2.0 | 1216 | $2,860 | $2.35 | 1d | 68 | 0.80mi |
| 7360 Ulmerton Rd Unit 3C Largo, FL | 1.0 | 1.0 | 846 | $1,498 | $1.77 | 7d | 1 | 0.82mi |
| 7360 Ulmerton Rd Unit 3C Largo, FL | 1.0 | 1.0 | 846 | $1,599 | $1.89 | 24d | 1 | 0.82mi |
| 4215 E Bay Dr Clearwater, FL | 1.0 | 1.0 | 575 | $1,775 | $3.09 | 17d | 3 | 0.82mi |
| 4215 E Bay Dr Clearwater, FL | 1.0 | 1.0 | 535 | $2,300 | $4.30 | 7d | 4 | 0.82mi |
| 14603 64th St N Clearwater, FL | 3.0 | 2.0 | 1080 | $1,900 | $1.76 | 4d | 1 | 0.85mi |
| 3331 Whispering Dr N Largo, FL | 2.0 | 2.0 | 1053 | $2,190 | $2.08 | 23d | 1 | 0.90mi |
| 500 Belcher Rd S #18 Largo, FL | 1.0 | 1.0 | 637 | $1,500 | $2.35 | 3d | 1 | 0.92mi |
| 779 34th St SE Unit 1319966P Largo, FL | 2.0 | 1.0 | 990 | $2,941 | $2.97 | 7d | 1 | 0.96mi |
| 6262 142nd Ave N Clearwater, FL | 2.0 | 1.5–2.0 | 1183 | $1,725 | $1.46 | 24d | 2 | 1.01mi |
| 4500 E Bay Dr #149 Clearwater, FL | 2.0 | 2.0 | 1050 | $1,850 | $1.76 | 24d | 1 | 1.03mi |
| 4500 E Bay Dr #138 Clearwater, FL | 2.0 | 2.0 | 1050 | $1,350 | $1.29 | 24d | 1 | 1.03mi |
| 12700 66th St Largo, FL | 1.0–3.0 | 1.0–2.0 | 1105 | $2,191 | $1.98 | 1d | 20 | 1.11mi |
| 2871 S Pines Dr #24 Largo, FL | 2.0 | 1.5 | 1048 | $1,800 | $1.72 | 24d | 1 | 1.20mi |
| 3135 Pine Tree Ave Largo, FL | 2.0 | 1.0 | 923 | $1,395 | $1.51 | 10d | 1 | 1.21mi |
| 3135 Pine Tree Ave Unit A Largo, FL | 2.0 | 1.0 | 923 | $1,395 | $1.51 | 21d | 1 | 1.21mi |
| 3073 Pine Tree Ave Largo, FL | 2.0 | 1.0 | 825 | $1,350 | $1.64 | 24d | 1 | 1.24mi |
| 636 Lake Palms Dr Unit Stylish Largo, FL | 2.0 | 2.0 | 870 | $2,000 | $2.30 | 4d | 1 | 1.28mi |
| 636 Lake Palms Dr Unit Stylish Largo, FL | 3.0 | 2.0 | 1000 | $2,200 | $2.20 | 24d | 1 | 1.28mi |
| 3377 Sherwood Dr Unit A Largo, FL | 2.0 | 1.0 | 1064 | $1,650 | $1.55 | 7d | 1 | 1.33mi |
| 3022 Meadow Lake Ave Largo, FL | 2.0 | 1.0 | 900 | $1,450 | $1.61 | 10d | 1 | 1.34mi |
| 3022 Meadow Lake Ave Largo, FL | 2.0 | 1.0 | 900 | $1,450 | $1.61 | 4d | 1 | 1.34mi |
| 301 Seacrest Dr Largo, FL | 1.0–2.0 | 1.0–1.5 | 975 | $1,625 | $1.67 | 21d | 1 | 1.38mi |
| 14330 58th St N Clearwater, FL | 1.0–3.0 | 1.0–2.0 | 1161 | $2,212 | $1.90 | 2d | 19 | 1.42mi |
| 199 Fulton St NE Unit 4 Largo, FL | 2.0 | 1.0 | 760 | $1,600 | $2.11 | 14d | 1 | 1.44mi |
| 2770 Roosevelt Blvd Clearwater, FL | 1.0–2.0 | 1.0 | 795 | $1,636 | $2.06 | 14d | 10 | 1.44mi |
| 16485 US Highway 19 N Clearwater, FL | 3.0 | 1.0–2.0 | 984 | $2,877 | $2.92 | 1d | 249 | 1.45mi |
HOA detail
- Monthly dues
- $1,035 · $12,420/yr
- Likely covers
- electric
Listing history 2 events
-
2026-06-19remarks 699-char remark
-
2026-06-19$50,000 Active 1 DOM
ⓘ Source: listings_history table (triggers on properties + properties_extension) + one-shot
backfill from property_details.listing_events for pre-trigger history.
Climate risk First Street
- Flood 3/10 Moderate FEMA zone X (unshaded) · 10% chance over 30 yrs
- Wildfire 1/10 Low
- Heat 10/10 Extreme 6 d/yr ≥107°F today · 22 d/yr by 30 yrs out
- Wind 10/10 Extreme 99% chance of damaging wind over 30 yrs
- Air quality 3/10 Moderate 3 unhealthy d/yr today · 3 by 30 yrs out
Nearby sold comps map
Loading sold comps map…
Walkable amenities ~0.75 mi
Loading nearby amenities…
Taxation est. · year 1
- Rental income
- $21,838
- − Mortgage interest
- −$2,801
- − Property taxes
- −$750
- − Insurance
- −$250
- − Repairs & maintenance
- −$1,747
- − Management
- −$1,747
- − HOA
- −$12,420
- − Depreciation
- −$1,455
- Taxable income
- $668
- Est. tax owed @ 24.0%
- −$160
- After-tax cash flow
- $525/yr
For passive investors: Depreciation is non-cash, so a rental often shows a tax loss while cash-flowing — sheltering income. Rental losses are passive: they offset passive income freely, and up to $25,000/yr can offset ordinary (W-2) income if you actively participate and your MAGI is under $100k (phasing out to $0 by $150k); unused losses carry forward. On sale, claimed depreciation is recaptured at up to 25%, and gains may owe capital-gains tax (a 1031 exchange can defer both). Figures are a year-1 estimate at your 24.0% rate — not tax advice; consult a CPA.
Condition & rehab AI · 12 photos
This well-maintained 1982 manufactured home offers a good condition with recent updates, making it a solid investment opportunity.
Value-add opportunities
- Both Paint exterior siding — Enhances curb appeal and value
- Both Replace old window screens — Improves energy efficiency and aesthetics
- Both Install smart home devices — Enhances home automation and energy savings
Renovation cost estimate screening
Value-add ROI direction
- Both Paint exterior siding — Enhances curb appeal and value ↑
- Both Replace old window screens — Improves energy efficiency and aesthetics ↑
- Both Install smart home devices — Enhances home automation and energy savings ↑
ⓘ Cost ranges are severity-bucket heuristics (US national rule-of-thumb). Get contractor quotes + a written scope before underwriting a rehab budget.
Schools (NCES district)
- District
- Pinellas
- NCES district ID
- 1201560
- Math proficiency
- 51% ▼ -5.00%
- Reading proficiency
- 51% ▼ -3.00%
- Median HH income
- $46,270
- Composite
- 43.27/100
- National rank
- #3046
- State rank
- #31 of 73 in FL
Livability — Largo
- Score
- 82/100
- State rank
- #82
- US rank
- #1240
Category grades
Schools grade is shown separately in the Schools card above.
Census & demographics
- Census place
- Largo, FL
- County
- Pinellas County · 939,478 people
- City population
- 106,311
- Metro
- Tampa-St. Petersburg-Clearwater, FL
- Population (ZIP)
- 27,596
- Household income
- $59,993
- Rent vs Own
- Severe rent burden
- 1243.0
Population outlook (Pinellas County) Hauer SSP2
- Today (2025)
- 1,027,532 people
- By 2030
- 1,063,586 · +3.5%
- By 2040
- 1,125,020 · +9.5%
- By 2050
- 1,168,637 · +13.7%
- By 2075
- 1,265,188 · +23.1%
- By 2100
- 1,260,357 · +22.7%
Race, ethnicity, and origin ACS 2023
- Neighborhood character
- Predominantly White (74%)
- Race & ethnicity
- White 74% Hispanic / Latino 14% Two or more races 9% Black 4% Asian 3%
- Hispanic origin (detail)
- Mexican 3% Puerto Rican 6% Dominican 2%
- Common ancestry
- Romanian 4% Lithuanian 3% Slovak 2%
- Foreign-born
- 13% · Canada, Jamaica, Guatemala
- Languages at home
- 82% English-only · Spanish 12% Other Indo-European 2% Russian/Polish/Slavic 2%
Political lean MEDSL · Pinellas
- 2024 margin
- Lean R (+5.2) · D 46.9% · R 52.1%
- 2008→2024 swing
- -13.5pp toward R · 2008: 8.3pp · 2024: -5.2pp
- All cycles
- 2024: R+5.2 2020: D+0.2 2016: R+1.1 2012: D+5.6 2008: D+8.3
Not yet ingested
- Civics
- —
Market trends
- HPI YoY
- ▼ -135.36%
- Current HPI
- 313.5044
- Rent YoY
- ▼ -1.06%
- Metro
- Tampa-St. Petersburg-Clearwater, FL
- State GDP YoY
- ▲ 3.28%
- F500 in state
- 36
Industry mix (Fortune 500 HQ in FL)
| Industry | F500 HQs | Revenue |
|---|---|---|
| Industrial Technology | 2 | $29B |
|
||
| Insurance | 2 | $17B |
|
||
| Retail | 1 | $60B |
|
||
| Technology Distribution | 1 | $58B |
|
||
| Homebuilding | 1 | $35B |
|
||
| Technology Manufacturing | 1 | $35B |
|
||
Price history
1 event — show timeline
- 2026-06-18 Listed $50,000 Stellar MLS as Distributed by MLS Grid
Cash-flow waterfall
monthlySold comps — $/sqft
last 12 mo · ≤1 miLoading sold comps…