 🏷️ Likely Rental
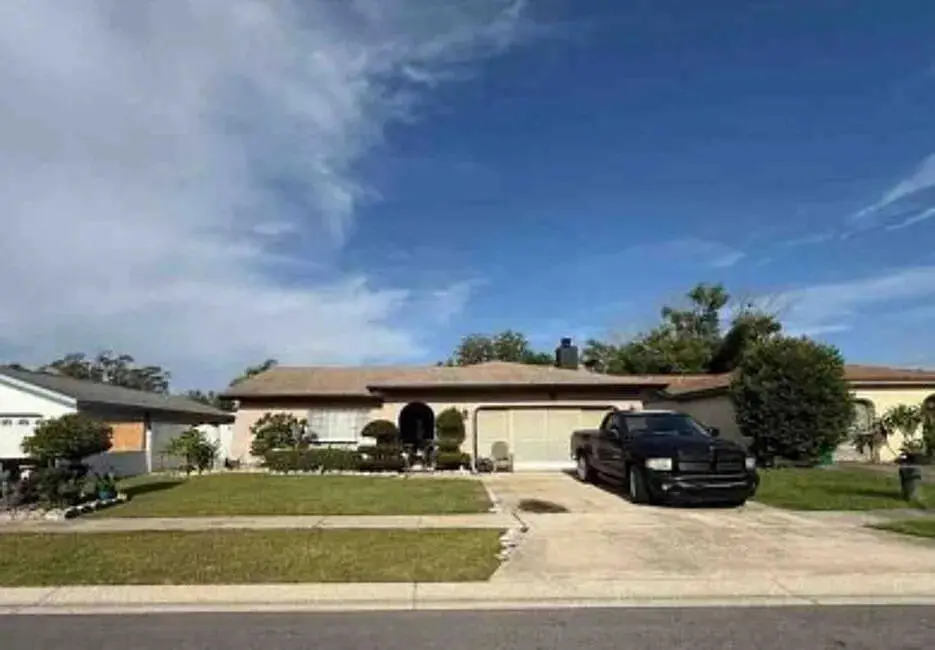
1644 E Grovehill Rd · Palm Harbor, FL
Flood risk 1/10 · Minimal
- FEMA flood zone
- X (unshaded)
- Chance of flooding over 30 yrs
- 0.0%
- Est. flood insurance / yr
- $507 – $1,088
Fire risk 1/10 · Minimal
- Est. fire insurance / yr
- $947 – $1,759
Heat risk 10/10 · Severe
- Hot days now (above 108°F)
- 7 days/yr
- Hot days in 30 yrs
- 27 days/yr
Wind risk 10/10 · Severe
- Chance of severe wind over 30 yrs
- 99.0%
Air-quality risk 3/10 · Minor
- Unhealthy air days now
- 2 days/yr
- Unhealthy air days in 30 yrs
- 2 days/yr
Risk factors via First Street. Map © Google.
Why this score? — see what drove the D grade
The composite is a weighted blend of 9 inputs, each scored 0–100. Each bar is that input's sub-score; the figure is the points it added to the 100-point composite (weight × sub-score).
- Cash flow +15.0/30.0
- ARV discount +7.5/15.0
- 1% rule +5.0/10.0
- DSCR +5.0/10.0
- Schools +4.3/10.0
- Livability +4.0/5.0
- Condition / age +2.5/5.0
- Rent growth +1.4/5.0
- Appreciation +0.0/10.0
$5,000
🖨 Deal sheet 📄 Offer letter ✓ Due diligence
Listing remarks MLS
0
Key facts
- 6,098 sq ft lot
- Built 1980
- Listed 12 days
Property features AI
Finance
- Other: Deed restrictions: None; Pets: See remarks; Rentals: Not allowed; Zoning: Other
- Financial info: Property listed at auction
- HOA & community: No association fee; Association fee covers other items
Exterior
- Utilities: Utilities: Other (see remarks)
- Home design: Other property type; Built in 1980; Above flood: No
- Construction: Other construction
- Exterior features: No waterfront; No waterview; Less than 1/4 acre lot
Interior
- Bedrooms: Bedroom 1; Bedroom 2; Bedroom 3
- Bathrooms: 2 full bathrooms
- Interior features: Other appliances (see remarks)
Neighborhood map
What this means for you Summary
Snapshot
- This is a 3-bed/2.0-bath single-family listed at $5k.
Deal economics
- At list price, monthly cash flow is $2k ($22k/yr) — positive.
- The deal already cash-flows at list — no discount required.
- Meets the 1% rule at list price ($2k rent vs $5k).
- Cap rate 447.2% vs local median 3.1% in Palm Harbor — top-decile yield for the area; either an underpriced asset or a hidden risk that comps aren't pricing in. Stress-test before assuming the spread holds.
Location & tenants
- Location reads 81/100 on livability (#95 in FL, #1,470 nationally) — a professional / high-income tenant draw. Strengths: schools A+, housing A+, commute A; Watch: amenities F.
- Pinellas (suburban): math 51% / reading 51% proficiency, ranked #31 of 73 in FL (top 42%) — acceptable for families but not a draw, mixed tenant base, ~2y average lease.
- Market conditions: Rents falling (-4.3%/yr); 387 active listings in the ZIP; 40 comparable units currently listed for rent nearby; rentals at typical pace (median 15d on market — plan ~3-4 weeks tenant-placement turnaround); solid renter incomes; 2,676 units permitted in Pinellas County in 2024 (1,422 in 5+ unit buildings).
- This rent runs 31% of the median local income ($93k/yr) — at the standard rent-burdened threshold; future hikes will face affordability resistance.
Forward outlook
- Local home prices are declining (-3.0%/yr); year-one equity from $35 of loan paydown is wiped out by about $150 of value loss. Plan a longer hold.
- Pinellas County population projected at +14% by 2050 — modest demand growth; plan on rents tracking national, not racing it.
- At projected returns (-3.0% appreciation + 0.0% rent growth), your $1k cash investment doubles in ~1 year — after that, you're playing with house money.
Negotiation context
- Only 12 days on market — expect competitive offers; lowballing is unlikely to land.
- 3 sale attempts since 19y ago with the ask held roughly flat each time — persistent listings suggest the price (not the market) is what's stuck; bring a comps-based counter.
Risks & watch-outs
- Climate carrying-cost: severe wind risk, 99% chance of damaging wind over 30y; extreme-heat days projected 7→27/yr by 2055 (HVAC capex compounding) — expect insurance premiums to compound above CPI over the hold.
Questions for the listing agent
- Is there a deadline driving the sale (1031 exchange, divorce, estate, relocation)? That informs how much negotiation room exists.
- Schools are A-rated — typically a magnet for longer-tenancy family renters. What's the average tenant stay here, and is there a school-zone premium baked into asking?
- The area grade is low — what's the realistic commute time and amenity access for the typical tenant pool here? Any planned neighborhood developments (good or bad) we should know about?
- What's the average days-on-market for RENTAL listings here right now (not sales)? A rising rental-DOM trend means longer vacancies and softer asking-rent achievability than the comps imply.
- What's the recent tenant-quality profile in this submarket — average credit score on applications, eviction rate, late-payment / NSF rate, and stable-employment percentage? A property-management company in the area should have these aggregated.
- How much new for-sale + rental construction is in the pipeline within 1–3 miles? Heavy new supply typically softens prices + rents 12–24 months out; constrained supply supports both.
Investment metrics
- 1% rule
- 47.39% ✓
- Cap rate
- 447.25%
- Cash-on-cash
- 1574.85%
- DSCR
- 71.07
- GRM
- 0.2
CMA / ARV
- ARV (on-the-fly)
- $391,401
- Comps found
- 12
Show comp detail 12 sales within ~0.75 mi
| Address | Dist | Beds/Ba | Sqft | Sold | Price | $/sf | Match |
|---|---|---|---|---|---|---|---|
| 2102 Grove Valley Ave | 0.26mi | 3/2.0 | 1,413 (0%) | 7mo | $331,000 | $234 | 82 |
| 1790 E Orangeside Rd | 0.16mi | 3/2.0 | 1,501 (+6%) | 4mo | $427,000 | $284 | 79 |
| 2329 E Orangehill Ave | 0.42mi | 3/2.0 | 1,424 (+1%) | 4mo | $385,000 | $270 | 76 |
| 2376 Citrus Hill Rd | 0.44mi | 3/2.0 | 1,379 (-2%) | 5mo | $458,500 | $332 | 71 |
| 2339 Orangeside Rd | 0.43mi | 3/2.0 | 1,356 (-4%) | 4mo | $540,000 | $398 | 70 |
| 1809 Georgia Ave | 0.70mi | 2/2.0 (-1) | 1,427 (+1%) | 4mo | $340,000 | $238 | 57 |
| 128 Stafford Dr | 0.60mi | 2/2.0 (-1) | 1,327 (-6%) | 3mo | $314,000 | $237 | 55 |
| 2397 E Orangehill Ave | 0.48mi | 2/2.0 (-1) | 1,252 (-11%) | 0mo | $373,000 | $298 | 53 |
| 2256 E Orangehill Ave | 0.37mi | 2/2.0 (-1) | 1,256 (-11%) | 8mo | $300,000 | $239 | 53 |
| 2928 Macalpin Dr S | 0.73mi | 2/2.0 (-1) | 1,352 (-4%) | 1mo | $375,000 | $277 | 53 |
| 2457 Orangepointe Ave | 0.54mi | 2/2.0 (-1) | 1,286 (-9%) | 7mo | $347,500 | $270 | 49 |
| 2869 Doone Cir | 0.71mi | 2/1.5 (-1) | 1,284 (-9%) | 1mo | $355,900 | $277 | 44 |
Match score weights: distance 35% · size 25% · config 20% · recency 20%. Top-matched comps best support the ARV.
Projected returns pro-forma
-3.0% appreciation · 0.0% rent growth · sell at horizon
- IRR
- —
- Equity multiple
- 79.07×
- Total profit
- $109,301
- Equity at exit
- $746
- IRR
- —
- Equity multiple
- 157.55×
- Total profit
- $219,169
- Equity at exit
- $432
Cash invested: $1,400 (down + closing). Projections, not guarantees.
Landlord ↔ Tenant lean methodology
- Overall (STATE)
- 87 Strongly Landlord-Friendly
- State Florida
- 87 Strongly Landlord-Friendly · R+3
- County
- — inherits STATE
- City
- — inherits STATE
ZIP-level market 34683
- Rents YoY
- -4.3%
- Active inventory
- 387
- Price-to-rent
- 0.2×
Monthly cashflow live
- Estimated rent
- $2,369 high interval (Pro) →
- Mortgage (P&I)
- −$26
- Tax est. 1.5%
- −$6 /mo · $75/yr
- Insurance
- −$2
- HOA
- −$0
- Vacancy / Maint / Mgmt
- −$498
- Net cashflow
- $1,837
Break-even live
UW: 25.0% down · 7.5% · 30yr · 1.5% tax · 5.0% vac · 8.0% maint · 8.0% mgmt
Financing live
Cash to close
- Down payment
- $1,250
- Closing costs
- $150
- Reserves months
- —
- Total cash needed
- —
Loan-product check · same deal, 3 products live
Conventional
25% down · 7.5% · 30yr
- Down + closing
- —
- Monthly P&I
- —
- Monthly cashflow
- —
- DSCR
- —
- Eligible?
- —
Personal DTI + credit; lowest rate.
DSCR
20% down · 8.5% · 30yr
- Down + closing
- —
- Monthly P&I
- —
- Monthly cashflow
- —
- DSCR
- —
- Eligible?
- —
No personal income docs; deal must DSCR.
Hard money
10% down · 12.0% · 12mo
- Down + closing
- —
- Monthly P&I
- —
- Monthly cashflow
- —
- DSCR
- —
- Eligible?
- —
Short-term bridge; refi at stabilization.
Rent comps 40 comps
| Address | Beds | Baths | Sqft | Rent | $/sqft | DOM | Units | Dist |
|---|---|---|---|---|---|---|---|---|
| 1691 E Orangecrest Ave Palm Harbor, FL | 2.0 | 2.0 | 1193 | $2,600 | $2.18 | 16d | 1 | 0.14mi |
| 1701 E Orangeside Rd Palm Harbor, FL | 4.0 | 2.0 | 1559 | $2,935 | $1.88 | 2d | 1 | 0.18mi |
| 1801 E Orangeside Rd Palm Harbor, FL | 3.0 | 2.0 | 1369 | $2,575 | $1.88 | 24d | 1 | 0.20mi |
| 2523 Pine Ridge Way S Unit C2 Palm Harbor, FL | 2.0 | 2.0 | 1038 | $1,750 | $1.69 | 24d | 1 | 0.35mi |
| 2575 Pine Ridge Way S Unit A2 Palm Harbor, FL | 2.0 | 2.0 | 1104 | $1,590 | $1.44 | 24d | 1 | 0.37mi |
| 485 Westlake Blvd #70 Palm Harbor, FL | 3.0 | 2.5 | 1685 | $2,995 | $1.78 | 24d | 1 | 0.38mi |
| 2334 Citrus Hill Rd Palm Harbor, FL | 2.0 | 2.0 | 1189 | $2,350 | $1.98 | 4d | 1 | 0.43mi |
| 144 Stafford Cir Palm Harbor, FL | 2.0 | 2.0 | 1264 | $2,295 | $1.82 | 4d | 1 | 0.56mi |
| 2833 Orange Tree Cir N Unit C Palm Harbor, FL | 2.0 | 2.0 | 960 | $1,845 | $1.92 | 24d | 1 | 0.68mi |
| 1624 Heather Pl Palm Harbor, FL | 2.0 | 2.0 | 1248 | $2,295 | $1.84 | 24d | 1 | 0.72mi |
| 2945 Grovewood Blvd Unit A Palm Harbor, FL | 2.0 | 2.0 | 1030 | $1,775 | $1.72 | 18d | 1 | 0.85mi |
| 2481 Malcolm Dr Palm Harbor, FL | 2.0 | 2.0 | 1319 | $2,600 | $1.97 | 18d | 1 | 0.85mi |
| 2690 Coral Landings Blvd Palm Harbor, FL | 2.0–3.0 | 2.0 | 1135 | $2,000 | $1.76 | 12d | 2 | 0.86mi |
| 2869 Thistle Ct N Palm Harbor, FL | 3.0 | 2.0 | 1630 | $2,395 | $1.47 | 24d | 1 | 0.87mi |
| 2309 Malcolm Dr Palm Harbor, FL | 2.0 | 2.0 | 1535 | $2,495 | $1.63 | 4d | 1 | 0.87mi |
| 2130 Bancroft Pl Unit E Palm Harbor, FL | 2.0 | 2.0 | 1030 | $1,860 | $1.81 | 7d | 1 | 0.91mi |
| 2130 Bancroft Pl Unit E Palm Harbor, FL | 2.0 | 2.0 | 1030 | $1,850 | $1.80 | 3d | 1 | 0.91mi |
| 2914 Shannon Cir Palm Harbor, FL | 3.0 | 2.0 | 1518 | $2,800 | $1.84 | 11d | 1 | 0.92mi |
| 2914 Shannon Cir Palm Harbor, FL | 3.0 | 2.0 | 1518 | $2,800 | $1.84 | 24d | 1 | 0.92mi |
| 3023 Beecher Dr E Unit D Palm Harbor, FL | 3.0 | 2.5 | 1425 | $2,400 | $1.68 | 18d | 1 | 0.96mi |
| 2690 Coral Landings Blvd #415 Palm Harbor, FL | 3.0 | 2.0 | 1351 | $2,000 | $1.48 | 19d | 1 | 0.99mi |
| 3121 Beecher Dr E Unit A Palm Harbor, FL | 2.0 | 2.0 | 976 | $2,100 | $2.15 | 7d | 1 | 1.00mi |
| 3132 Brunswick Cir Palm Harbor, FL | 3.0 | 2.0 | 1858 | $2,900 | $1.56 | 4d | 1 | 1.00mi |
| 2914 Cypress Green Dr Palm Harbor, FL | 3.0 | 2.0 | 1245 | $2,600 | $2.09 | 19d | 1 | 1.02mi |
| 35820 U.S. 19 Unit C1 Palm Harbor, FL | 3.0 | 2.0 | 1404 | $2,781 | $1.98 | 4d | 1 | 1.08mi |
| 35820 U.S. 19 Unit B1 Palm Harbor, FL | 2.0 | 2.0 | 1116 | $2,245 | $2.01 | 4d | 1 | 1.08mi |
| 2701 Penzance St Unit 2701 Palm Harbor, FL | 3.0 | 2.5 | 1540 | $2,095 | $1.36 | 24d | 1 | 1.13mi |
| 3266 Haviland Ct Palm Harbor, FL | 3.0 | 2.0 | 1210 | $1,895 | $1.57 | 24d | 1 | 1.15mi |
| 2700 Penzance St Palm Harbor, FL | 3.0 | 2.5 | 1540 | $2,200 | $1.43 | 15d | 1 | 1.15mi |
| 3300 Fox Chase Cir N Palm Harbor, FL | 2.0 | 2.0 | 906 | $2,125 | $2.35 | 1d | 2 | 1.16mi |
| 248 St Ives Dr #248 Palm Harbor, FL | 3.0 | 2.0 | 1350 | $2,300 | $1.70 | 4d | 1 | 1.17mi |
| 36090 US Highway 19 N Palm Harbor, FL | 1.0–3.0 | 1.0–2.0 | 1046 | $3,235 | $3.09 | 3d | 66 | 1.26mi |
| 1328 Illinois Ave Palm Harbor, FL | 2.0 | 1.5 | 1000 | $1,700 | $1.70 | 24d | 1 | 1.29mi |
| 1833 Orange Boulevard Way Palm Harbor, FL | 2.0 | 2.0 | 1000 | $1,950 | $1.95 | 2d | 1 | 1.38mi |
| 1851 Orange Boulevard Way Palm Harbor, FL | 2.0 | 2.0 | 1000 | $1,750 | $1.75 | 24d | 1 | 1.39mi |
| 1825 Orange Boulevard Way Palm Harbor, FL | 2.0 | 2.0 | 1000 | $1,950 | $1.95 | 12d | 1 | 1.40mi |
| 1865 Orange Boulevard Way Palm Harbor, FL | 2.0 | 2.0 | 1000 | $1,950 | $1.95 | 24d | 1 | 1.42mi |
| 4000 Poinciana Ct Palm Harbor, FL | 3.0 | 2.0 | 1298 | $2,600 | $2.00 | 3d | 1 | 1.44mi |
| 31790 US Highway 19 N Palm Harbor, FL | 1.0–2.0 | 1.0–2.0 | 842 | $2,066 | $2.45 | 11d | 16 | 1.45mi |
| 245 Lake Tarpon Dr Palm Harbor, FL | 2.0 | 2.0 | 1000 | $1,995 | $2.00 | 2d | 1 | 1.45mi |
Listing history 10 events
-
2026-05-14$5,000 Active
-
2026-01-14historical
-
2026-01-05$5,000 Active
-
2007-07-17soldstatus $187,700
-
2007-06-30soldstatus $187,700 1-char remark
Show marketing remark (1 chars)
0
-
2007-06-15$200,000 1-char remark
Show marketing remark (1 chars)
0
-
1998-10-20soldstatus $110,300
-
1992-06-18soldstatus $89,000
-
1981-09-01soldstatus $68,900
-
1981-05-01soldstatus $62,300
ⓘ Source: listings_history table (triggers on properties + properties_extension) + one-shot
backfill from property_details.listing_events for pre-trigger history.
Climate risk First Street
- Flood 1/10 Low FEMA zone X (unshaded) · 0% chance over 30 yrs
- Wildfire 1/10 Low
- Heat 10/10 Extreme 7 d/yr ≥108°F today · 27 d/yr by 30 yrs out
- Wind 10/10 Extreme 99% chance of damaging wind over 30 yrs
- Air quality 3/10 Moderate 2 unhealthy d/yr today · 2 by 30 yrs out
Nearby sold comps map
Loading sold comps map…
Walkable amenities ~0.75 mi
Loading nearby amenities…
Taxation est. · year 1
- Rental income
- $28,434
- − Mortgage interest
- −$280
- − Property taxes
- −$75
- − Insurance
- −$25
- − Repairs & maintenance
- −$2,275
- − Management
- −$2,275
- − Depreciation
- −$145
- Taxable income
- $23,359
- Est. tax owed @ 24.0%
- −$5,606
- After-tax cash flow
- $16,442/yr
For passive investors: Depreciation is non-cash, so a rental often shows a tax loss while cash-flowing — sheltering income. Rental losses are passive: they offset passive income freely, and up to $25,000/yr can offset ordinary (W-2) income if you actively participate and your MAGI is under $100k (phasing out to $0 by $150k); unused losses carry forward. On sale, claimed depreciation is recaptured at up to 25%, and gains may owe capital-gains tax (a 1031 exchange can defer both). Figures are a year-1 estimate at your 24.0% rate — not tax advice; consult a CPA.
Schools (NCES district)
- District
- Pinellas
- NCES district ID
- 1201560
- Math proficiency
- 51% ▼ -5.00%
- Reading proficiency
- 51% ▼ -3.00%
- Median HH income
- $46,270
- Composite
- 43.27/100
- National rank
- #3046
- State rank
- #31 of 73 in FL
Livability — Palm Harbor
- Score
- 81/100
- State rank
- #95
- US rank
- #1470
Category grades
Schools grade is shown separately in the Schools card above.
Census & demographics
- Census place
- Palm Harbor, FL
- County
- Pinellas County · 939,478 people
- City population
- 79,072
- Metro
- Tampa-St. Petersburg-Clearwater, FL
- Population (ZIP)
- 33,911
- Household income
- $92,885
- Rent vs Own
- Severe rent burden
- 919.0
Population outlook (Pinellas County) Hauer SSP2
- Today (2025)
- 1,027,532 people
- By 2030
- 1,063,586 · +3.5%
- By 2040
- 1,125,020 · +9.5%
- By 2050
- 1,168,637 · +13.7%
- By 2075
- 1,265,188 · +23.1%
- By 2100
- 1,260,357 · +22.7%
Race, ethnicity, and origin ACS 2023
- Neighborhood character
- Predominantly White (85%)
- Race & ethnicity
- White 85% Hispanic / Latino 8% Two or more races 7% Asian 2% Black 1%
- Hispanic origin (detail)
- Mexican 2% Puerto Rican 2% Cuban 1%
- Common ancestry
- Romanian 5% Lithuanian 2% Slovak 2%
- Foreign-born
- 14% · Canada, China, Dominican Republic
- Languages at home
- 83% English-only · Spanish 5% Arabic 4% Russian/Polish/Slavic 3%
Political lean MEDSL · Pinellas
- 2024 margin
- Lean R (+5.2) · D 46.9% · R 52.1%
- 2008→2024 swing
- -13.5pp toward R · 2008: 8.3pp · 2024: -5.2pp
- All cycles
- 2024: R+5.2 2020: D+0.2 2016: R+1.1 2012: D+5.6 2008: D+8.3
Not yet ingested
- Civics
- —
Market trends
- HPI YoY
- ▼ -295.95%
- Current HPI
- 314.8777
- Rent YoY
- ▼ -4.33%
- Metro
- Tampa-St. Petersburg-Clearwater, FL
- State GDP YoY
- ▲ 3.28%
- F500 in state
- 36
Industry mix (Fortune 500 HQ in FL)
| Industry | F500 HQs | Revenue |
|---|---|---|
| Industrial Technology | 2 | $29B |
|
||
| Insurance | 2 | $17B |
|
||
| Retail | 1 | $60B |
|
||
| Technology Distribution | 1 | $58B |
|
||
| Homebuilding | 1 | $35B |
|
||
| Technology Manufacturing | 1 | $35B |
|
||
Price history
-92.0% since first listed10 events — show timeline
- 2026-05-14 Listed $5,000 FLKMLS
- 2026-01-14 Listing Removed — FLKMLS
- 2026-01-05 Listed $5,000 FLKMLS
- 2007-07-17 Sold (Public Records) $187,700 Public Records
- 2007-06-30 Sold (MLS) $187,700 Stellar MLS as Distributed by MLS Grid
- 2007-06-15 Listed $200,000 Stellar MLS as Distributed by MLS Grid
- 1998-10-20 Sold (Public Records) $110,300 Public Records
- 1992-06-18 Sold (Public Records) $89,000 Public Records
- 1981-09-01 Sold (Public Records) $68,900 Public Records
- 1981-05-01 Sold (Public Records) $62,300 Public Records
Property tax history
-1.2%/yrLatest (2025): $1,856 · +6.5% YoY. Source: county tax records.
Cash-flow waterfall
monthlySold comps — $/sqft
last 12 mo · ≤1 miLoading sold comps…