6359 Sittig Ave · Maplewood Park, OH
Flood risk 1/10 · Minimal
- FEMA flood zone
- X (unshaded)
- Chance of flooding over 30 yrs
- 0.0%
- Est. flood insurance / yr
- $473 – $860
Fire risk 1/10 · Minimal
- Est. fire insurance / yr
- $713 – $1,323
Heat risk 2/10 · Minimal
- Hot days now (above 97°F)
- 7 days/yr
- Hot days in 30 yrs
- 17 days/yr
Wind risk 1/10 · Minimal
- Chance of severe wind over 30 yrs
- —
Air-quality risk 3/10 · Minor
- Unhealthy air days now
- 1 days/yr
- Unhealthy air days in 30 yrs
- 4 days/yr
Risk factors via First Street. Map © Google.
Why this score? — see what drove the C grade
The composite is a weighted blend of 9 inputs, each scored 0–100. Each bar is that input's sub-score; the figure is the points it added to the 100-point composite (weight × sub-score).
- Cash flow +19.1/30.0
- ARV discount +15.0/15.0
- DSCR +6.0/10.0
- Schools +4.8/10.0
- 1% rule +4.1/10.0
- Livability +3.6/5.0
- Rent growth +2.5/5.0
- Condition / age +2.5/5.0
- Appreciation +0.0/10.0
$139,900
🖨 Deal sheet 📄 Offer letter ✓ Due diligence
Listing remarks MLS
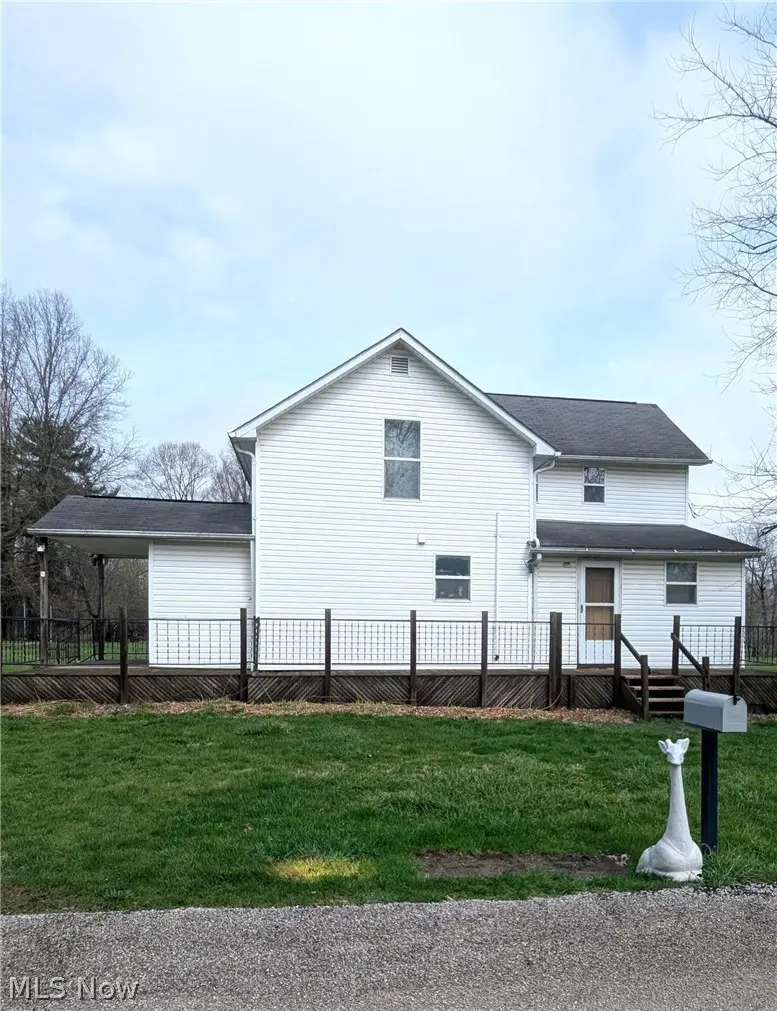
Looking for a fixer upper or possibly investment property? Take a look at 6354 Sittig Ave. in Hubbard. This home features 4 bedrooms, 2 full baths across 1,704 square feet of living space. The property does need renovations, updating and some tlc, but could make a very nice home, or income producing property for somebody. The home has been rented out by the same tenants since the early 1990’s. On the main floor you will see a very large kitchen area with a walk-in pantry, first floor bedroom, full bath, living room and family room which all have hard wood floors underneath the carpet. The upstairs has three very large bedrooms that also have hardwood floors under the carpet and another full bathroom. The basement of the home is very old being a century home but does have a furnace that is in working order, and newer hot water heater. The outside of the home has had some things done to it over the years with vinyl siding and newer windows and porches off the front and side doors. There is also a walk-up access door from the basement to the side yard as well as a nice, detached block two car garage. The property includes 19 parcels that all included add up to 1.4656 acres of property and has frontage on two different roads. Home being sold as-is condition. Call to schedule your private showing today.
Key facts
- Hard wood floors
- Working furnace
- Large kitchen area
Tags
Neighborhood map
What this means for you Summary
Snapshot
- This is a 3-bed/1.0-bath single-family listed at $140k.
Deal economics
- At list price, monthly cash flow is $148 ($2k/yr) — positive.
- The deal already cash-flows at list — no discount required.
- To meet the 1% rule (rent ≥ 1% of price), the offer needs to be $128k (8.9% below list).
- Recommended offer: $128k (8.9% below list) — sets the bar for 1% rule.
Location & tenants
- Location reads 72/100 on livability (#395 in OH) — a middle-class / working-renter tenant base. Strengths: cost of living A+, housing A+, commute A; Watch: crime D+, schools F, amenities F.
- Hubbard Exempted Village (suburban): math 54% / reading 60% proficiency, ranked #346 of 656 in OH (top 53%) — acceptable for families but not a draw, mixed tenant base, ~2y average lease.
- Market conditions: 62 active listings in the ZIP; 1 comparable units currently listed for rent nearby; 129 units permitted in Trumbull County in 2024 (0 in 5+ unit buildings).
Forward outlook
- Local home prices are declining (-3.0%/yr); year-one equity from $967 of loan paydown is wiped out by about $4k of value loss. Plan a longer hold.
- Trumbull County population projected at -22% by 2050 — secular population decline; favor cash flow + early exit over multi-decade hold.
Negotiation context
- It's been on market 77 days — a 6% lower offer ($132k) is reasonable based on typical stale-listing flexibility.
- 2 sale attempts since 29y ago with the ask held roughly flat each time — persistent listings suggest the price (not the market) is what's stuck; bring a comps-based counter.
Risks & watch-outs
- Watch-outs: built in 1901 — expect roof / HVAC / electrical / plumbing capex.
Questions for the listing agent
- It's been on market 77 days. Have you received any prior offers? Is the seller open to a 9% concession, seller financing, or rate buy-down credit?
- Built in 1901 — when were the roof, HVAC, electrical panel, plumbing, and water heater last replaced?
- Why hasn't it sold? Are there any deal-killer items the seller is aware of (foundation, flood, title, zoning, code violations)?
- Is there a deadline driving the sale (1031 exchange, divorce, estate, relocation)? That informs how much negotiation room exists.
- Schools are F-rated, which usually means shorter tenancies and higher turnover. Who's the typical renter profile here, and what's been the actual vacancy rate?
- Crime grade is D in this area — have there been break-ins, vandalism, or insurance claims at this property in the last 3 years? What carrier currently insures it and at what premium?
- What's the average days-on-market for RENTAL listings here right now (not sales)? A rising rental-DOM trend means longer vacancies and softer asking-rent achievability than the comps imply.
- What's the recent tenant-quality profile in this submarket — average credit score on applications, eviction rate, late-payment / NSF rate, and stable-employment percentage? A property-management company in the area should have these aggregated.
- How much new for-sale + rental construction is in the pipeline within 1–3 miles? Heavy new supply typically softens prices + rents 12–24 months out; constrained supply supports both.
Investment metrics
- 1% rule
- 0.91% ✗
- Cap rate
- 7.56%
- Cash-on-cash
- 4.53%
- DSCR
- 1.20
- GRM
- 9.1
CMA / ARV
- ARV (median comp)
- $178,710
- List price
- $139,900
- Delta
- -21.72%
- Verdict
- UNDERPRICED
- Comps
- 20 within 1.0 mi
Show comp detail 7 sales within ~0.75 mi
| Address | Dist | Beds/Ba | Sqft | Sold | Price | $/sf | Match |
|---|---|---|---|---|---|---|---|
| 3515 Shadyside Dr | 0.57mi | 3/2.0 | 1,668 (-2%) | 22mo | $140,000 | $84 | 48 |
| 444 Grandview Ave SE | 0.72mi | 3/2.0 | 1,880 (+10%) | 1mo | $289,900 | $154 | 45 |
| 279 Parish Ave | 0.69mi | 4/3.0 (+1) | 1,633 (-4%) | 5mo | $185,500 | $114 | 44 |
| 663 Meadowland Dr | 0.69mi | 3/1.5 | 1,520 (-11%) | 5mo | $135,000 | $89 | 43 |
| 3488 Oakmont Dr | 0.66mi | 3/1.0 | 1,500 (-12%) | 9mo | $139,000 | $93 | 42 |
| 652 Meadowland Dr | 0.74mi | 3/1.5 | 1,860 (+9%) | 8mo | $205,000 | $110 | 42 |
| 649 Wendemere Dr | 0.63mi | 4/2.0 (+1) | 1,856 (+9%) | 13mo | $284,900 | $154 | 36 |
Match score weights: distance 35% · size 25% · config 20% · recency 20%. Top-matched comps best support the ARV.
Projected returns pro-forma
-3.0% appreciation · 3.0% rent growth · sell at horizon
- IRR
- -9.3%
- Equity multiple
- 0.66×
- Total profit
- $-13,303
- Equity at exit
- $20,860
- IRR
- 0.1%
- Equity multiple
- 1.01×
- Total profit
- $348
- Equity at exit
- $12,096
Cash invested: $39,172 (down + closing). Projections, not guarantees.
Landlord ↔ Tenant lean methodology
- Overall (STATE)
- 73 Landlord-Friendly
- State Ohio
- 73 Landlord-Friendly · R+6
- County
- — inherits STATE
- City
- — inherits STATE
ZIP-level market 44425
- Home prices YoY
- -25.2%
- Active inventory
- 62
- Price-to-rent
- 9.1×
Monthly cashflow live
- Estimated rent
- $1,275 medium interval (Pro) →
- Mortgage (P&I)
- −$734
- Tax from tax record
- −$68 /mo · $810/yr
- Insurance
- −$58
- HOA
- −$0
- Vacancy / Maint / Mgmt
- −$268
- Net cashflow
- $148
Break-even live
UW: 25.0% down · 7.5% · 30yr · 1.5% tax · 5.0% vac · 8.0% maint · 8.0% mgmt
Financing live
Cash to close
- Down payment
- $34,975
- Closing costs
- $4,197
- Reserves months
- —
- Total cash needed
- —
Loan-product check · same deal, 3 products live
Conventional
25% down · 7.5% · 30yr
- Down + closing
- —
- Monthly P&I
- —
- Monthly cashflow
- —
- DSCR
- —
- Eligible?
- —
Personal DTI + credit; lowest rate.
DSCR
20% down · 8.5% · 30yr
- Down + closing
- —
- Monthly P&I
- —
- Monthly cashflow
- —
- DSCR
- —
- Eligible?
- —
No personal income docs; deal must DSCR.
Hard money
10% down · 12.0% · 12mo
- Down + closing
- —
- Monthly P&I
- —
- Monthly cashflow
- —
- DSCR
- —
- Eligible?
- —
Short-term bridge; refi at stabilization.
Rent comps 1 comps
| Address | Beds | Baths | Sqft | Rent | $/sqft | DOM | Units | Dist |
|---|---|---|---|---|---|---|---|---|
| 2983 Megan Cir Youngstown, OH | 4.0 | 2.0 | 1366 | $1,275 | $0.93 | 13d | 1 | 1.02mi |
Listing history 19 events
-
2026-06-19days on market $139,900 Active 77 DOM
-
2026-06-18days on market $139,900 Active 76 DOM
-
2026-06-17days on market $139,900 Active 75 DOM
-
2026-06-16days on market $139,900 Active 74 DOM
-
2026-06-15days on market $139,900 Active 73 DOM
-
2026-06-14days on market $139,900 Active 71 DOM
-
2026-06-13days on market $139,900 Active 70 DOM
-
2026-06-10days on market $139,900 Active 68 DOM
-
2026-06-09days on market $139,900 Active 67 DOM
-
2026-06-08days on market $139,900 Active 66 DOM
-
2026-06-07days on market $139,900 Active 65 DOM
-
2026-06-05days on market $139,900 Active 62 DOM
-
2026-06-02days on market $139,900 Active 60 DOM
-
2026-06-01days on market $139,900 Active 59 DOM
-
2026-05-31days on market $139,900 Active 58 DOM
-
2026-05-30days on market $139,900 Active 57 DOM
-
2026-04-02$139,900 Active 1326-char remark
Show marketing remark (1326 chars)
Looking for a fixer upper or possibly investment property? Take a look at 6354 Sittig Ave. in Hubbard. This home features 4 bedrooms, 2 full baths across 1,704 square feet of living space. The property does need renovations, updating and some tlc, but could make a very nice home, or income producing property for somebody. The home has been rented out by the same tenants since the early 1990’s. On the main floor you will see a very large kitchen area with a walk-in pantry, first floor bedroom, full bath, living room and family room which all have hard wood floors underneath the carpet. The upstairs has three very large bedrooms that also have hardwood floors under the carpet and another full bathroom. The basement of the home is very old being a century home but does have a furnace that is in working order, and newer hot water heater. The outside of the home has had some things done to it over the years with vinyl siding and newer windows and porches off the front and side doors. There is also a walk-up access door from the basement to the side yard as well as a nice, detached block two car garage. The property includes 19 parcels that all included add up to 1.4656 acres of property and has frontage on two different roads. Home being sold as-is condition. Call to schedule your private showing today.
-
1997-10-28historical
-
1997-08-20$39,900
ⓘ Source: listings_history table (triggers on properties + properties_extension) + one-shot
backfill from property_details.listing_events for pre-trigger history.
Tax reassessment forecast OH · Partial reset (capped growth)
- Current annual tax
- $810 · $68/mo
- Projected year-2 tax
- $1,496 · $125/mo
- Expected delta
- +$686/yr (+$57/mo · 84.7%)
ⓘ Screening estimate from a state-policy table — verify with the county assessor before closing.
Climate risk First Street
- Flood 1/10 Low FEMA zone X (unshaded) · 0% chance over 30 yrs
- Wildfire 1/10 Low
- Heat 2/10 Low 7 d/yr ≥97°F today · 17 d/yr by 30 yrs out
- Wind 1/10 Low
- Air quality 3/10 Moderate 1 unhealthy d/yr today · 4 by 30 yrs out
Nearby sold comps map
Loading sold comps map…
Walkable amenities ~0.75 mi
Loading nearby amenities…
Taxation est. · year 1
- Rental income
- $15,300
- − Mortgage interest
- −$7,837
- − Property taxes
- −$810
- − Insurance
- −$700
- − Repairs & maintenance
- −$1,224
- − Management
- −$1,224
- − Depreciation
- −$4,070
- Taxable loss
- −$564
- Est. tax savings @ 24.0%
- +$135
- After-tax cash flow
- $1,909/yr
For passive investors: Depreciation is non-cash, so a rental often shows a tax loss while cash-flowing — sheltering income. Rental losses are passive: they offset passive income freely, and up to $25,000/yr can offset ordinary (W-2) income if you actively participate and your MAGI is under $100k (phasing out to $0 by $150k); unused losses carry forward. On sale, claimed depreciation is recaptured at up to 25%, and gains may owe capital-gains tax (a 1031 exchange can defer both). Figures are a year-1 estimate at your 24.0% rate — not tax advice; consult a CPA.
Schools (NCES district)
- District
- Hubbard Exempted Village
- NCES district ID
- 3904542
- Math proficiency
- 54% ▼ -19.00%
- Reading proficiency
- 60% ▼ -12.00%
- Median HH income
- $45,623
- Composite
- 48.15/100
- National rank
- #2179
- State rank
- #346 of 656 in OH
Livability — Maplewood Park
- Score
- 72/100
- State rank
- #395
- US rank
- #6500
Category grades
Schools grade is shown separately in the Schools card above.
Census & demographics
- Census place
- Maplewood Park, OH
- County
- Trumbull · 193,293 people
- Metro
- Youngstown-Warren, OH
- Population (ZIP)
- 13,329
- Household income
- $62,287
- Rent vs Own
- Severe rent burden
- 11.1
Population outlook (Trumbull County) Hauer SSP2
- Today (2025)
- 191,696 people
- By 2030
- 184,015 · -4.0%
- By 2040
- 166,810 · -13.0%
- By 2050
- 149,857 · -21.8%
- By 2075
- 115,769 · -39.6%
- By 2100
- 83,617 · -56.4%
Race, ethnicity, and origin ACS 2023
- Neighborhood character
- Predominantly White (92%)
- Race & ethnicity
- White 92% Hispanic / Latino 3% Black 3% Two or more races 2%
- Common ancestry
- Romanian 4% Slovak 2% Scandinavian 1%
- Foreign-born
- 2% · Canada
- Languages at home
- 97% English-only · Spanish 1%
Political lean MEDSL · Trumbull
- 2024 margin
- R (+16.8) · D 41.2% · R 58.0%
- 2008→2024 swing
- -39.2pp toward R · 2008: 22.4pp · 2024: -16.8pp
- All cycles
- 2024: R+16.8 2020: R+10.6 2016: R+6.4 2012: D+22.2 2008: D+22.4
Not yet ingested
- Civics
- —
Market trends
- HPI YoY
- ▼ -68.06%
- Current HPI
- 201.5984
- Rent YoY
- —
- Metro
- —
- State GDP YoY
- ▲ 1.98%
- F500 in state
- 48
Industry mix (Fortune 500 HQ in OH)
| Industry | F500 HQs | Revenue |
|---|---|---|
| Insurance | 3 | $145B |
|
||
| Industrial Machinery | 3 | $49B |
|
||
| Financial Services | 3 | $24B |
|
||
| Consumer Goods | 2 | $93B |
|
||
| Aerospace / Defense | 2 | $47B |
|
||
| Utilities | 2 | $33B |
|
||
Price history
+250.6% since first listed3 events — show timeline
- 2026-04-02 Listed $139,900 MLSNOW
- 1997-10-28 Listing Removed — MLSNOW
- 1997-08-20 Listed $39,900 MLSNOW
Property tax history
-1.4%/yrLatest (2025): $810 · -0.1% YoY. Source: county tax records.
Cash-flow waterfall
monthlySold comps — $/sqft
last 12 mo · ≤1 miLoading sold comps…