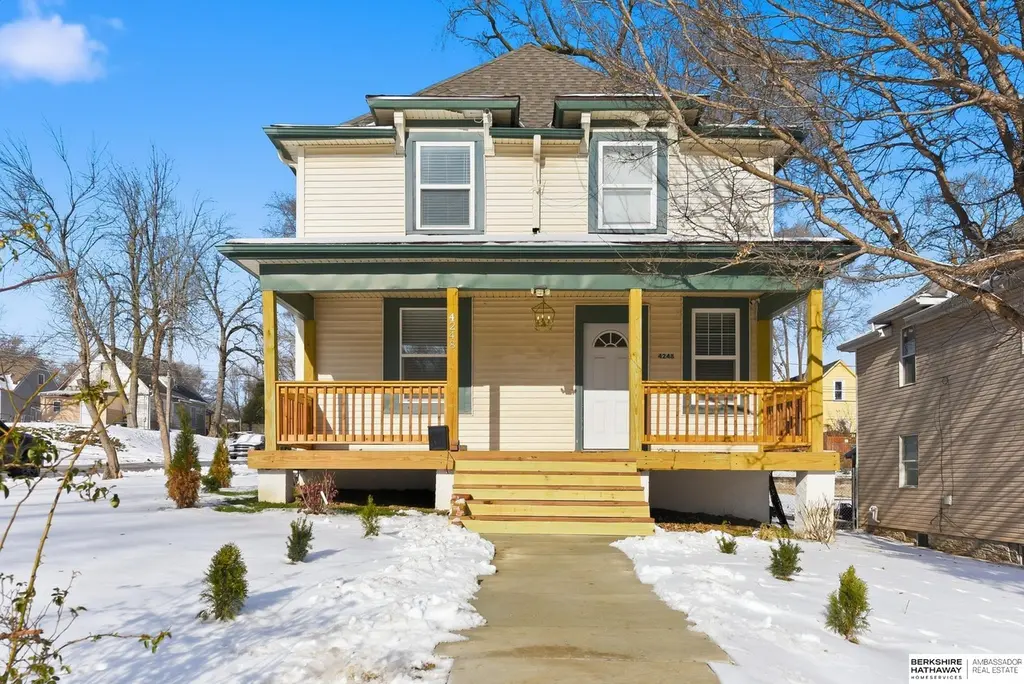
4248 Burdette St · Omaha, NE
Flood risk 1/10 · Minimal
- FEMA flood zone
- X (unshaded)
- Chance of flooding over 30 yrs
- 0.0%
- Est. flood insurance / yr
- $473 – $860
Fire risk 1/10 · Minimal
- Est. fire insurance / yr
- $1,161 – $2,155
Heat risk 3/10 · Minor
- Hot days now (above 104°F)
- 7 days/yr
- Hot days in 30 yrs
- 15 days/yr
Wind risk 2/10 · Minimal
- Chance of severe wind over 30 yrs
- —
Air-quality risk 2/10 · Minimal
- Unhealthy air days now
- 0 days/yr
- Unhealthy air days in 30 yrs
- 1 days/yr
Risk factors via First Street. Map © Google.
Why this score? — see what drove the C+ grade
The composite is a weighted blend of 9 inputs, each scored 0–100. Each bar is that input's sub-score; the figure is the points it added to the 100-point composite (weight × sub-score).
- Cash flow +20.2/30.0
- Appreciation +10.0/10.0
- ARV discount +7.5/15.0
- DSCR +6.4/10.0
- 1% rule +4.5/10.0
- Livability +4.2/5.0
- Rent growth +3.3/5.0
- Condition / age +2.5/5.0
- Schools +2.1/10.0
$198,500
🖨 Deal sheet (PDF) 📄 Offer letter ✓ Due diligence
Listing remarks
Welcome to 4248 Burdette Street, a beautifully refreshed property offering modern updates and low-maintenance living. This home features brand-new windows, a new roof, and new concrete, giving it excellent curb appeal and long-term peace of mind. Inside, you will find a fully remodeled kitchen and updated bathrooms, thoughtfully finished for comfort and style. New blinds throughout add a clean, move-in-ready touch. Located on a corner lot, this home provides extra space and great natural light. Seller assistance available.
Key facts
- New concrete
- Updated bathrooms
- New roof
Tags
Property features AI
Exterior
- Parking: No garage
- Utilities: Electricity available; Natural gas available; Public water; Public sewer
- Home design: Single-family residence; Two levels; Not new / not a model
- Construction: Built in 1900; Block foundation; Composition roof
- Exterior features: Porch; Patio; Corner city lot with public sidewalk; Lot approximately 50 x 120 (about 0.13 acre)
Interior
- Kitchen: Range
- Bedrooms: Primary bedroom on second floor; Additional bedrooms on second floor
- Flooring: Laminate
- Bathrooms: Two full bathrooms
- Heating & cooling: Natural gas forced-air heating; Central air conditioning
- Interior features: Partially finished basement; No fireplaces; Laminate flooring
Neighborhood map
What this means for you Summary
Snapshot
- This is a 4-bed/1.5-bath other listed at $198k.
Deal economics
- At list price, monthly cash flow is $251 ($3k/yr) — positive.
- The deal already cash-flows at list — no discount required.
- To meet the 1% rule (rent ≥ 1% of price), the offer needs to be $189k (5.0% below list).
- Recommended offer: $189k (5.0% below list) — sets the bar for 1% rule.
Location & tenants
- Location reads 84/100 on livability (#7 in NE, #663 nationally) — a professional / high-income tenant draw. Strengths: amenities A+, commute A+, cost of living A+; Watch: crime F.
- Omaha Public Schools (urban): math 20% / reading 28% proficiency, ranked #110 of 111 in NE (top 99%) — low school quality limits family demand, transient renter base, plan for 1-2y turnover; 62% free/reduced lunch — lower-income household profile, screen leases tightly.
- Zoned schools: King Elementary School (math 8% / reading 12%, grade F, #494 of 502 statewide, top 99%, 326 students, 0% FRL); Monroe Middle School (math 8% / reading 15%, grade F, #127 of 128 statewide, top 99%, 769 students, 0% FRL); Benson High School (math 9% / reading 12%, grade F, #257 of 261 statewide, top 98%, 1,570 students, 0% FRL) — zoned schools average 0% FRL vs 62% district-wide (62 pts lower); this property's tenant base skews higher-income than the district average.
- Zoned-school proficiency averages 11% at this address vs 24% district-wide (-13 pts) — the specific schools serving this property underperform the Omaha Public Schools average; the district grade overstates school quality for this exact location.
- Market conditions: Rents rising (+3.2%/yr); 139 active listings in the ZIP; 28 comparable units currently listed for rent nearby; rentals at typical pace (median 24d on market — plan ~3-4 weeks tenant-placement turnaround); 46% of comp listings sitting > 30 days — soft ceiling on asking rent; lower-income renter base — watch delinquency; 4,539 units permitted in Douglas County in 2024 (2,583 in 5+ unit buildings).
Forward outlook
- In year one you build about $21k of equity ($1k loan paydown + $20k appreciation (10.0% local appreciation)).
- Douglas County population projected at +28% by 2050 — long-run rental-demand tailwind backs the buy-and-hold thesis.
- At projected returns (10.0% appreciation + 3.2% rent growth), your $56k cash investment doubles in ~3 years — after that, you're playing with house money.
- By year 2, paydown + projected appreciation supports a ~$34k cash-out refi (75% LTV) — recoverable capital for the next deal without selling this one.
Negotiation context
- Only 4 days on market — expect competitive offers; lowballing is unlikely to land.
- 6 sale attempts since 18y ago with the ask held roughly flat each time — persistent listings suggest the price (not the market) is what's stuck; bring a comps-based counter.
- Current owner paid $140k; 42% above their basis — modest negotiation headroom, anchor on the comps not their cost.
Risks & watch-outs
- Watch-outs: built in 1900 — expect roof / HVAC / electrical / plumbing capex.
Questions for the listing agent
- Built in 1900 — when were the roof, HVAC, electrical panel, plumbing, and water heater last replaced?
- Is there a deadline driving the sale (1031 exchange, divorce, estate, relocation)? That informs how much negotiation room exists.
- Crime grade is F in this area — have there been break-ins, vandalism, or insurance claims at this property in the last 3 years? What carrier currently insures it and at what premium?
- What's the average days-on-market for RENTAL listings here right now (not sales)? A rising rental-DOM trend means longer vacancies and softer asking-rent achievability than the comps imply.
- What's the recent tenant-quality profile in this submarket — average credit score on applications, eviction rate, late-payment / NSF rate, and stable-employment percentage? A property-management company in the area should have these aggregated.
- How much new for-sale + rental construction is in the pipeline within 1–3 miles? Heavy new supply typically softens prices + rents 12–24 months out; constrained supply supports both.
Investment metrics
- 1% rule
- 0.95% ✗
- Cap rate
- 7.81%
- Cash-on-cash
- 5.42%
- DSCR
- 1.24
- GRM
- 8.8
CMA / ARV
No comps found within radius.
Projected returns pro-forma
10.0% appreciation · 3.22% rent growth · sell at horizon
- IRR
- 28.3%
- Equity multiple
- 3.24×
- Total profit
- $124,449
- Equity at exit
- $178,825
- IRR
- 24.7%
- Equity multiple
- 7.38×
- Total profit
- $354,671
- Equity at exit
- $385,642
Cash invested: $55,580 (down + closing). Projections, not guarantees.
Landlord ↔ Tenant lean methodology
- Overall (STATE)
- 83 Strongly Landlord-Friendly
- State Nebraska
- 83 Strongly Landlord-Friendly · R+13
- County
- — inherits STATE
- City
- — inherits STATE
ZIP-level market 68111
- Home prices YoY
- 4.0%
- Rents YoY
- 3.2%
- Active inventory
- 139
- Price-to-rent
- 8.8×
Monthly cashflow live
- Estimated rent
- $1,886 high interval (Pro) →
- Mortgage (P&I)
- −$1,041
- Tax from tax record
- −$116 /mo · $1,388/yr
- Insurance
- −$83
- HOA
- −$0
- Vacancy / Maint / Mgmt
- −$396
- Net cashflow
- $251
Break-even live
Sensitivity live
| Price | -10% $363 | -5% $307 | +0% $251 | +5% $195 | +10% $138 |
|---|---|---|---|---|---|
| Rent | -10% $102 | -5% $176 | +0% $251 | +5% $325 | +10% $400 |
| Rate | -1.0pp $351 | -0.5pp $301 | base $251 | +0.5pp $199 | +1.0pp $147 |
UW: 25.0% down · 7.5% · 30yr · 1.5% tax · 5.0% vac · 8.0% maint · 8.0% mgmt
Financing live
Cash to close
- Down payment
- $49,625
- Closing costs
- $5,955
- Reserves months
- —
- Total cash needed
- —
Loan-product check · same deal, 3 products live
Conventional
25% down · 7.5% · 30yr
- Down + closing
- —
- Monthly P&I
- —
- Monthly cashflow
- —
- DSCR
- —
- Eligible?
- —
Personal DTI + credit; lowest rate.
DSCR
20% down · 8.5% · 30yr
- Down + closing
- —
- Monthly P&I
- —
- Monthly cashflow
- —
- DSCR
- —
- Eligible?
- —
No personal income docs; deal must DSCR.
Hard money
10% down · 12.0% · 12mo
- Down + closing
- —
- Monthly P&I
- —
- Monthly cashflow
- —
- DSCR
- —
- Eligible?
- —
Short-term bridge; refi at stabilization.
Rent comps 28 comps
| Address | Beds | Baths | Sqft | Rent | $/sqft | DOM | Units | Dist |
|---|---|---|---|---|---|---|---|---|
| 4542 Franklin St Unit Labs Omaha, NE | 5.0 | 2.5 | 2000 | $1,900 | $0.95 | 44d | 1 | 0.37mi |
| 4276 Binney St Omaha, NE | 4.0 | 1.0 | 1358 | $1,495 | $1.10 | 44d | 1 | 0.45mi |
| 4874 Maple St Omaha, NE | 3.0 | 1.0 | 1098 | $1,545 | $1.41 | 44d | 1 | 0.66mi |
| 3002 N 48th Ave Omaha, NE | 4.0 | 2.0 | 1205 | $1,550 | $1.29 | 24d | 1 | 0.68mi |
| 5011 Miami St Omaha, NE | 3.0 | 3.0 | 2180 | $2,200 | $1.01 | 44d | 1 | 0.72mi |
| 2914 N 49th Ave Omaha, NE | 3.0 | 1.0 | 1375 | $1,615 | $1.17 | 24d | 1 | 0.74mi |
| 3430 Seward St Omaha, NE | 3.0 | 1.0 | 1371 | $1,695 | $1.24 | 15d | 1 | 0.80mi |
| 3314 Franklin St Omaha, NE | 4.0 | 2.0 | 1635 | $1,600 | $0.98 | 44d | 1 | 0.86mi |
| 3508 N 47th Ave Omaha, NE | 3.0 | 1.0 | 1425 | $1,600 | $1.12 | 19d | 1 | 0.88mi |
| 3535 N 45th Ave Omaha, NE | 3.0 | 1.0 | 1325 | $1,800 | $1.36 | 44d | 1 | 0.89mi |
| 4806 Webster St Omaha, NE | 3.0 | 2.5 | 1589 | $2,295 | $1.44 | 3d | 1 | 0.98mi |
| 4824 Webster St Unit 4824/4824 Omaha, NE | 4.0 | 1.0 | 1317 | $1,050 | $0.80 | 44d | 1 | 1.01mi |
| 3808 N 48th St Omaha, NE | 3.0 | 2.0 | 1400 | $2,000 | $1.43 | 3d | 1 | 1.09mi |
| 5004 Webster St Omaha, NE | 4.0 | 3.0 | 2156 | $2,500 | $1.16 | 44d | 1 | 1.11mi |
| 4918 California St Omaha, NE | 3.0 | 1.0 | 1369 | $1,695 | $1.24 | 24d | 1 | 1.17mi |
| 5610 Seward St Omaha, NE | 4.0 | 2.0 | 1682 | $2,200 | $1.31 | 44d | 1 | 1.22mi |
| 5633 Parker St Omaha, NE | 3.0 | 1.5 | 1200 | $1,695 | $1.41 | 44d | 1 | 1.23mi |
| 303 N 38th St Omaha, NE | 4.0 | 1.5 | 1472 | $1,995 | $1.36 | 24d | 1 | 1.27mi |
| 140 N 41st St Omaha, NE | 3.0 | 2.5 | 1640 | $2,495 | $1.52 | 44d | 1 | 1.28mi |
| 3204 N 56th St Omaha, NE | 3.0 | 2.0 | 1800 | $1,700 | $0.94 | 11d | 1 | 1.30mi |
| 120 N 40th St Omaha, NE | 3.0 | 1.0 | 1264 | $1,745 | $1.38 | 24d | 1 | 1.30mi |
| 110 N 38th St Unit 110 Omaha, NE | 3.0 | 2.0 | 1600 | $1,750 | $1.09 | 24d | 1 | 1.38mi |
| 132 N 35th Ave Omaha, NE | 5.0 | 2.0 | 1959 | $2,550 | $1.30 | 44d | 1 | 1.40mi |
| 2817 N 60th St Unit 2821/02 Omaha, NE | 3.0 | 1.0 | 1188 | $1,045 | $0.88 | 24d | 1 | 1.43mi |
| 2817 N 60th St Unit 2817/02 Omaha, NE | 3.0 | 1.0 | 1188 | $1,500 | $1.26 | 3d | 1 | 1.44mi |
| 4623 Douglas St Omaha, NE | 3.0 | 2.0 | 1510 | $1,750 | $1.16 | 22d | 1 | 1.44mi |
| 106 S 36th St Omaha, NE | 3.0 | 3.0 | 1750 | $2,275 | $1.30 | 3d | 1 | 1.47mi |
| 3919 Farnam St Unit 3915 Farnam Omaha, NE | 4.0 | 2.0 | 1700 | $2,350 | $1.38 | 44d | 1 | 1.50mi |
Listing history 15 events
-
2026-05-22$198,500 New
-
2026-02-05historical
-
2025-12-29status Back On Market
-
2025-12-15status Pending
-
2025-12-05$198,500 New
-
2025-02-25soldstatus $140,000
-
2025-02-06historical
-
2025-02-04$115,000 New
-
2020-09-28soldstatus $105,000
-
2020-09-26soldstatus $57,000 Sold
-
2020-09-16status Pending
-
2020-08-12$65,000 Active - New
-
2008-12-18soldstatus $30,000
-
2008-12-12historical
-
2008-11-07$35,000
ⓘ Source: listings_history table (triggers on properties + properties_extension) + one-shot
backfill from property_details.listing_events for pre-trigger history.
Tax reassessment forecast NE · Resets to sale price
- Current annual tax
- $1,388 · $116/mo
- Projected year-2 tax
- $3,434 · $286/mo
- Expected delta
- +$2,046/yr (+$171/mo · 147.4%)
ⓘ Screening estimate from a state-policy table — verify with the county assessor before closing.
Climate risk First Street
- Flood 1/10 Low FEMA zone X (unshaded) · 0% chance over 30 yrs
- Wildfire 1/10 Low
- Heat 3/10 Moderate 7 d/yr ≥104°F today · 15 d/yr by 30 yrs out
- Wind 2/10 Low
- Air quality 2/10 Low 0 unhealthy d/yr today · 1 by 30 yrs out
Nearby sold comps map
Loading sold comps map…
Walkable amenities ~0.75 mi
Loading nearby amenities…
Taxation est. · year 1
- Rental income
- $22,635
- − Mortgage interest
- −$11,119
- − Property taxes
- −$1,388
- − Insurance
- −$992
- − Repairs & maintenance
- −$1,811
- − Management
- −$1,811
- − Depreciation
- −$5,775
- Taxable loss
- −$260
- Est. tax savings @ 24.0%
- +$63
- After-tax cash flow
- $3,072/yr
For passive investors: Depreciation is non-cash, so a rental often shows a tax loss while cash-flowing — sheltering income. Rental losses are passive: they offset passive income freely, and up to $25,000/yr can offset ordinary (W-2) income if you actively participate and your MAGI is under $100k (phasing out to $0 by $150k); unused losses carry forward. On sale, claimed depreciation is recaptured at up to 25%, and gains may owe capital-gains tax (a 1031 exchange can defer both). Figures are a year-1 estimate at your 24.0% rate — not tax advice; consult a CPA.
Schools (NCES district)
- District
- Omaha Public Schools
- NCES district ID
- 3174820
- Math proficiency
- 20% ▼ -10.00%
- Reading proficiency
- 28% ▼ -5.00%
- Median HH income
- $46,039
- Composite
- 20.83/100
- National rank
- #8502
- State rank
- #110 of 111 in NE
Livability — Omaha
- Score
- 84/100
- State rank
- #7
- US rank
- #663
Category grades
Schools grade is shown separately in the Schools card above.
Census & demographics
- Census place
- Omaha, NE
- County
- Douglas County · 538,646 people
- City population
- 552,986
- Metro
- Omaha-Council Bluffs, NE-IA
- Population (ZIP)
- 24,210
- Household income
- $42,185
- Rent vs Own
- Severe rent burden
- 1913.0
Population outlook (Douglas County) Hauer SSP2
- Today (2025)
- 625,245 people
- By 2030
- 661,613 · +5.8%
- By 2040
- 732,395 · +17.1%
- By 2050
- 801,988 · +28.3%
- By 2075
- 968,637 · +54.9%
- By 2100
- 1,101,871 · +76.2%
Race, ethnicity, and origin ACS 2023
- Neighborhood character
- Diverse neighborhood (Simpson 0.65)
- Race & ethnicity
- Black 52% Hispanic / Latino 21% White 17% Two or more races 15% Asian 3% Native American 1%
- Hispanic origin (detail)
- Mexican 14%
- Common ancestry
- Ukrainian 3% Lithuanian 0%
- Foreign-born
- 14% · Canada, Philippines
- Languages at home
- 75% English-only · Spanish 16% Other Asian/Pacific 3% French/Haitian/Cajun 1%
Political lean MEDSL · Douglas
- 2024 margin
- D (+10.2) · D 54.4% · R 44.2% · Other 1.4%
- 2008→2024 swing
- +5.5pp toward D · 2008: 4.6pp · 2024: 10.2pp
- All cycles
- 2024: D+10.2 2020: D+11.3 2016: D+1.4 2012: R+4.3 2008: D+4.6
Not yet ingested
- Civics
- —
Market trends
- HPI YoY
- ▲ 13.82%
- Current HPI
- 358.7174
- Rent YoY
- ▲ 3.22%
- Metro
- Omaha-Council Bluffs, NE-IA
- State GDP YoY
- ▲ 0.68%
- F500 in state
- 2
Industry mix (Fortune 500 HQ in NE)
| Industry | F500 HQs | Revenue |
|---|---|---|
| Conglomerate | 1 | $371B |
|
||
Price history
+467.1% since first listed15 events — show timeline
- 2026-05-22 Listed $198,500 GPRMLS
- 2026-02-05 Listing Removed — GPRMLS
- 2025-12-29 Relisted — GPRMLS
- 2025-12-15 Pending — GPRMLS
- 2025-12-05 Listed $198,500 GPRMLS
- 2025-02-25 Sold (Public Records) $140,000 Public Records
- 2025-02-06 Listing Removed — GPRMLS
- 2025-02-04 Listed $115,000 GPRMLS
- 2020-09-28 Sold (Public Records) $105,000 Public Records
- 2020-09-26 Sold (MLS) $57,000 GPRMLS
- 2020-09-16 Pending — GPRMLS
- 2020-08-12 Listed $65,000 GPRMLS
- 2008-12-18 Sold (MLS) $30,000 GPRMLS
- 2008-12-12 Listing Removed — GPRMLS
- 2008-11-07 Listed $35,000 GPRMLS
Property tax history
-0.4%/yrLatest (2025): $1,388 · +2.2% YoY. Source: county tax records.
Cash-flow waterfall
monthlySold comps — $/sqft
last 12 mo · ≤1 miLoading sold comps…