 Triplex
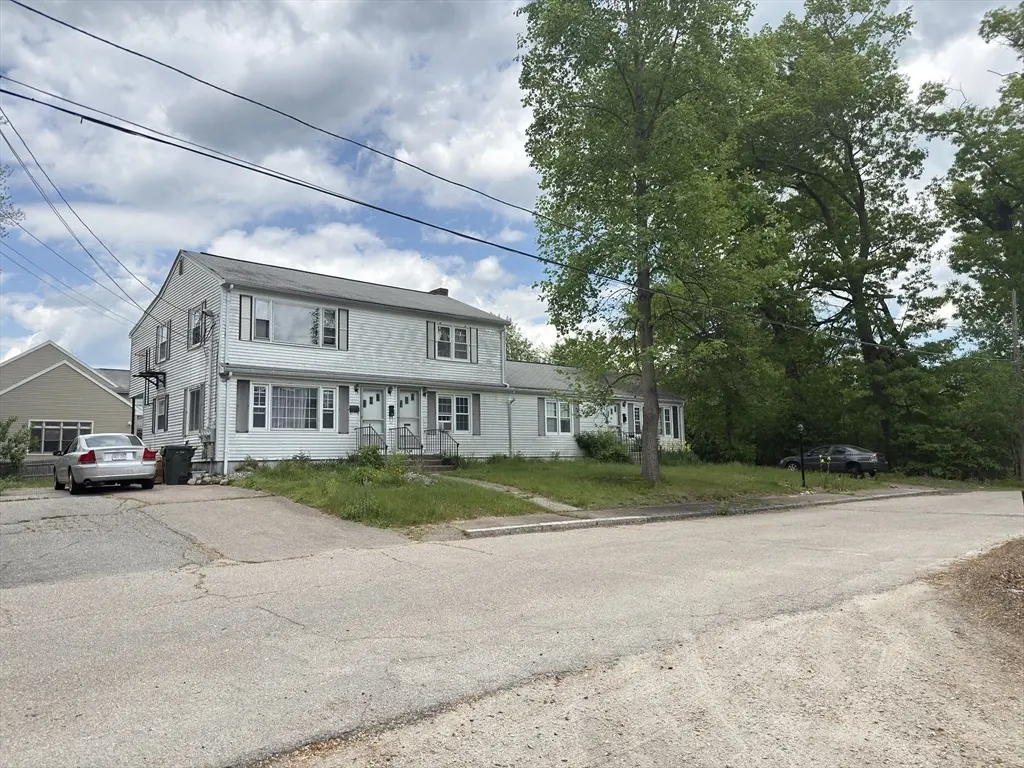
103 Norfolk St · Woonsocket, RI
Flood risk 1/10 · Minimal
- FEMA flood zone
- X (unshaded)
- Chance of flooding over 30 yrs
- 0.0%
- Est. flood insurance / yr
- $473 – $860
Fire risk 3/10 · Minor
- Est. fire insurance / yr
- $915 – $1,699
Heat risk 5/10 · Moderate
- Hot days now (above 95°F)
- 7 days/yr
- Hot days in 30 yrs
- 15 days/yr
Wind risk 6/10 · Moderate
- Chance of severe wind over 30 yrs
- 64.0%
Air-quality risk 2/10 · Minimal
- Unhealthy air days now
- 1 days/yr
- Unhealthy air days in 30 yrs
- 2 days/yr
Risk factors via First Street. Map © Google.
Why this score? — see what drove the B- grade
The composite is a weighted blend of 9 inputs, each scored 0–100. Each bar is that input's sub-score; the figure is the points it added to the 100-point composite (weight × sub-score).
- Cash flow +26.8/30.0
- ARV discount +12.5/15.0
- DSCR +9.2/10.0
- 1% rule +6.6/10.0
- Schools +3.4/10.0
- Livability +3.2/5.0
- Rent growth +3.1/5.0
- Condition / age +2.5/5.0
- Appreciation +0.0/10.0
$499,999
🖨 Deal sheet 📄 Offer letter ✓ Due diligence
Multi-family units
County records classify this as Multi-Family (2-4 Unit). Listing-text estimate: 3 units. confirmed
Listing remarks MLS
GREAT OPPORTUNITY TO OWN THIS CHARMING 3 IDENTICAL 4 ROOM UNITS LOCATED ON DEAD END STREET FEATURING HARDWD FLOORS ALL LARGE ROOM 1/4 ACRE LOT PAVED DRIVEWAY MOVE IN CONDITION LIVE IN ONE AND COLLECT RENT FROM 2 OTHER AND RELAX AND
Key facts
- 0.23 acre lot
- 6 parking spots
- Built 1960
Property features AI
Exterior
- Parking: 6 parking spaces; Open parking
- Utilities: Public water; Public sewer
- Home design: 3-family property; 4 total stories
- Construction: Frame construction; Block foundation; Built approximately (public records)
- Exterior features: Shingle roof; White exterior color; Paved driveway and paved off-street parking
Interior
- Bathrooms: 3 full bathrooms
- Interior features: 13 total rooms; Full basement
Neighborhood map
What this means for you Summary
Snapshot
- This is a 3 × 2-bed/1.0-bath units multifamily listed at $500k.
Deal economics
- At list price, monthly cash flow is $1k ($16k/yr) — positive. Per door: $454/mo.
- The deal already cash-flows at list — no discount required.
- Meets the 1% rule at list price ($6k rent vs $500k).
- Recommended offer: $492k (1.5% below list) — sets the bar for market timing.
- Cap rate 9.6% vs local median 3.3% in Woonsocket — top-decile yield for the area; either an underpriced asset or a hidden risk that comps aren't pricing in. Stress-test before assuming the spread holds.
Location & tenants
- Location reads 65/100 on livability (#24 in RI) — a middle-class / working-renter tenant base. Strengths: housing A+, health & safety A+, cost of living A; Watch: crime C-, schools D-, amenities F.
- Bellingham (suburban): math 30% / reading 42% proficiency, ranked #209 of 302 in MA (top 69%) — families likely to look elsewhere, expect single-tenant / working-renter base with shorter leases; only 18% free/reduced lunch — higher-income household profile.
- Market conditions: Rents rising (+2.5%/yr); 2 comparable units currently listed for rent nearby; high-income renter base; 958 units permitted in Norfolk County in 2024 (305 in 5+ unit buildings).
- At $5,816/mo this rent would consume 56% of the median local household income ($125k/yr) (locally 455% of renters already pay >50% of income on rent) — very limited rent-growth headroom before tenants either downsize or default.
Forward outlook
- Local home prices are declining (-3.0%/yr); year-one equity from $3k of loan paydown is wiped out by about $15k of value loss. Plan a longer hold.
- Norfolk County population projected at +10% by 2050 — modest demand growth; plan on rents tracking national, not racing it.
Negotiation context
- It's been on market 27 days — a 2% lower offer ($492k) is reasonable based on typical stale-listing flexibility.
- 3 sale attempts since 28y ago with the ask held roughly flat each time — persistent listings suggest the price (not the market) is what's stuck; bring a comps-based counter.
- Current owner paid $189k; list at $500k implies a 165% gain — meaningful room to come down on a strong offer.
Risks & watch-outs
- Climate carrying-cost: major wind risk, 64% chance of damaging wind over 30y; extreme-heat days projected 7→15/yr by 2055 (HVAC capex compounding) — expect insurance premiums to compound above CPI over the hold.
Questions for the listing agent
- Can we see the unit-by-unit rent roll, current vacancy, and any below-market leases? What's the average tenancy length?
- What capital expenditures (roof, boiler, parking lot, exteriors) have been made in the last 5 years, and what's planned in the next 2?
- Built in 1960 — when were the roof, HVAC, electrical panel, plumbing, and water heater last replaced?
- Is there a deadline driving the sale (1031 exchange, divorce, estate, relocation)? That informs how much negotiation room exists.
- Schools are D-rated, which usually means shorter tenancies and higher turnover. Who's the typical renter profile here, and what's been the actual vacancy rate?
- What's the average days-on-market for RENTAL listings here right now (not sales)? A rising rental-DOM trend means longer vacancies and softer asking-rent achievability than the comps imply.
- What's the recent tenant-quality profile in this submarket — average credit score on applications, eviction rate, late-payment / NSF rate, and stable-employment percentage? A property-management company in the area should have these aggregated.
- How much new apartment / multifamily construction is in the pipeline within 1–3 miles? Heavy new supply (>2% of stock underway) typically softens rents 12–24 months out; light construction supports rent growth.
Investment metrics
- 1% rule
- 1.16% ✓
- Cap rate
- 9.56%
- Cash-on-cash
- 11.68%
- DSCR
- 1.52
- GRM
- 7.2
CMA / ARV
- ARV (on-the-fly)
- $561,904
- Comps found
- 3
Show comp detail 3 sales within ~0.75 mi
| Address | Dist | Beds/Ba | Sqft | Sold | Price | $/sf | Match |
|---|---|---|---|---|---|---|---|
| 371 Pulaski Blvd | 0.45mi | 5/2.5 (-1) | 2,755 (-0%) | 15mo | $579,000 | $210 | 58 |
| 183 Linden Ave | 0.72mi | 6/2.5 | 2,952 (+7%) | 10mo | $600,000 | $203 | 45 |
| 494 Wood Ave | 0.60mi | 5/2.0 (-1) | 2,918 (+5%) | 12mo | $465,000 | $159 | 44 |
Match score weights: distance 35% · size 25% · config 20% · recency 20%. Top-matched comps best support the ARV.
Projected returns pro-forma
-3.0% appreciation · 2.45% rent growth · sell at horizon
- IRR
- 0.5%
- Equity multiple
- 1.02×
- Total profit
- $2,528
- Equity at exit
- $74,551
- IRR
- 9.6%
- Equity multiple
- 1.72×
- Total profit
- $100,778
- Equity at exit
- $43,231
Cash invested: $140,000 (down + closing). Projections, not guarantees.
Landlord ↔ Tenant lean methodology
- Overall (STATE)
- 31 Tenant-Leaning
- State Rhode Island
- 31 Tenant-Leaning · D+8
- County
- — inherits STATE
- City
- — inherits STATE
ZIP-level market 02019
- Rents YoY
- 2.5%
- Price-to-rent
- 21.5×
Monthly cashflow live
- Estimated rent
- $5,816 high interval (Pro) →
- Mortgage (P&I)
- −$2,622
- Tax from tax record
- −$401 /mo · $4,817/yr
- Insurance
- −$208
- HOA
- −$0
- Vacancy / Maint / Mgmt
- −$1,221
- Net cashflow
- $1,363
Break-even live
3-unit breakdown (identical units grouped — click to expand)
| Units | Beds | Baths | Est. rent |
|---|---|---|---|
| 3× units | 2 | 1 | $5,817 |
| #1 | 2 | 1 | $1,939 |
| #2 | 2 | 1 | $1,939 |
| #3 | 2 | 1 | $1,939 |
| Total (3 units) | $5,816 | ||
UW: 25.0% down · 7.5% · 30yr · 1.5% tax · 5.0% vac · 8.0% maint · 8.0% mgmt
Financing live
Cash to close
- Down payment
- $125,000
- Closing costs
- $15,000
- Reserves months
- —
- Total cash needed
- —
Loan-product check · same deal, 3 products live
Conventional
25% down · 7.5% · 30yr
- Down + closing
- —
- Monthly P&I
- —
- Monthly cashflow
- —
- DSCR
- —
- Eligible?
- —
Personal DTI + credit; lowest rate.
DSCR
20% down · 8.5% · 30yr
- Down + closing
- —
- Monthly P&I
- —
- Monthly cashflow
- —
- DSCR
- —
- Eligible?
- —
No personal income docs; deal must DSCR.
Hard money
10% down · 12.0% · 12mo
- Down + closing
- —
- Monthly P&I
- —
- Monthly cashflow
- —
- DSCR
- —
- Eligible?
- —
Short-term bridge; refi at stabilization.
Rent comps 2 comps
| Address | Beds | Baths | Sqft | Rent | $/sqft | DOM | Units | Dist |
|---|---|---|---|---|---|---|---|---|
| 47 Chester St Unit 3 Woonsocket, RI | 5.0 | 2.0 | 2000 | $2,200 | $1.10 | 43d | 1 | 0.69mi |
| 335 Blackstone St Woonsocket, RI | 6.0 | 2.0 | 2400 | $2,900 | $1.21 | 1d | 1 | 1.44mi |
Listing history 19 events
-
2026-06-17days on market $499,999 Active 27 DOM
-
2026-06-16days on market $499,999 Active 26 DOM
-
2026-06-15days on market $499,999 Active 25 DOM
-
2026-06-13days on market $499,999 Active 23 DOM
-
2026-06-09days on market $499,999 Active 19 DOM
-
2026-06-08days on market $499,999 Active 18 DOM
-
2026-06-07days on market $499,999 Active 17 DOM
-
2026-06-04days on market $499,999 Active 14 DOM
-
2026-06-03days on market $499,999 Active 13 DOM
-
2026-06-02days on market $499,999 Active 12 DOM
-
2026-06-01days on market $499,999 Active 11 DOM
-
2026-05-31days on market $499,999 Active 10 DOM
-
2026-05-21$499,999 New
-
1998-07-01soldstatus $189,000 231-char remark
Show marketing remark (231 chars)
GREAT OPPORTUNITY TO OWN THIS CHARMING 3 IDENTICAL 4 ROOM UNITS LOCATED ON DEAD END STREET FEATURING HARDWD FLOORS ALL LARGE ROOM 1/4 ACRE LOT PAVED DRIVEWAY MOVE IN CONDITION LIVE IN ONE AND COLLECT RENT FROM 2 OTHER AND RELAX AND
-
1998-06-30historical 231-char remark
Show marketing remark (231 chars)
GREAT OPPORTUNITY TO OWN THIS CHARMING 3 IDENTICAL 4 ROOM UNITS LOCATED ON DEAD END STREET FEATURING HARDWD FLOORS ALL LARGE ROOM 1/4 ACRE LOT PAVED DRIVEWAY MOVE IN CONDITION LIVE IN ONE AND COLLECT RENT FROM 2 OTHER AND RELAX AND
-
1998-06-15soldstatus $175,500
-
1998-06-15soldstatus $175,500
-
1998-04-06$189,000 231-char remark
Show marketing remark (231 chars)
GREAT OPPORTUNITY TO OWN THIS CHARMING 3 IDENTICAL 4 ROOM UNITS LOCATED ON DEAD END STREET FEATURING HARDWD FLOORS ALL LARGE ROOM 1/4 ACRE LOT PAVED DRIVEWAY MOVE IN CONDITION LIVE IN ONE AND COLLECT RENT FROM 2 OTHER AND RELAX AND
-
1998-04-06$189,000
Show marketing remark (231 chars)
GREAT OPPORTUNITY TO OWN THIS CHARMING 3 IDENTICAL 4 ROOM UNITS LOCATED ON DEAD END STREET FEATURING HARDWD FLOORS ALL LARGE ROOM 1/4 ACRE LOT PAVED DRIVEWAY MOVE IN CONDITION LIVE IN ONE AND COLLECT RENT FROM 2 OTHER AND RELAX AND
ⓘ Source: listings_history table (triggers on properties + properties_extension) + one-shot
backfill from property_details.listing_events for pre-trigger history.
Tax reassessment forecast RI · Partial reset (capped growth)
- Current annual tax
- $4,817 · $401/mo
- Projected year-2 tax
- $6,483 · $540/mo
- Expected delta
- +$1,666/yr (+$139/mo · 34.6%)
ⓘ Screening estimate from a state-policy table — verify with the county assessor before closing.
Climate risk First Street
- Flood 1/10 Low FEMA zone X (unshaded) · 0% chance over 30 yrs
- Wildfire 3/10 Moderate
- Heat 5/10 Major 7 d/yr ≥95°F today · 15 d/yr by 30 yrs out
- Wind 6/10 Major 64% chance of damaging wind over 30 yrs
- Air quality 2/10 Low 1 unhealthy d/yr today · 2 by 30 yrs out
Nearby sold comps map
Loading sold comps map…
Walkable amenities ~0.75 mi
Loading nearby amenities…
Taxation est. · year 1
- Rental income
- $69,792
- − Mortgage interest
- −$28,008
- − Property taxes
- −$4,817
- − Insurance
- −$2,500
- − Repairs & maintenance
- −$5,583
- − Management
- −$5,583
- − Depreciation
- −$14,545
- Taxable income
- $8,755
- Est. tax owed @ 24.0%
- −$2,101
- After-tax cash flow
- $14,253/yr
For passive investors: Depreciation is non-cash, so a rental often shows a tax loss while cash-flowing — sheltering income. Rental losses are passive: they offset passive income freely, and up to $25,000/yr can offset ordinary (W-2) income if you actively participate and your MAGI is under $100k (phasing out to $0 by $150k); unused losses carry forward. On sale, claimed depreciation is recaptured at up to 25%, and gains may owe capital-gains tax (a 1031 exchange can defer both). Figures are a year-1 estimate at your 24.0% rate — not tax advice; consult a CPA.
Schools (NCES district)
- District
- Bellingham
- NCES district ID
- 2502460
- Math proficiency
- 30% ▼ -14.00%
- Reading proficiency
- 42% ▼ -3.00%
- Median HH income
- $84,813
- Composite
- 34.46/100
- National rank
- #5190
- State rank
- #209 of 302 in MA
Livability — Woonsocket
- Score
- 65/100
- State rank
- #24
- US rank
- #12968
Category grades
Schools grade is shown separately in the Schools card above.
Census & demographics
- County
- Norfolk County
- City population
- 43,521
- Metro
- Boston-Cambridge-Newton, MA-NH
- Population (ZIP)
- 17,410
- Household income
- $125,307
- Rent vs Own
- Severe rent burden
- 455.0
Population outlook (Norfolk County) Hauer SSP2
- Today (2025)
- 737,259 people
- By 2030
- 755,213 · +2.4%
- By 2040
- 786,961 · +6.7%
- By 2050
- 813,019 · +10.3%
- By 2075
- 861,214 · +16.8%
- By 2100
- 845,063 · +14.6%
Race, ethnicity, and origin ACS 2023
- Neighborhood character
- Predominantly White (83%)
- Race & ethnicity
- White 83% Two or more races 11% Hispanic / Latino 5% Asian 1%
- Hispanic origin (detail)
- Salvadoran 2%
- Common ancestry
- Lithuanian 10% Romanian 5% Russian 4%
- Foreign-born
- 6% · Canada
- Languages at home
- 90% English-only · Spanish 3% Other Indo-European 3% French/Haitian/Cajun 1%
Political lean MEDSL · Norfolk
- 2024 margin
- Strong D (+28.8) · D 63.3% · R 34.6% · Other 2.1%
- 2008→2024 swing
- +10.2pp toward D · 2008: 18.5pp · 2024: 28.8pp
- All cycles
- 2024: D+28.8 2020: D+36.3 2016: D+27.9 2012: D+16.1 2008: D+18.5
Not yet ingested
- Civics
- —
Market trends
- HPI YoY
- ▼ -420.85%
- Current HPI
- 279.2925
- Rent YoY
- ▲ 2.45%
- Metro
- Boston-Cambridge-Newton, MA-NH
- State GDP YoY
- ▲ 2.25%
- F500 in state
- 10
Industry mix (Fortune 500 HQ in RI)
| Industry | F500 HQs | Revenue |
|---|---|---|
| Healthcare | 1 | $373B |
|
||
| Food Distribution | 1 | $31B |
|
||
| Aerospace / Defense | 1 | $14B |
|
||
| Financial Services | 1 | $8B |
|
||
| Consumer Goods | 1 | $4B |
|
||
Price history
+164.5% since first listed7 events — show timeline
- 2026-05-21 Listed $499,999 MLS PIN
- 1998-07-01 Sold (MLS) $189,000 MLS PIN
- 1998-06-30 Listing Removed — MLS PIN
- 1998-06-15 Sold (Public Records) $175,500 Public Records
- 1998-06-15 Sold (Public Records) $175,500 Public Records
- 1998-04-06 Listed $189,000 RIS
- 1998-04-06 Listed $189,000 MLS PIN
Property tax history
+2.6%/yrLatest (2023): $4,817 · +7.8% YoY. Source: county tax records.
Cash-flow waterfall
monthlySold comps — $/sqft
last 12 mo · ≤1 miLoading sold comps…