495 Cherry Ln Unit B · Manteca, CA
Flood risk 1/10 · Minimal
- FEMA flood zone
- X (unshaded)
- Chance of flooding over 30 yrs
- 0.0%
- Est. flood insurance / yr
- $507 – $1,088
Fire risk 2/10 · Minimal
- Est. fire insurance / yr
- $659 – $1,223
Heat risk 7/10 · Major
- Hot days now (above 102°F)
- 7 days/yr
- Hot days in 30 yrs
- 15 days/yr
Wind risk 1/10 · Minimal
- Chance of severe wind over 30 yrs
- —
Air-quality risk 10/10 · Severe
- Unhealthy air days now
- 30 days/yr
- Unhealthy air days in 30 yrs
- 31 days/yr
Risk factors via First Street. Map © Google.
Why this score? — see what drove the D grade
The composite is a weighted blend of 9 inputs, each scored 0–100. Each bar is that input's sub-score; the figure is the points it added to the 100-point composite (weight × sub-score).
- ARV discount +15.0/15.0
- Cash flow +7.8/30.0
- 1% rule +6.3/10.0
- Livability +3.1/5.0
- Schools +2.9/10.0
- Rent growth +2.7/5.0
- Condition / age +2.5/5.0
- DSCR +1.9/10.0
- Appreciation +0.0/10.0
$189,900
🖨 Deal sheet (PDF) 📄 Offer letter ✓ Due diligence
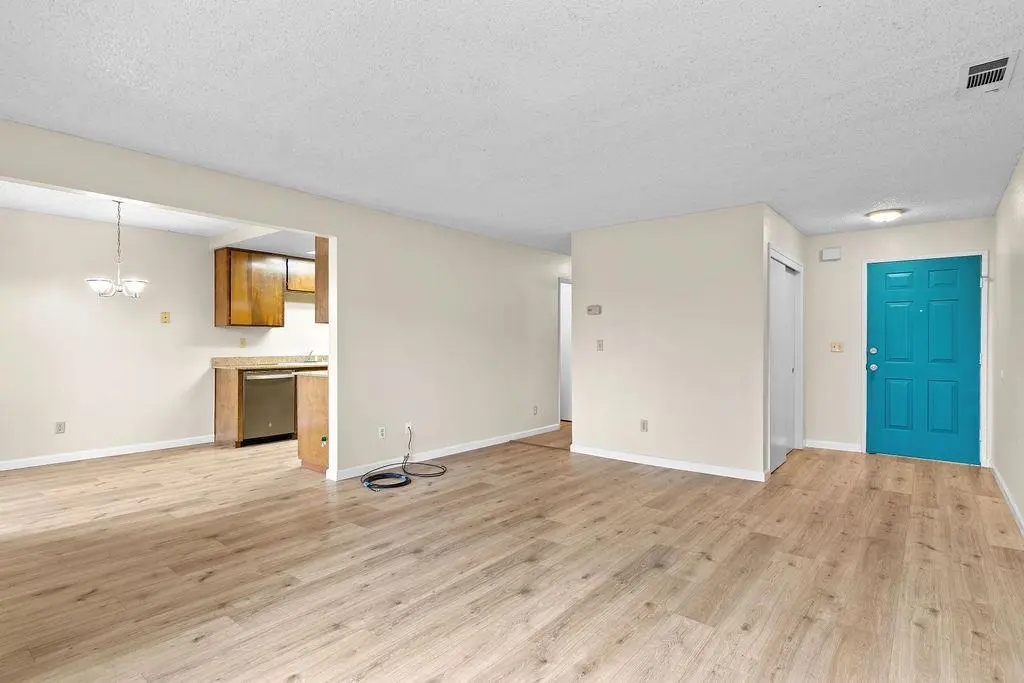
Listing remarks
Welcome HOME to Cherry Lane! This ground floor condo home at 495 Cherry Lane #B, offers 2 bedrooms and 1 bath with just under 1000 square feet of living space. The cozy yet open floor plan provides space to relax and entertain. Enjoy the galley style kitchen featuring updated appliances. This move-in ready home also has new paint, updated flooring in the living areas and a stackable washer & dryer, included. Outside, a private patio offers a delightful setting for relaxation and contemplation. Or head over to the community pool and hot tub and get to know your neighbors. Centrally located with parks, schools, shopping and freeway access, all nearby.
Key facts
- Updated appliances
- Ground floor condo
- Hot tub
Tags
Neighborhood map
What this means for you Summary
Snapshot
- This is a 2-bed/1.0-bath condo listed at $190k.
Deal economics
- At list price, monthly cash flow is $-210 ($-3k/yr) — negative.
- To cash-flow at today's rent, offer at most $153k (19.5% below list).
- Meets the 1% rule at list price ($2k rent vs $190k).
- Recommended offer: $153k (19.5% below list) — sets the bar for cash-flow.
- Cap rate 5.0% vs local median 2.7% in Manteca — top-decile yield for the area; either an underpriced asset or a hidden risk that comps aren't pricing in. Stress-test before assuming the spread holds.
Location & tenants
- Location reads 61/100 on livability (#535 in CA) — a middle-class / working-renter tenant base. Strengths: housing A+, employment A; Watch: amenities D, commute F, cost of living F.
- Manteca Unified (suburban): math 15% / reading 48% proficiency, ranked #297 of 517 in CA (top 57%) — families likely to look elsewhere, expect single-tenant / working-renter base with shorter leases.
- Zoned schools: Stella Brockman Elementary (717 students, 49% FRL); Manteca High (math 13% / reading 50%, grade F, #696 of 1,170 statewide, top 60%, 1,811 students, 57% FRL) — zoned schools at 53% FRL track the district average.
- Market conditions: Rents flat; 388 active listings in the ZIP; 27 comparable units currently listed for rent nearby; rentals at typical pace (median 16d on market — plan ~3-4 weeks tenant-placement turnaround); high-income renter base; 3,779 units permitted in San Joaquin County in 2024 (0 in 5+ unit buildings).
Forward outlook
- Local home prices are declining (-3.0%/yr); year-one equity from $1k of loan paydown is wiped out by about $6k of value loss. Plan a longer hold.
- San Joaquin County population projected at +17% by 2050 — long-run rental-demand tailwind backs the buy-and-hold thesis.
Negotiation context
- It's been on market 122 days — a 12% lower offer ($167k) is reasonable based on typical stale-listing flexibility.
Risks & watch-outs
- Watch-outs: HOA is 35% of rent.
- Climate carrying-cost: extreme-heat days projected 7→15/yr by 2055 (HVAC capex compounding) — expect insurance premiums to compound above CPI over the hold.
Questions for the listing agent
- What do current leases actually rent for vs. the listed asking? Can we see a recent rent roll and the last 12 months of T-12 income?
- It's been on market 122 days. Have you received any prior offers? Is the seller open to a 20% concession, seller financing, or rate buy-down credit?
- What does the HOA fee cover, when was the last increase, and are there any pending special assessments or reserve-fund shortfalls?
- Any open or pending special assessments — roof, HVAC, plumbing, elevator, façade? What's the per-unit balance and payoff schedule, and is the seller paying it off at close or rolling it to the buyer?
- Why hasn't it sold? Are there any deal-killer items the seller is aware of (foundation, flood, title, zoning, code violations)?
- Is there a deadline driving the sale (1031 exchange, divorce, estate, relocation)? That informs how much negotiation room exists.
- Schools are D-rated, which usually means shorter tenancies and higher turnover. Who's the typical renter profile here, and what's been the actual vacancy rate?
- The area grade is low — what's the realistic commute time and amenity access for the typical tenant pool here? Any planned neighborhood developments (good or bad) we should know about?
- What's the average days-on-market for RENTAL listings here right now (not sales)? A rising rental-DOM trend means longer vacancies and softer asking-rent achievability than the comps imply.
- What's the recent tenant-quality profile in this submarket — average credit score on applications, eviction rate, late-payment / NSF rate, and stable-employment percentage? A property-management company in the area should have these aggregated.
- How much new apartment / multifamily construction is in the pipeline within 1–3 miles? Heavy new supply (>2% of stock underway) typically softens rents 12–24 months out; light construction supports rent growth.
Investment metrics
- 1% rule
- 1.13% ✓
- Cap rate
- 4.97%
- Cash-on-cash
- -4.73%
- DSCR
- 0.79
- GRM
- 7.4
CMA / ARV
- ARV (median comp)
- $234,178
- List price
- $189,900
- Delta
- -18.91%
- Verdict
- UNDERPRICED
- Comps
- 20 within 1.0 mi
Projected returns pro-forma
-3.0% appreciation · 0.82% rent growth · sell at horizon
- IRR
- -27.8%
- Equity multiple
- 0.09×
- Total profit
- $-48,322
- Equity at exit
- $28,315
- IRR
- -44.2%
- Equity multiple
- -0.42×
- Total profit
- $-75,706
- Equity at exit
- $16,419
Cash invested: $53,172 (down + closing). Projections, not guarantees.
Landlord ↔ Tenant lean methodology
- Overall (STATE)
- 18 Strongly Tenant-Friendly
- State California
- 18 Strongly Tenant-Friendly · D+13
- County
- — inherits STATE
- City
- — inherits STATE
ZIP-level market 95337
- Rents YoY
- 0.8%
- Active inventory
- 388
- Price-to-rent
- 7.4×
Monthly cashflow live
- Estimated rent
- $2,138 high interval (Pro) →
- Mortgage (P&I)
- −$996
- Tax from tax record
- −$72 /mo · $864/yr
- Insurance
- −$79
- HOA
- −$752
- Vacancy / Maint / Mgmt
- −$449
- Net cashflow
- $-210
Break-even live
Sensitivity live
| Price | -10% $-102 | -5% $-156 | +0% $-210 | +5% $-263 | +10% $-317 |
|---|---|---|---|---|---|
| Rent | -10% $-379 | -5% $-294 | +0% $-210 | +5% $-125 | +10% $-41 |
| Rate | -1.0pp $-114 | -0.5pp $-161 | base $-210 | +0.5pp $-259 | +1.0pp $-309 |
UW: 25.0% down · 7.5% · 30yr · 1.5% tax · 5.0% vac · 8.0% maint · 8.0% mgmt
Financing live
Cash to close
- Down payment
- $47,475
- Closing costs
- $5,697
- Reserves months
- —
- Total cash needed
- —
Loan-product check · same deal, 3 products live
Conventional
25% down · 7.5% · 30yr
- Down + closing
- —
- Monthly P&I
- —
- Monthly cashflow
- —
- DSCR
- —
- Eligible?
- —
Personal DTI + credit; lowest rate.
DSCR
20% down · 8.5% · 30yr
- Down + closing
- —
- Monthly P&I
- —
- Monthly cashflow
- —
- DSCR
- —
- Eligible?
- —
No personal income docs; deal must DSCR.
Hard money
10% down · 12.0% · 12mo
- Down + closing
- —
- Monthly P&I
- —
- Monthly cashflow
- —
- DSCR
- —
- Eligible?
- —
Short-term bridge; refi at stabilization.
Rent comps 27 comps
| Address | Beds | Baths | Sqft | Rent | $/sqft | DOM | Units | Dist |
|---|---|---|---|---|---|---|---|---|
| 350 N Union Rd Manteca, CA | 2.0 | 1.0 | 701 | $2,200 | $3.14 | 5d | 3 | 0.12mi |
| 367 N Union Rd Manteca, CA | 2.0 | 1.0 | 950 | $1,975 | $2.08 | 13d | 3 | 0.12mi |
| 426 Cherry Ln Manteca, CA | 2.0 | 1.0 | 941 | $2,100 | $2.23 | 5d | 1 | 0.15mi |
| 1155 W Center St Manteca, CA | 1.0–2.0 | 1.0–1.5 | 770 | $2,249 | $2.92 | 4d | 11 | 0.29mi |
| 1451 W Center St Manteca, CA | 1.0–2.0 | 1.0–2.0 | 807 | $2,090 | $2.59 | 4d | 16 | 0.37mi |
| 207 S Union Rd Manteca, CA | 1.0 | 1.0 | 600 | $1,745 | $2.91 | 12d | 1 | 0.57mi |
| 222 Elm Ave Unit B Manteca, CA | 2.0 | 1.0 | 750 | $1,700 | $2.27 | 20d | 1 | 0.73mi |
| 832 Marion St Unit A Manteca, CA | 2.0 | 2.0 | 836 | $2,100 | $2.51 | 45d | 1 | 0.74mi |
| 809 Marion St Manteca, CA | 3.0 | 2.0 | 910 | $2,400 | $2.64 | 45d | 1 | 0.75mi |
| 218 W Alameda St Manteca, CA | 3.0 | 2.0 | 1000 | $2,450 | $2.45 | 13d | 1 | 0.92mi |
| 420 N Maple Ave Unit 13 Manteca, CA | 1.0 | 1.0 | 600 | $1,395 | $2.33 | 25d | 1 | 0.95mi |
| 139 W Yosemite Ave Unit 1 Manteca, CA | 2.0 | 1.0 | 948 | $1,650 | $1.74 | 4d | 1 | 1.06mi |
| 1405 Stonewood Ave Manteca, CA | 2.0 | 2.0 | 890 | $1,845 | $2.07 | 45d | 1 | 1.11mi |
| 221 E Edison St Unit 2 Manteca, CA | 1.0 | 1.0 | 600 | $1,475 | $2.46 | 5d | 1 | 1.12mi |
| 221 E Edison St Unit 8 Manteca, CA | 1.0 | 1.0 | 600 | $1,475 | $2.46 | 16d | 1 | 1.12mi |
| 529 N Lincoln Ave Manteca, CA | 2.0 | 1.0 | 734 | $1,900 | $2.59 | 45d | 1 | 1.14mi |
| 405 Eastwood Ave Manteca, CA | 2.0 | 2.0 | 926 | $1,925 | $2.08 | 45d | 1 | 1.16mi |
| 556 N Lincoln Ave Unit 12 Manteca, CA | 1.0 | 1.0 | 600 | $1,400 | $2.33 | 45d | 1 | 1.16mi |
| 556 N Lincoln Ave Unit 15 Manteca, CA | 2.0 | 1.0 | 900 | $1,895 | $2.11 | 45d | 1 | 1.16mi |
| 556 N Lincoln Ave Unit 32 Manteca, CA | 1.0 | 1.0 | 850 | $1,495 | $1.76 | 16d | 1 | 1.16mi |
| 134 Oak St Manteca, CA | 3.0 | 1.0 | 1007 | $3,045 | $3.02 | 45d | 1 | 1.18mi |
| 470 Northgate Dr Manteca, CA | 2.0 | 1.0 | 1000 | $1,760 | $1.76 | 4d | 1 | 1.20mi |
| 366 E Edison St Unit 12 Manteca, CA | 2.0 | 1.0 | 750 | $1,595 | $2.13 | 5d | 1 | 1.24mi |
| 430 Sutter St Manteca, CA | 2.0 | 1.0 | 804 | $1,922 | $2.39 | 4d | 3 | 1.29mi |
| 198 Northgate Dr Manteca, CA | 2.0 | 1.0–2.0 | 840 | $1,932 | $2.30 | 4d | 5 | 1.29mi |
| 1342 Santini Ave Manteca, CA | 1.0 | 1.0 | 550 | $1,100 | $2.00 | 16d | 1 | 1.32mi |
| 225 N Fremont St Manteca, CA | 2.0 | 2.0 | 926 | $1,875 | $2.02 | 45d | 1 | 1.38mi |
HOA detail condo
- Monthly dues
- $752 · $9,024/yr
- Likely covers
- pool
- Assessments
- None detected in remarks — confirm with the listing agent.
Listing history 16 events
-
2026-06-21days on market $189,900 Active 122 DOM
-
2026-06-18days on market $189,900 Active 119 DOM
-
2026-06-17days on market $189,900 Active 118 DOM
-
2026-06-16days on market $189,900 Active 117 DOM
-
2026-06-15days on market $189,900 Active 116 DOM
-
2026-06-14days on market $189,900 Active 114 DOM
-
2026-06-13days on market $189,900 Active 113 DOM
-
2026-06-10days on market $189,900 Active 111 DOM
-
2026-06-09days on market $189,900 Active 110 DOM
-
2026-06-08days on market $189,900 Active 109 DOM
-
2026-06-07days on market $189,900 Active 108 DOM
-
2026-06-05days on market $189,900 Active 105 DOM
-
2026-06-03days on market $189,900 Active 104 DOM
-
2026-06-03days on market $189,900 Active 103 DOM
-
2026-06-01days on market $189,900 Active 102 DOM
-
2026-05-31days on market $189,900 Active 101 DOM
ⓘ Source: listings_history table (triggers on properties + properties_extension) + one-shot
backfill from property_details.listing_events for pre-trigger history.
Tax reassessment forecast CA · Resets to sale price
- Current annual tax
- $864 · $72/mo
- Projected year-2 tax
- $1,443 · $120/mo
- Expected delta
- +$579/yr (+$48/mo · 67.0%)
ⓘ Screening estimate from a state-policy table — verify with the county assessor before closing.
Climate risk First Street
- Flood 1/10 Low FEMA zone X (unshaded) · 0% chance over 30 yrs
- Wildfire 2/10 Low
- Heat 7/10 Severe 7 d/yr ≥102°F today · 15 d/yr by 30 yrs out
- Wind 1/10 Low
- Air quality 10/10 Extreme 30 unhealthy d/yr today · 31 by 30 yrs out
Nearby sold comps map
Loading sold comps map…
Walkable amenities ~0.75 mi
Loading nearby amenities…
Taxation est. · year 1
- Rental income
- $25,661
- − Mortgage interest
- −$10,637
- − Property taxes
- −$864
- − Insurance
- −$950
- − Repairs & maintenance
- −$2,053
- − Management
- −$2,053
- − HOA
- −$9,024
- − Depreciation
- −$5,524
- Taxable loss
- −$5,444
- Est. tax savings @ 24.0%
- +$1,307
- After-tax cash flow
- $-1,209/yr
For passive investors: Depreciation is non-cash, so a rental often shows a tax loss while cash-flowing — sheltering income. Rental losses are passive: they offset passive income freely, and up to $25,000/yr can offset ordinary (W-2) income if you actively participate and your MAGI is under $100k (phasing out to $0 by $150k); unused losses carry forward. On sale, claimed depreciation is recaptured at up to 25%, and gains may owe capital-gains tax (a 1031 exchange can defer both). Figures are a year-1 estimate at your 24.0% rate — not tax advice; consult a CPA.
Schools (NCES district)
- District
- Manteca Unified
- NCES district ID
- 0623610
- Math proficiency
- 15% ▼ -14.00%
- Reading proficiency
- 48% ▬ 0.00%
- Median HH income
- $62,426
- Composite
- 28.5/100
- National rank
- #6737
- State rank
- #297 of 517 in CA
Livability — Manteca
- Score
- 61/100
- State rank
- #535
- US rank
- #17877
Category grades
Schools grade is shown separately in the Schools card above.
Census & demographics
- Census place
- Manteca, CA
- County
- San Joaquin County · 729,570 people
- City population
- 98,916
- Metro
- Stockton, CA
- Population (ZIP)
- 48,731
- Household income
- $117,137
- Rent vs Own
- Severe rent burden
- 880.0
Population outlook (San Joaquin County) Hauer SSP2
- Today (2025)
- 796,965 people
- By 2030
- 828,849 · +4.0%
- By 2040
- 885,611 · +11.1%
- By 2050
- 929,798 · +16.7%
- By 2075
- 994,578 · +24.8%
- By 2100
- 971,291 · +21.9%
Race, ethnicity, and origin ACS 2023
- Neighborhood character
- Highly diverse neighborhood (Simpson 0.73)
- Race & ethnicity
- Hispanic / Latino 38% White 29% Two or more races 23% Asian 21% Black 4% Pacific Islander 2%
- Hispanic origin (detail)
- Mexican 32%
- Common ancestry
- Russian 4% Italian 2% Lithuanian 1%
- Foreign-born
- 25% · Canada, China
- Languages at home
- 61% English-only · Spanish 18% Other Indo-European 11% Tagalog/Filipino 4%
Political lean MEDSL · San Joaquin
- 2024 margin
- Toss-up / Even · D 48.0% · R 48.9% · Other 3.0%
- 2008→2024 swing
- -11.6pp toward R · 2008: 10.7pp · 2024: -0.9pp
- All cycles
- 2024: R+0.9 2020: D+13.9 2016: D+12.9 2012: D+8.9 2008: D+10.7
Not yet ingested
- Civics
- —
Market trends
- HPI YoY
- ▼ -481.88%
- Current HPI
- 273.9008
- Rent YoY
- ▲ 0.82%
- Metro
- Stockton, CA
- State GDP YoY
- ▲ 3.21%
- F500 in state
- 116
Industry mix (Fortune 500 HQ in CA)
| Industry | F500 HQs | Revenue |
|---|---|---|
| Technology | 27 | $1,492B |
|
||
| Financial Services | 3 | $174B |
|
||
| Retail | 3 | $44B |
|
||
| Insurance | 3 | $26B |
|
||
| Media / Entertainment | 2 | $115B |
|
||
| Pharmaceuticals / Biotech | 2 | $62B |
|
||
Property tax history
-2.3%/yrLatest (2025): $864 · +3.3% YoY. Source: county tax records.
Cash-flow waterfall
monthlySold comps — $/sqft
last 12 mo · ≤1 miLoading sold comps…