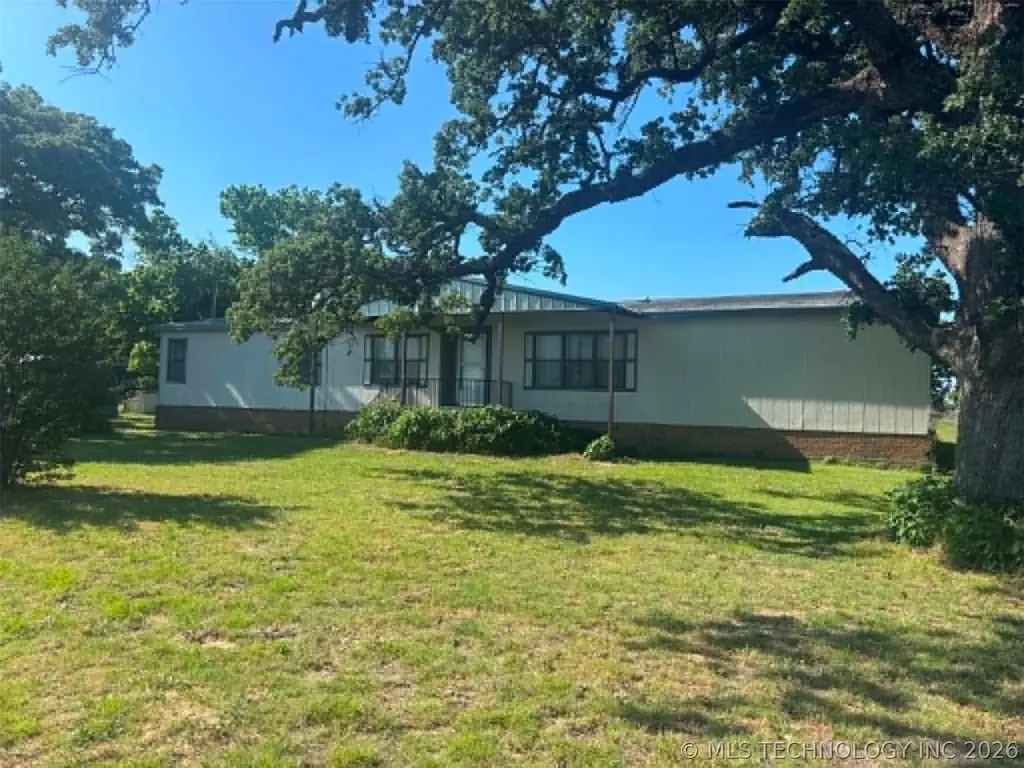
19996 Tabler Rd · Thackerville, OK
Flood risk 1/10 · Minimal
- FEMA flood zone
- —
- Chance of flooding over 30 yrs
- 0.0%
- Est. flood insurance / yr
- —
Fire risk 5/10 · Moderate
- Est. fire insurance / yr
- $2,463 – $4,575
Heat risk 6/10 · Moderate
- Hot days now (above 109°F)
- 7 days/yr
- Hot days in 30 yrs
- 20 days/yr
Wind risk 6/10 · Moderate
- Chance of severe wind over 30 yrs
- 27.0%
Air-quality risk 3/10 · Minor
- Unhealthy air days now
- 3 days/yr
- Unhealthy air days in 30 yrs
- 4 days/yr
Risk factors via First Street. Map © Google.
Why this score? — see what drove the C+ grade
The composite is a weighted blend of 9 inputs, each scored 0–100. Each bar is that input's sub-score; the figure is the points it added to the 100-point composite (weight × sub-score).
- Cash flow +25.5/30.0
- DSCR +8.5/10.0
- ARV discount +7.5/15.0
- 1% rule +5.4/10.0
- Appreciation +3.7/10.0
- Livability +3.1/5.0
- Rent growth +2.5/5.0
- Condition / age +2.5/5.0
- Schools +2.2/10.0
$149,000
🖨 Deal sheet 📄 Offer letter ✓ Due diligence
Listing remarks
A perfect location for an investor or someone looking for a fixer upper. This 4 bed 2.5 bath home sitting on 1.43 acres, is ready for someone to come in and make it their own. Located less than a mile from Winstar Casino and I-35, it provides the perfect place to call home or add to your rental portfolio. Sold in as-is condition. Call now to set up a showing, these types of properties do not last long in this area!
Key facts
- 1.43 acres
- 1.43 acre lot
- Garage
Tags
Property features AI
Exterior
- Parking: 1-car garage; Carport
- Security: Storm shelter
- Utilities: Electricity available; Natural gas available; Public water; Septic tank
- Home design: Single-story; Double wide manufactured home; South-facing; Crawlspace foundation
- Construction: Built (year per public records); Brick and Masonite exterior; Manufactured construction; Asphalt/fiberglass roof
- Exterior features: Covered porch; Storm shelter; Horses allowed
Interior
- Kitchen: Oven; Range
- Flooring: Carpet; Laminate
- Bathrooms: 2 full bathrooms; 1 half bathroom
- Heating & cooling: Central heating; Propane heating; Central air conditioning; Has heating and cooling
- Interior features: Aluminum window frames; Laminate counters; Electric oven and range connections
- Laundry & utility: Washer hookup; Electric dryer hookup; Gas water heater
Neighborhood map
What this means for you Summary
Snapshot
- This is a 3-bed/3.0-bath manufactured listed at $149k.
Deal economics
- At list price, monthly cash flow is $349 ($4k/yr) — positive.
- The deal already cash-flows at list — no discount required.
- Meets the 1% rule at list price ($2k rent vs $149k).
- Recommended offer: $145k (3.0% below list) — sets the bar for market timing.
Location & tenants
- Location reads 61/100 on livability (#319 in OK) — a middle-class / working-renter tenant base. Strengths: cost of living A+, housing A+, crime A; Watch: schools F, amenities F, commute F.
- Thackerville (rural): math 20% / reading 25% proficiency, ranked #376 of 513 in OK (top 73%) — low school quality limits family demand, transient renter base, plan for 1-2y turnover; 65% free/reduced lunch — lower-income household profile, screen leases tightly.
- Market conditions: 25 active listings in the ZIP.
Forward outlook
- Local home prices are declining (-2.5%/yr); year-one equity from $1k of loan paydown is wiped out by about $4k of value loss. Plan a longer hold.
- Love County population projected at +27% by 2050 — long-run rental-demand tailwind backs the buy-and-hold thesis.
- At projected returns (-2.5% appreciation + 3.0% rent growth), your $42k cash investment doubles in ~10 years — after that, you're playing with house money.
Negotiation context
- It's been on market 37 days — a 3% lower offer ($145k) is reasonable based on typical stale-listing flexibility.
Risks & watch-outs
- Climate carrying-cost: major wind risk, 27% chance of damaging wind over 30y; moderate wildfire risk; extreme-heat days projected 7→20/yr by 2055 (HVAC capex compounding) — expect insurance premiums to compound above CPI over the hold.
Questions for the listing agent
- It's been on market 37 days. Have you received any prior offers? Is the seller open to a 3% concession, seller financing, or rate buy-down credit?
- Is there a deadline driving the sale (1031 exchange, divorce, estate, relocation)? That informs how much negotiation room exists.
- Schools are F-rated, which usually means shorter tenancies and higher turnover. Who's the typical renter profile here, and what's been the actual vacancy rate?
- What's the average days-on-market for RENTAL listings here right now (not sales)? A rising rental-DOM trend means longer vacancies and softer asking-rent achievability than the comps imply.
- What's the recent tenant-quality profile in this submarket — average credit score on applications, eviction rate, late-payment / NSF rate, and stable-employment percentage? A property-management company in the area should have these aggregated.
- How much new for-sale + rental construction is in the pipeline within 1–3 miles? Heavy new supply typically softens prices + rents 12–24 months out; constrained supply supports both.
Investment metrics
- 1% rule
- 1.04% ✓
- Cap rate
- 9.10%
- Cash-on-cash
- 10.03%
- DSCR
- 1.45
- GRM
- 8.0
CMA / ARV
No comps found within radius.
Projected returns pro-forma
-2.54% appreciation · 3.0% rent growth · sell at horizon
- IRR
- 0.5%
- Equity multiple
- 1.02×
- Total profit
- $887
- Equity at exit
- $25,295
- IRR
- 9.3%
- Equity multiple
- 1.76×
- Total profit
- $31,592
- Equity at exit
- $18,233
Cash invested: $41,720 (down + closing). Projections, not guarantees.
Landlord ↔ Tenant lean methodology
- Overall (STATE)
- 83 Strongly Landlord-Friendly
- State Oklahoma
- 83 Strongly Landlord-Friendly · R+20
- County
- — inherits STATE
- City
- — inherits STATE
ZIP-level market 73459
- Home prices YoY
- -1.1%
- Active inventory
- 25
- Price-to-rent
- 8.0×
Monthly cashflow live
- Estimated rent
- $1,550 medium interval (Pro) →
- Mortgage (P&I)
- −$781
- Tax from tax record
- −$33 /mo · $392/yr
- Insurance
- −$62
- HOA
- −$0
- Vacancy / Maint / Mgmt
- −$326
- Net cashflow
- $349
Break-even live
UW: 25.0% down · 7.5% · 30yr · 1.5% tax · 5.0% vac · 8.0% maint · 8.0% mgmt
Financing live
Cash to close
- Down payment
- $37,250
- Closing costs
- $4,470
- Reserves months
- —
- Total cash needed
- —
Loan-product check · same deal, 3 products live
Conventional
25% down · 7.5% · 30yr
- Down + closing
- —
- Monthly P&I
- —
- Monthly cashflow
- —
- DSCR
- —
- Eligible?
- —
Personal DTI + credit; lowest rate.
DSCR
20% down · 8.5% · 30yr
- Down + closing
- —
- Monthly P&I
- —
- Monthly cashflow
- —
- DSCR
- —
- Eligible?
- —
No personal income docs; deal must DSCR.
Hard money
10% down · 12.0% · 12mo
- Down + closing
- —
- Monthly P&I
- —
- Monthly cashflow
- —
- DSCR
- —
- Eligible?
- —
Short-term bridge; refi at stabilization.
Listing history 18 events
-
2026-06-19days on market $149,000 Active 37 DOM
-
2026-06-18days on market $149,000 Active 36 DOM
-
2026-06-17days on market $149,000 Active 35 DOM
-
2026-06-16days on market $149,000 Active 34 DOM
-
2026-06-15days on market $149,000 Active 33 DOM
-
2026-06-14days on market $149,000 Active 31 DOM
-
2026-06-12days on market $149,000 Active 30 DOM
-
2026-06-09days on market $149,000 Active 27 DOM
-
2026-06-08days on market $149,000 Active 26 DOM
-
2026-06-07days on market $149,000 Active 25 DOM
-
2026-06-05days on market $149,000 Active 22 DOM
-
2026-06-02days on market $149,000 Active 20 DOM
-
2026-06-01price $149,000 Active 19 DOM
-
2026-06-01days on market $156,900 Active 19 DOM
-
2026-05-31days on market $156,900 Active 18 DOM
-
2026-05-30days on market $156,900 Active 17 DOM
-
2026-05-20price $156,900
-
2026-05-13$165,000 Active
ⓘ Source: listings_history table (triggers on properties + properties_extension) + one-shot
backfill from property_details.listing_events for pre-trigger history.
Tax reassessment forecast OK · Resets to sale price
- Current annual tax
- $392 · $33/mo
- Projected year-2 tax
- $1,341 · $112/mo
- Expected delta
- +$949/yr (+$79/mo · 242.1%)
ⓘ Screening estimate from a state-policy table — verify with the county assessor before closing.
Climate risk First Street
- Flood 1/10 Low 0% chance over 30 yrs
- Wildfire 5/10 Major
- Heat 6/10 Major 7 d/yr ≥109°F today · 20 d/yr by 30 yrs out
- Wind 6/10 Major 27% chance of damaging wind over 30 yrs
- Air quality 3/10 Moderate 3 unhealthy d/yr today · 4 by 30 yrs out
Nearby sold comps map
Loading sold comps map…
Walkable amenities ~0.75 mi
Loading nearby amenities…
Taxation est. · year 1
- Rental income
- $18,605
- − Mortgage interest
- −$8,346
- − Property taxes
- −$392
- − Insurance
- −$745
- − Repairs & maintenance
- −$1,488
- − Management
- −$1,488
- − Depreciation
- −$4,335
- Taxable income
- $1,810
- Est. tax owed @ 24.0%
- −$434
- After-tax cash flow
- $3,750/yr
For passive investors: Depreciation is non-cash, so a rental often shows a tax loss while cash-flowing — sheltering income. Rental losses are passive: they offset passive income freely, and up to $25,000/yr can offset ordinary (W-2) income if you actively participate and your MAGI is under $100k (phasing out to $0 by $150k); unused losses carry forward. On sale, claimed depreciation is recaptured at up to 25%, and gains may owe capital-gains tax (a 1031 exchange can defer both). Figures are a year-1 estimate at your 24.0% rate — not tax advice; consult a CPA.
Schools (NCES district)
- District
- Thackerville
- NCES district ID
- 4029850
- Math proficiency
- 20% ▼ -5.00%
- Reading proficiency
- 25% ▬ 0.00%
- Median HH income
- $40,471
- Composite
- 22.21/100
- National rank
- #13514
- State rank
- #376 of 513 in OK
Livability — Thackerville
- Score
- 61/100
- State rank
- #319
- US rank
- #18258
Category grades
Schools grade is shown separately in the Schools card above.
Census & demographics
- Population (ZIP)
- 1,584
Population outlook (Love County) Hauer SSP2
- Today (2025)
- 10,844 people
- By 2030
- 11,370 · +4.9%
- By 2040
- 12,496 · +15.2%
- By 2050
- 13,766 · +26.9%
- By 2075
- 17,688 · +63.1%
- By 2100
- 21,161 · +95.1%
Race, ethnicity, and origin ACS 2023
- Neighborhood character
- Predominantly White (82%)
- Race & ethnicity
- White 82% Two or more races 10% Hispanic / Latino 6% Asian 3% Native American 2%
- Hispanic origin (detail)
- Mexican 5%
- Common ancestry
- Portuguese 3% Lithuanian 2% Slovak 2%
- Foreign-born
- 3% · Canada, Vietnam
- Languages at home
- 93% English-only · Spanish 4% Other Indo-European 2%
Political lean MEDSL · Love
- 2024 margin
- Solid R (+66.2) · D 16.2% · R 82.4% · Other 1.4%
- 2008→2024 swing
- -31.6pp toward R · 2008: -34.6pp · 2024: -66.2pp
- All cycles
- 2024: R+66.2 2020: R+63.6 2016: R+57.7 2012: R+40.4 2008: R+34.6
Not yet ingested
- Civics
- —
Market trends
- HPI YoY
- ▼ -2.54%
- Current HPI
- 219.808
- Rent YoY
- —
- Metro
- —
- State GDP YoY
- ▲ 1.55%
- F500 in state
- 6
Industry mix (Fortune 500 HQ in OK)
| Industry | F500 HQs | Revenue |
|---|---|---|
| Energy | 3 | $48B |
|
||
Price history
-4.9% since first listed2 events — show timeline
- 2026-05-20 Price Changed $156,900 MLS Technology, Inc.
- 2026-05-13 Listed $165,000 MLS Technology, Inc.
Property tax history
-1.1%/yrLatest (2025): $392 · +2.1% YoY. Source: county tax records.
Cash-flow waterfall
monthlySold comps — $/sqft
last 12 mo · ≤1 miLoading sold comps…