 Fourplex
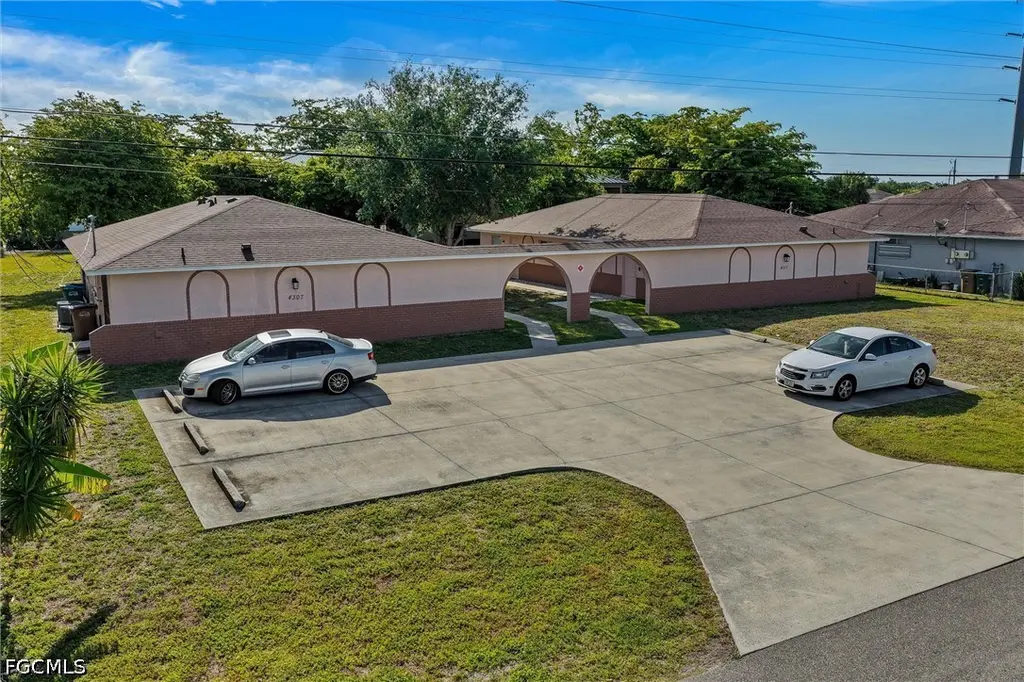
4307 SW Santa Barbara Pl #1 · Cape Coral, FL
Flood risk 8/10 · Major
- FEMA flood zone
- AE
- Chance of flooding over 30 yrs
- 0.98%
- Est. flood insurance / yr
- $1,737 – $8,500
Fire risk 1/10 · Minimal
- Est. fire insurance / yr
- $947 – $1,759
Heat risk 10/10 · Severe
- Hot days now (above 107°F)
- 7 days/yr
- Hot days in 30 yrs
- 29 days/yr
Wind risk 10/10 · Severe
- Chance of severe wind over 30 yrs
- 99.0%
Air-quality risk 2/10 · Minimal
- Unhealthy air days now
- 1 days/yr
- Unhealthy air days in 30 yrs
- 1 days/yr
Risk factors via First Street. Map © Google.
Why this score? — see what drove the D+ grade
The composite is a weighted blend of 9 inputs, each scored 0–100. Each bar is that input's sub-score; the figure is the points it added to the 100-point composite (weight × sub-score).
- Cash flow +16.5/30.0
- ARV discount +7.5/15.0
- DSCR +5.1/10.0
- 1% rule +4.4/10.0
- Schools +4.1/10.0
- Livability +3.9/5.0
- Condition / age +2.5/5.0
- Rent growth +1.4/5.0
- Appreciation +0.0/10.0
$624,900
🖨 Deal sheet 📄 Offer letter ✓ Due diligence
Multi-family units
County records classify this as Multi-Family (5+ Unit). Listing-text estimate: 4 units. estimate disagrees with records
5+ unit building — per-unit beds/baths from public records are typically unavailable; the breakdown below (if shown) is an estimate from the listing text.
Listing remarks MLS
Centerally located quadraplex with lots of potential. This property features four 2 bed 2 bath units with private lanais. Each unit has laundry hook ups on their lanais. This will need TLC and is priced accordingly. Agents see confidential comments and attached docs for offer instructions.
Key facts
- Mature shade tree
- Central courtyard
- New roof
Tags
Property features AI
Finance
- Other: Pets allowed; Tenants responsible for application fee, cable TV and electricity
- Financial info: Gross scheduled income: $4,130; Unit rents reported: $1,210, $1,210, $1,540, $1,380
- HOA & community: No association fee listed
Exterior
- Utilities: Cable available; Sewer assessment paid; Water assessment paid
- Home design: Multifamily property (4 units in 2 buildings); Resale
- Construction: Block, concrete and stucco construction; Shingle roof
- Exterior features: Courtyard; Multiple lots; Paved public road access
Interior
- Bedrooms: Four 2-bedroom units
- Flooring: Carpet; Tile
- Bathrooms: Eight full bathrooms (two per unit)
- Heating & cooling: Central heating (electric); Central air conditioning (electric)
- Interior features: Single-hung windows; Screened lanai/porch; Great room
Neighborhood map
What this means for you Summary
Snapshot
- This is a 4 × 2-bed/2.0-bath units multifamily listed at $625k.
Deal economics
- At list price, monthly cash flow is $-56 ($-670/yr) — negative. Per door: $-14/mo.
- To cash-flow at today's rent, offer at most $615k (1.6% below list).
- To meet the 1% rule (rent ≥ 1% of price), the offer needs to be $587k (6.1% below list).
- Recommended offer: $587k (6.1% below list) — sets the bar for 1% rule.
- Cap rate 7.0% vs local median 3.1% in Cape Coral — top-decile yield for the area; either an underpriced asset or a hidden risk that comps aren't pricing in. Stress-test before assuming the spread holds.
Location & tenants
- Location reads 77/100 on livability (#208 in FL, #3,098 nationally) — a middle-class / working-renter tenant base. Strengths: housing A+, health & safety A+, amenities B+; Watch: commute F.
- Lee (suburban): math 47% / reading 50% proficiency, ranked #42 of 73 in FL (top 58%) — families likely to look elsewhere, expect single-tenant / working-renter base with shorter leases.
- Market conditions: Rents falling (-4.4%/yr); 1208 active listings in the ZIP; 40 comparable units currently listed for rent nearby; rentals at typical pace (median 24d on market — plan ~3-4 weeks tenant-placement turnaround); solid renter incomes; 15,411 units permitted in Lee County in 2024 (4,686 in 5+ unit buildings).
- At $5,868/mo this rent would consume 84% of the median local household income ($84k/yr) (locally 835% of renters already pay >50% of income on rent) — very limited rent-growth headroom before tenants either downsize or default.
Forward outlook
- Local home prices are declining (-3.0%/yr); year-one equity from $4k of loan paydown is wiped out by about $19k of value loss. Plan a longer hold.
- Lee County population projected at +44% by 2050 — long-run rental-demand tailwind backs the buy-and-hold thesis.
Negotiation context
- Only 5 days on market — expect competitive offers; lowballing is unlikely to land.
- 4 sale attempts since 2y ago with the ask held roughly flat each time — persistent listings suggest the price (not the market) is what's stuck; bring a comps-based counter.
- Current owner paid $110k; list at $625k implies a 468% gain — meaningful room to come down on a strong offer.
Risks & watch-outs
- Watch-outs: flood insurance adds $427/mo.
- Climate carrying-cost: in FEMA flood zone AE (mandatory federal flood insurance); severe wind risk, 99% chance of damaging wind over 30y; extreme-heat days projected 7→29/yr by 2055 (HVAC capex compounding) — expect insurance premiums to compound above CPI over the hold.
Questions for the listing agent
- What do current leases actually rent for vs. the listed asking? Can we see a recent rent roll and the last 12 months of T-12 income?
- Can we see the unit-by-unit rent roll, current vacancy, and any below-market leases? What's the average tenancy length?
- What capital expenditures (roof, boiler, parking lot, exteriors) have been made in the last 5 years, and what's planned in the next 2?
- What's the actual annual flood-insurance premium (NFIP or private), and is the property in a SFHA with mandatory coverage?
- Is there a deadline driving the sale (1031 exchange, divorce, estate, relocation)? That informs how much negotiation room exists.
- Schools are B-rated — typically a magnet for longer-tenancy family renters. What's the average tenant stay here, and is there a school-zone premium baked into asking?
- The area grade is low — what's the realistic commute time and amenity access for the typical tenant pool here? Any planned neighborhood developments (good or bad) we should know about?
- What's the average days-on-market for RENTAL listings here right now (not sales)? A rising rental-DOM trend means longer vacancies and softer asking-rent achievability than the comps imply.
- What's the recent tenant-quality profile in this submarket — average credit score on applications, eviction rate, late-payment / NSF rate, and stable-employment percentage? A property-management company in the area should have these aggregated.
- How much new apartment / multifamily construction is in the pipeline within 1–3 miles? Heavy new supply (>2% of stock underway) typically softens rents 12–24 months out; light construction supports rent growth.
Investment metrics
- 1% rule
- 0.94% ✗
- Cap rate
- 7.00%
- Cash-on-cash
- 2.54%
- DSCR
- 1.11
- GRM
- 8.9
CMA / ARV
No comps found within radius.
Projected returns pro-forma
-3.0% appreciation · 0.0% rent growth · sell at horizon
- IRR
- -20.6%
- Equity multiple
- 0.30×
- Total profit
- $-121,693
- Equity at exit
- $93,175
- IRR
- -23.6%
- Equity multiple
- -0.00×
- Total profit
- $-175,712
- Equity at exit
- $54,030
Cash invested: $174,972 (down + closing). Projections, not guarantees.
Landlord ↔ Tenant lean methodology
- Overall (STATE)
- 87 Strongly Landlord-Friendly
- State Florida
- 87 Strongly Landlord-Friendly · R+3
- County
- — inherits STATE
- City
- — inherits STATE
ZIP-level market 33914
- Home prices YoY
- -30.0%
- Rents YoY
- -4.4%
- Active inventory
- 1208
- Price-to-rent
- 35.5×
Monthly cashflow live
- Estimated rent
- $5,868 medium interval (Pro) →
- Mortgage (P&I)
- −$3,277
- Tax from tax record
- −$728 /mo · $8,731/yr
- Insurance
- −$260
- Flood insurance flood zone
- −$427 /mo · $5,118/yr
- HOA
- −$0
- Vacancy / Maint / Mgmt
- −$1,232
- Net cashflow
- $-56
Break-even live
4-unit breakdown (identical units grouped — click to expand)
| Units | Beds | Baths | Est. rent |
|---|---|---|---|
| 4× units | 2 | 2 | $5,868 |
| #1 | 2 | 2 | $1,467 |
| #2 | 2 | 2 | $1,467 |
| #3 | 2 | 2 | $1,467 |
| #4 | 2 | 2 | $1,467 |
| Total (4 units) | $5,868 | ||
UW: 25.0% down · 7.5% · 30yr · 1.5% tax · 5.0% vac · 8.0% maint · 8.0% mgmt
Financing live
Cash to close
- Down payment
- $156,225
- Closing costs
- $18,747
- Reserves months
- —
- Total cash needed
- —
Loan-product check · same deal, 3 products live
Conventional
25% down · 7.5% · 30yr
- Down + closing
- —
- Monthly P&I
- —
- Monthly cashflow
- —
- DSCR
- —
- Eligible?
- —
Personal DTI + credit; lowest rate.
DSCR
20% down · 8.5% · 30yr
- Down + closing
- —
- Monthly P&I
- —
- Monthly cashflow
- —
- DSCR
- —
- Eligible?
- —
No personal income docs; deal must DSCR.
Hard money
10% down · 12.0% · 12mo
- Down + closing
- —
- Monthly P&I
- —
- Monthly cashflow
- —
- DSCR
- —
- Eligible?
- —
Short-term bridge; refi at stabilization.
Rent comps 40 comps
| Address | Beds | Baths | Sqft | Rent | $/sqft | DOM | Units | Dist |
|---|---|---|---|---|---|---|---|---|
| 4214 Santa Barbara Blvd Cape Coral, FL | 3.0 | 2.0 | 1250 | $1,660 | $1.33 | 24d | 1 | 0.06mi |
| 4317 SW Santa Barbara Pl Cape Coral, FL | 3.0 | 2.0 | 1353 | $1,900 | $1.40 | 24d | 1 | 0.07mi |
| 209 SW 42nd St Cape Coral, FL | 4.0 | 2.5 | 2001 | $3,000 | $1.50 | 3d | 1 | 0.26mi |
| 130 SE 44th St Cape Coral, FL | 3.0 | 2.0 | 1841 | $5,000 | $2.72 | 24d | 1 | 0.27mi |
| 233 SW 43rd St Cape Coral, FL | 4.0 | 2.0 | 2105 | $2,200 | $1.05 | 19d | 1 | 0.32mi |
| 4011 SW 2nd Ave Cape Coral, FL | 3.0 | 2.0 | 1660 | $2,500 | $1.51 | 24d | 1 | 0.33mi |
| 4331 SE 1st Ave Cape Coral, FL | 3.0 | 2.0 | 1336 | $2,400 | $1.80 | 24d | 1 | 0.33mi |
| 120 SE 46th St Cape Coral, FL | 3.0 | 2.0 | 1993 | $2,926 | $1.47 | 3d | 1 | 0.45mi |
| 4202 Palm Tree Blvd Cape Coral, FL | 3.0 | 2.0 | 1786 | $2,000 | $1.12 | 24d | 1 | 0.51mi |
| 206 SE 46th Ter Cape Coral, FL | 3.0 | 2.0 | 1739 | $1,949 | $1.12 | 24d | 1 | 0.56mi |
| 3749 SW 1st Pl Cape Coral, FL | 3.0 | 2.0 | 1475 | $2,800 | $1.90 | 24d | 1 | 0.57mi |
| 251 SE 46th St Cape Coral, FL | 3.0 | 2.5 | 1370 | $4,500 | $3.28 | 24d | 1 | 0.62mi |
| 4138 SW 5th Ave Cape Coral, FL | 4.0 | 2.0 | 2247 | $9,000 | $4.01 | 24d | 1 | 0.63mi |
| 4028 SW 5th Ave Cape Coral, FL | 3.0 | 2.0 | 1509 | $2,000 | $1.33 | 24d | 1 | 0.67mi |
| 4105 SW 5th Pl Cape Coral, FL | 3.0 | 2.0 | 1446 | $3,300 | $2.28 | 24d | 1 | 0.70mi |
| 3629 SW Santa Barbara Pl Cape Coral, FL | 3.0 | 2.0 | 1400 | $1,750 | $1.25 | 24d | 1 | 0.75mi |
| 4125 SW 6th Pl Cape Coral, FL | 3.0 | 2.0 | 1378 | $1,700 | $1.23 | 24d | 1 | 0.79mi |
| 4534 SW 5th Pl Cape Coral, FL | 4.0 | 2.0 | 2258 | $7,105 | $3.15 | 24d | 1 | 0.82mi |
| 311 SW 48th Ter Cape Coral, FL | 3.0 | 2.0 | 1441 | $2,350 | $1.63 | 24d | 1 | 0.82mi |
| 311 SW 48th Ter Cape Coral, FL | 3.0 | 2.0 | 1441 | $2,350 | $1.63 | 14d | 1 | 0.82mi |
| 531 SW 39th Ter Cape Coral, FL | 4.0 | 2.0 | 1425 | $2,600 | $1.82 | 24d | 1 | 0.85mi |
| 4539 SW 6th Pl Cape Coral, FL | 3.0 | 3.0 | 2386 | $2,500 | $1.05 | 24d | 1 | 0.90mi |
| 624 Mohawk Pkwy Cape Coral, FL | 3.0 | 2.0 | 1745 | $2,750 | $1.58 | 3d | 1 | 0.90mi |
| 428 SW 37th St Cape Coral, FL | 3.0 | 2.0 | 1705 | $3,500 | $2.05 | 3d | 1 | 0.94mi |
| 4346 SW 7th Pl Cape Coral, FL | 3.0 | 2.0 | 1254 | $1,650 | $1.32 | 21d | 1 | 0.95mi |
| 4344 SW 7th Pl Cape Coral, FL | 3.0 | 2.0 | 1254 | $1,650 | $1.32 | 21d | 1 | 0.95mi |
| 4113 Skyline Blvd Cape Coral, FL | 3.0 | 2.0 | 2418 | $2,000 | $0.83 | 24d | 1 | 0.97mi |
| 440 Cape Coral Pkwy E Cape Coral, FL | 3.0 | 1.0–2.0 | 1003 | $4,550 | $4.53 | 2d | 95 | 0.98mi |
| 3766 SE 6th Ave Cape Coral, FL | 3.0 | 2.0 | 2048 | $2,500 | $1.22 | 24d | 1 | 0.98mi |
| 4522 SW 7th Pl Cape Coral, FL | 4.0 | 4.0 | 2124 | $1,650 | $0.78 | 16d | 1 | 1.00mi |
| 4522 SW 7th Pl Cape Coral, FL | 4.0 | 4.0 | 2124 | $1,650 | $0.78 | 19d | 1 | 1.00mi |
| 4808 SW 5th Pl Cape Coral, FL | 3.0 | 2.0 | 2282 | $7,650 | $3.35 | 24d | 1 | 1.01mi |
| 4402 Skyline Blvd Cape Coral, FL | 3.0 | 2.0 | 1350 | $1,550 | $1.15 | 14d | 1 | 1.03mi |
| 4402 Skyline Blvd Cape Coral, FL | 3.0 | 2.0 | 1350 | $1,550 | $1.15 | 14d | 1 | 1.03mi |
| 4408 Skyline Blvd Cape Coral, FL | 3.0 | 2.0 | 1280 | $1,530 | $1.20 | 24d | 1 | 1.03mi |
| 621 SE 46th Ter Cape Coral, FL | 3.0 | 2.0 | 1360 | $1,450 | $1.07 | 15d | 1 | 1.03mi |
| 3527 SE 3rd Ave Cape Coral, FL | 3.0 | 2.0 | 1758 | $2,115 | $1.20 | 24d | 1 | 1.05mi |
| 4622 SW 7th Pl Cape Coral, FL | 3.0 | 2.0 | 1329 | $1,950 | $1.47 | 3d | 1 | 1.07mi |
| 3619 SW 6th Ave Cape Coral, FL | 3.0 | 2.0 | 1926 | $2,800 | $1.45 | 24d | 1 | 1.07mi |
| 4126 SW 8th Pl Cape Coral, FL | 3.0 | 2.0 | 1401 | $1,700 | $1.21 | 3d | 1 | 1.07mi |
Listing history 12 events
-
2026-04-30status Pending
-
2026-04-23$624,900 Active
-
2025-01-05historical $1,395
-
2025-01-04$1,395
-
2025-01-03historical $1,395
-
2024-12-28historical $1,395
-
2024-12-28$1,395
-
2024-11-26$1,395
-
2013-11-27price $99,900 290-char remark
Show marketing remark (290 chars)
Centerally located quadraplex with lots of potential. This property features four 2 bed 2 bath units with private lanais. Each unit has laundry hook ups on their lanais. This will need TLC and is priced accordingly. Agents see confidential comments and attached docs for offer instructions.
-
2010-08-04soldstatus $110,000 290-char remark
Show marketing remark (290 chars)
Centerally located quadraplex with lots of potential. This property features four 2 bed 2 bath units with private lanais. Each unit has laundry hook ups on their lanais. This will need TLC and is priced accordingly. Agents see confidential comments and attached docs for offer instructions.
-
1998-09-18soldstatus $147,300
-
1993-11-05soldstatus $120,500
ⓘ Source: listings_history table (triggers on properties + properties_extension) + one-shot
backfill from property_details.listing_events for pre-trigger history.
Tax reassessment forecast FL · Resets to sale price
- Current annual tax
- $8,731 · $728/mo
- Projected year-2 tax
- $8,731 · $728/mo
- Expected delta
- $0/yr ($0/mo · 0.0%)
ⓘ Screening estimate from a state-policy table — verify with the county assessor before closing.
Climate risk First Street
- Flood 8/10 Severe FEMA zone AE · 98% chance over 30 yrs
- Wildfire 1/10 Low
- Heat 10/10 Extreme 7 d/yr ≥107°F today · 29 d/yr by 30 yrs out
- Wind 10/10 Extreme 99% chance of damaging wind over 30 yrs
- Air quality 2/10 Low 1 unhealthy d/yr today · 1 by 30 yrs out
Nearby sold comps map
Loading sold comps map…
Walkable amenities ~0.75 mi
Loading nearby amenities…
Taxation est. · year 1
- Rental income
- $70,416
- − Mortgage interest
- −$35,004
- − Property taxes
- −$8,731
- − Insurance
- −$8,243
- − Repairs & maintenance
- −$5,633
- − Management
- −$5,633
- − Depreciation
- −$18,179
- Taxable loss
- −$11,007
- Est. tax savings @ 24.0%
- +$2,642
- After-tax cash flow
- $1,972/yr
For passive investors: Depreciation is non-cash, so a rental often shows a tax loss while cash-flowing — sheltering income. Rental losses are passive: they offset passive income freely, and up to $25,000/yr can offset ordinary (W-2) income if you actively participate and your MAGI is under $100k (phasing out to $0 by $150k); unused losses carry forward. On sale, claimed depreciation is recaptured at up to 25%, and gains may owe capital-gains tax (a 1031 exchange can defer both). Figures are a year-1 estimate at your 24.0% rate — not tax advice; consult a CPA.
Schools (NCES district)
- District
- Lee
- NCES district ID
- 1201080
- Math proficiency
- 47% ▼ -11.00%
- Reading proficiency
- 50% ▼ -4.00%
- Median HH income
- $49,518
- Composite
- 41.49/100
- National rank
- #3458
- State rank
- #42 of 73 in FL
Livability — Cape Coral
- Score
- 77/100
- State rank
- #208
- US rank
- #3098
Category grades
Schools grade is shown separately in the Schools card above.
Census & demographics
- Census place
- Cape Coral, FL
- County
- Lee County · 788,662 people
- City population
- 217,388
- Metro
- Cape Coral-Fort Myers, FL
- Population (ZIP)
- 45,540
- Household income
- $83,503
- Rent vs Own
- Severe rent burden
- 835.0
Population outlook (Lee County) Hauer SSP2
- Today (2025)
- 871,946 people
- By 2030
- 955,468 · +9.6%
- By 2040
- 1,113,587 · +27.7%
- By 2050
- 1,256,891 · +44.1%
- By 2075
- 1,560,270 · +78.9%
- By 2100
- 1,726,848 · +98.0%
Race, ethnicity, and origin ACS 2023
- Neighborhood character
- Predominantly White (72%)
- Race & ethnicity
- White 72% Hispanic / Latino 20% Two or more races 13% Black 5%
- Hispanic origin (detail)
- Mexican 1% Puerto Rican 4% Cuban 8%
- Common ancestry
- Romanian 4% Lithuanian 2% Slovak 1%
- Foreign-born
- 17% · Canada, Jamaica
- Languages at home
- 80% English-only · Spanish 16% German/W. Germanic 1% Russian/Polish/Slavic 1%
Political lean MEDSL · Lee
- 2024 margin
- Strong R (+28.4) · D 35.5% · R 63.9%
- 2008→2024 swing
- -18.0pp toward R · 2008: -10.4pp · 2024: -28.4pp
- All cycles
- 2024: R+28.4 2020: R+19.2 2016: R+20.4 2012: R+16.6 2008: R+10.4
Not yet ingested
- Civics
- —
Market trends
- HPI YoY
- ▼ -122.73%
- Current HPI
- 286.3064
- Rent YoY
- ▼ -4.42%
- Metro
- Cape Coral-Fort Myers, FL
- State GDP YoY
- ▲ 3.28%
- F500 in state
- 36
Industry mix (Fortune 500 HQ in FL)
| Industry | F500 HQs | Revenue |
|---|---|---|
| Industrial Technology | 2 | $29B |
|
||
| Insurance | 2 | $17B |
|
||
| Retail | 1 | $60B |
|
||
| Technology Distribution | 1 | $58B |
|
||
| Homebuilding | 1 | $35B |
|
||
| Technology Manufacturing | 1 | $35B |
|
||
Price history
+418.6% since first listed12 events — show timeline
- 2026-04-30 Pending — FORTMLS
- 2026-04-23 Listed $624,900 FORTMLS
- 2025-01-05 Rental Removed $1,395 APPFOLIO
- 2025-01-04 Listed for Rent $1,395 APPFOLIO
- 2025-01-03 Rental Removed $1,395 STELLARMLS
- 2024-12-28 Rental Removed $1,395 APPFOLIO
- 2024-12-28 Listed for Rent $1,395 STELLARMLS
- 2024-11-26 Listed for Rent $1,395 APPFOLIO
- 2013-11-27 Price Changed $99,900 FORTMLS
- 2010-08-04 Sold (MLS) $110,000 FORTMLS
- 1998-09-18 Sold (Public Records) $147,300 Public Records
- 1993-11-05 Sold (Public Records) $120,500 Public Records
Property tax history
+7.7%/yrLatest (2025): $8,731 · +1.2% YoY. Source: county tax records.
Cash-flow waterfall
monthlySold comps — $/sqft
last 12 mo · ≤1 miLoading sold comps…