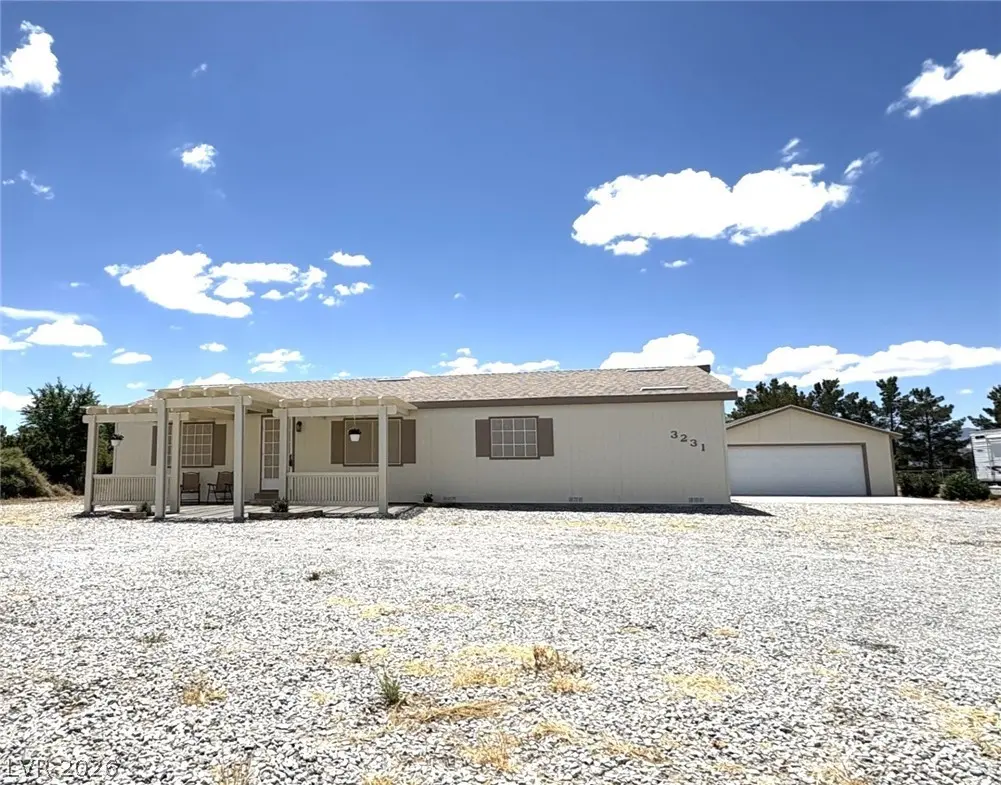
3231 Paiute Blvd · Pahrump, NV
Flood risk 1/10 · Minimal
- FEMA flood zone
- X (unshaded)
- Chance of flooding over 30 yrs
- 0.0%
- Est. flood insurance / yr
- $507 – $1,088
Fire risk 5/10 · Moderate
- Est. fire insurance / yr
- $490 – $910
Heat risk 7/10 · Major
- Hot days now (above 102°F)
- 6 days/yr
- Hot days in 30 yrs
- 15 days/yr
Wind risk 1/10 · Minimal
- Chance of severe wind over 30 yrs
- —
Air-quality risk 1/10 · Minimal
- Unhealthy air days now
- 0 days/yr
- Unhealthy air days in 30 yrs
- 0 days/yr
Risk factors via First Street. Map © Google.
Why this score? — see what drove the F grade
The composite is a weighted blend of 9 inputs, each scored 0–100. Each bar is that input's sub-score; the figure is the points it added to the 100-point composite (weight × sub-score).
- Cash flow +6.7/30.0
- Appreciation +6.4/10.0
- Livability +3.4/5.0
- ARV discount +2.7/15.0
- Rent growth +2.5/5.0
- Condition / age +2.5/5.0
- Schools +2.2/10.0
- DSCR +0.9/10.0
- 1% rule +0.5/10.0
$325,000
🖨 Deal sheet (PDF) 📄 Offer letter ✓ Due diligence
Listing remarks MLS
NICE 4 BEDROOM 2 BATH HOME LOCATED ON THE SOUTH SIDE OF TOWN. LARGE MASTER WITH CEILING FAN & LIGHT * LIVING ROOM HAS A CEILING FAN & LIGHT ALSO IN THE DINING AREA * 2ND & 3RD BEDROOMS HAVE CEILING FANS & LIGHTS ALSO * 2 CAR GARAGE ALLON 1.1 ACRE LOT * ON WELL & SEPTIC * CIRCULAR DRIVEWAY
Key facts
- Re-1 zoning
- Mud room area
- Updated cabinetry
Tags
Property features AI
Finance
- Other: Solar screens (energy efficient feature)
Exterior
- Parking: Detached garage; 2-car garage; Open and private parking; RV access/parking
- Utilities: Electricity available; Private well water; Septic system
- Home design: Single-story residence; North-facing; Resale property; Manufactured/mobile dimensions approximately 112' x 27'
- Construction: Wood siding; Asphalt roof; Resale construction
- Exterior features: Covered patio; Patio; Circular driveway; Landscaped grounds with rock accents; One to five acre parcel; Horses permitted
Interior
- Kitchen: Breakfast bar/counter; Pantry; Quartz countertops; Electric range; Garbage disposal
- Bedrooms: Up to 4 bedrooms; Primary bedroom with walk-in closet and private bath separation; Secondary bedrooms with ceiling fans, ceiling lights and closets; one with mirrored door
- Flooring: Carpet; Laminate
- Bathrooms: 2 full bathrooms
- Heating & cooling: Central heating (electric); Central air (electric)
- Interior features: Blinds and window treatments; Skylights; Ceiling fans
- Laundry & utility: Main-level laundry with electric dryer hookup
Neighborhood map
What this means for you Summary
Snapshot
- This is a 4-bed/2.0-bath manufactured listed at $325k.
Deal economics
- At list price, monthly cash flow is $-523 ($-6k/yr) — negative.
- To cash-flow at today's rent, offer at most $233k (28.4% below list).
- To meet the 1% rule (rent ≥ 1% of price), the offer needs to be $178k (45.3% below list).
- Recommended offer: $178k (45.3% below list) — sets the bar for 1% rule.
- Cap rate 4.4% vs local median 3.4% in Pahrump — meaningfully above typical; check what's discounted (condition, days-on-market, listing class) to confirm the premium yield is real.
Location & tenants
- Location reads 68/100 on livability (#30 in NV) — a middle-class / working-renter tenant base. Strengths: cost of living A+, housing A+, health & safety A+; Watch: employment D, crime F, amenities F.
- Nye County School District (rural): math 20% / reading 33% proficiency, ranked #16 of 17 in NV (top 94%) — low school quality limits family demand, transient renter base, plan for 1-2y turnover.
- Zoned schools: Hafen Elementary School (math 23% / reading 36%, grade F, #195 of 402 statewide, top 53%, 440 students, 100% FRL); Rosemary Clarke Middle School (math 20% / reading 31%, grade F, #62 of 109 statewide, top 58%, 1,060 students, 100% FRL); Pahrump Valley High School (math 14% / reading 41%, grade F, #74 of 131 statewide, top 56%, 1,362 students, 100% FRL) — zoned schools average 100% FRL vs 54% district-wide (46 pts higher); higher-poverty schools than district average — tighter screening recommended.
- Market conditions: 285 active listings in the ZIP; solid renter incomes.
Forward outlook
- In year one you build about $11k of equity ($2k loan paydown + $9k appreciation (2.8% local appreciation)).
- Nye County population projected at -28% by 2050 — secular population decline; favor cash flow + early exit over multi-decade hold.
- By year 4, paydown + projected appreciation supports a ~$38k cash-out refi (75% LTV) — recoverable capital for the next deal without selling this one.
Negotiation context
- It's been on market 26 days — a 2% lower offer ($320k) is reasonable based on typical stale-listing flexibility.
- 4 sale attempts since 14y ago with the ask held roughly flat each time — persistent listings suggest the price (not the market) is what's stuck; bring a comps-based counter.
- Current owner paid $190k; list at $325k implies a 71% gain — meaningful room to come down on a strong offer.
Risks & watch-outs
- Climate carrying-cost: moderate wildfire risk; extreme-heat days projected 6→15/yr by 2055 (HVAC capex compounding) — expect insurance premiums to compound above CPI over the hold.
Questions for the listing agent
- What do current leases actually rent for vs. the listed asking? Can we see a recent rent roll and the last 12 months of T-12 income?
- Is there a deadline driving the sale (1031 exchange, divorce, estate, relocation)? That informs how much negotiation room exists.
- Schools are F-rated, which usually means shorter tenancies and higher turnover. Who's the typical renter profile here, and what's been the actual vacancy rate?
- Crime grade is F in this area — have there been break-ins, vandalism, or insurance claims at this property in the last 3 years? What carrier currently insures it and at what premium?
- The area grade is low — what's the realistic commute time and amenity access for the typical tenant pool here? Any planned neighborhood developments (good or bad) we should know about?
- What's the average days-on-market for RENTAL listings here right now (not sales)? A rising rental-DOM trend means longer vacancies and softer asking-rent achievability than the comps imply.
- What's the recent tenant-quality profile in this submarket — average credit score on applications, eviction rate, late-payment / NSF rate, and stable-employment percentage? A property-management company in the area should have these aggregated.
- How much new for-sale + rental construction is in the pipeline within 1–3 miles? Heavy new supply typically softens prices + rents 12–24 months out; constrained supply supports both.
Investment metrics
- 1% rule
- 0.55% ✗
- Cap rate
- 4.36%
- Cash-on-cash
- -6.90%
- DSCR
- 0.69
- GRM
- 15.2
CMA / ARV
- ARV (on-the-fly)
- $293,949
- Comps found
- 5
Show comp detail 5 sales within ~0.75 mi
| Address | Dist | Beds/Ba | Sqft | Sold | Price | $/sf | Match |
|---|---|---|---|---|---|---|---|
| 3431 Navajo Blvd | 0.22mi | 3/2.0 (-1) | 1,520 (-1%) | 8mo | $275,000 | $181 | 76 |
| 3300 E Navajo Blvd | 0.19mi | 3/3.0 (-1) | 1,320 (-14%) | 8mo | $262,000 | $198 | 52 |
| 3830 E Mcgraw Rd | 0.59mi | 3/2.0 (-1) | 1,625 (+6%) | 12mo | $285,000 | $175 | 48 |
| 3031 E Navajo Blvd | 0.22mi | 3/2.0 (-1) | 1,310 (-15%) | 20mo | $250,000 | $191 | 43 |
| 3460 Savoy Blvd | 0.29mi | 3/2.0 (-1) | 1,310 (-15%) | 22mo | $270,000 | $206 | 38 |
Match score weights: distance 35% · size 25% · config 20% · recency 20%. Top-matched comps best support the ARV.
Projected returns pro-forma
2.78% appreciation · 3.0% rent growth · sell at horizon
- IRR
- 0.4%
- Equity multiple
- 1.02×
- Total profit
- $1,961
- Equity at exit
- $142,206
- IRR
- 4.3%
- Equity multiple
- 1.64×
- Total profit
- $58,138
- Equity at exit
- $216,149
Cash invested: $91,000 (down + closing). Projections, not guarantees.
Landlord ↔ Tenant lean methodology
- Overall (STATE)
- 71 Landlord-Friendly
- State Nevada
- 71 Landlord-Friendly · R+1
- County
- — inherits STATE
- City
- — inherits STATE
ZIP-level market 89061
- Home prices YoY
- 1.1%
- Active inventory
- 285
- Price-to-rent
- 15.2×
Monthly cashflow live
- Estimated rent
- $1,779 medium interval (Pro) →
- Mortgage (P&I)
- −$1,704
- Tax from tax record
- −$89 /mo · $1,070/yr
- Insurance
- −$135
- HOA
- −$0
- Lot rent leased land?
- −$0
- Vacancy / Maint / Mgmt
- −$374
- Net cashflow
- $-523
Break-even live
Sensitivity live
| Price | -10% $-339 | -5% $-431 | +0% $-523 | +5% $-615 | +10% $-707 |
|---|---|---|---|---|---|
| Rent | -10% $-664 | -5% $-594 | +0% $-523 | +5% $-453 | +10% $-383 |
| Rate | -1.0pp $-360 | -0.5pp $-441 | base $-523 | +0.5pp $-608 | +1.0pp $-693 |
UW: 25.0% down · 7.5% · 30yr · 1.5% tax · 5.0% vac · 8.0% maint · 8.0% mgmt
Financing live
Cash to close
- Down payment
- $81,250
- Closing costs
- $9,750
- Reserves months
- —
- Total cash needed
- —
Loan-product check · same deal, 3 products live
Conventional
25% down · 7.5% · 30yr
- Down + closing
- —
- Monthly P&I
- —
- Monthly cashflow
- —
- DSCR
- —
- Eligible?
- —
Personal DTI + credit; lowest rate.
DSCR
20% down · 8.5% · 30yr
- Down + closing
- —
- Monthly P&I
- —
- Monthly cashflow
- —
- DSCR
- —
- Eligible?
- —
No personal income docs; deal must DSCR.
Hard money
10% down · 12.0% · 12mo
- Down + closing
- —
- Monthly P&I
- —
- Monthly cashflow
- —
- DSCR
- —
- Eligible?
- —
Short-term bridge; refi at stabilization.
Listing history 27 events
-
2026-06-22days on market $325,000 Active 26 DOM
-
2026-06-19days on market $325,000 Active 23 DOM
-
2026-06-18price $325,000 Active 22 DOM
-
2026-06-18days on market $329,900 Active 22 DOM
-
2026-06-17days on market $329,900 Active 21 DOM
-
2026-06-16days on market $329,900 Active 20 DOM
-
2026-06-15days on market $329,900 Active 19 DOM
-
2026-06-14days on market $329,900 Active 17 DOM
-
2026-06-12days on market $329,900 Active 16 DOM
-
2026-06-09days on market $329,900 Active 13 DOM
-
2026-06-08days on market $329,900 Active 12 DOM
-
2026-06-07days on market $329,900 Active 11 DOM
-
2026-06-03days on market $329,900 Active 7 DOM
-
2026-06-02days on market $329,900 Active 6 DOM
-
2026-06-01days on market $329,900 Active 5 DOM
-
2026-05-31days on market $329,900 Active 4 DOM
-
2026-05-30days on market $329,900 Active 3 DOM
-
2026-05-27$329,900 Active
-
2025-11-12$190,000
-
2025-11-12soldstatus $190,000
-
2017-03-21soldstatus $77,900 Sold 320-char remark
Show marketing remark (320 chars)
NICE 4 BEDROOM 2 BATH HOME LOCATED ON THE SOUTH SIDE OF TOWN. LARGE MASTER WITH CEILING FAN & LIGHT * LIVING ROOM HAS A CEILING FAN & LIGHT ALSO IN THE DINING AREA * 2ND & 3RD BEDROOMS HAVE CEILING FANS & LIGHTS ALSO * 2 CAR GARAGE ALLON 1.1 ACRE LOT * ON WELL & SEPTIC * CIRCULAR DRIVEWAY
-
2017-03-21soldstatus $77,900
Show marketing remark (320 chars)
NICE 4 BEDROOM 2 BATH HOME LOCATED ON THE SOUTH SIDE OF TOWN. LARGE MASTER WITH CEILING FAN & LIGHT * LIVING ROOM HAS A CEILING FAN & LIGHT ALSO IN THE DINING AREA * 2ND & 3RD BEDROOMS HAVE CEILING FANS & LIGHTS ALSO * 2 CAR GARAGE ALLON 1.1 ACRE LOT * ON WELL & SEPTIC * CIRCULAR DRIVEWAY
-
2017-02-27historical Contingent Offer 320-char remark
Show marketing remark (320 chars)
NICE 4 BEDROOM 2 BATH HOME LOCATED ON THE SOUTH SIDE OF TOWN. LARGE MASTER WITH CEILING FAN & LIGHT * LIVING ROOM HAS A CEILING FAN & LIGHT ALSO IN THE DINING AREA * 2ND & 3RD BEDROOMS HAVE CEILING FANS & LIGHTS ALSO * 2 CAR GARAGE ALLON 1.1 ACRE LOT * ON WELL & SEPTIC * CIRCULAR DRIVEWAY
-
2017-02-14$77,900 Active 320-char remark
Show marketing remark (320 chars)
NICE 4 BEDROOM 2 BATH HOME LOCATED ON THE SOUTH SIDE OF TOWN. LARGE MASTER WITH CEILING FAN & LIGHT * LIVING ROOM HAS A CEILING FAN & LIGHT ALSO IN THE DINING AREA * 2ND & 3RD BEDROOMS HAVE CEILING FANS & LIGHTS ALSO * 2 CAR GARAGE ALLON 1.1 ACRE LOT * ON WELL & SEPTIC * CIRCULAR DRIVEWAY
-
2013-01-02historical
-
2012-07-13historical Contingent Offer
-
2012-06-22$50,000 Exclusive Right
ⓘ Source: listings_history table (triggers on properties + properties_extension) + one-shot
backfill from property_details.listing_events for pre-trigger history.
Tax reassessment forecast NV · Resets to sale price
- Current annual tax
- $1,070 · $89/mo
- Projected year-2 tax
- $1,918 · $160/mo
- Expected delta
- +$848/yr (+$71/mo · 79.2%)
ⓘ Screening estimate from a state-policy table — verify with the county assessor before closing.
Climate risk First Street
- Flood 1/10 Low FEMA zone X (unshaded) · 0% chance over 30 yrs
- Wildfire 5/10 Major
- Heat 7/10 Severe 6 d/yr ≥102°F today · 15 d/yr by 30 yrs out
- Wind 1/10 Low
- Air quality 1/10 Low 0 unhealthy d/yr today · 0 by 30 yrs out
Nearby sold comps map
Loading sold comps map…
Walkable amenities ~0.75 mi
Loading nearby amenities…
Taxation est. · year 1
- Rental income
- $21,351
- − Mortgage interest
- −$18,205
- − Property taxes
- −$1,070
- − Insurance
- −$1,625
- − Repairs & maintenance
- −$1,708
- − Management
- −$1,708
- − Depreciation
- −$9,455
- Taxable loss
- −$12,420
- Est. tax savings @ 24.0%
- +$2,981
- After-tax cash flow
- $-3,299/yr
For passive investors: Depreciation is non-cash, so a rental often shows a tax loss while cash-flowing — sheltering income. Rental losses are passive: they offset passive income freely, and up to $25,000/yr can offset ordinary (W-2) income if you actively participate and your MAGI is under $100k (phasing out to $0 by $150k); unused losses carry forward. On sale, claimed depreciation is recaptured at up to 25%, and gains may owe capital-gains tax (a 1031 exchange can defer both). Figures are a year-1 estimate at your 24.0% rate — not tax advice; consult a CPA.
Schools (NCES district)
- District
- Nye County School District
- NCES district ID
- 3200360
- Math proficiency
- 20% ▼ -6.00%
- Reading proficiency
- 33% ▼ -5.00%
- Median HH income
- $41,447
- Composite
- 22.43/100
- National rank
- #8110
- State rank
- #16 of 17 in NV
Livability — Pahrump
- Score
- 68/100
- State rank
- #30
- US rank
- #9226
Category grades
Schools grade is shown separately in the Schools card above.
Census & demographics
- Census place
- Pahrump, NV
- County
- Nye County · 47,491 people
- City population
- 47,491
- Metro
- Pahrump, NV
- Population (ZIP)
- 8,141
- Household income
- $77,991
- Rent vs Own
- Severe rent burden
- 52.0
Population outlook (Nye County) Hauer SSP2
- Today (2025)
- 40,727 people
- By 2030
- 38,812 · -4.7%
- By 2040
- 33,952 · -16.6%
- By 2050
- 29,393 · -27.8%
- By 2075
- 21,122 · -48.1%
- By 2100
- 14,400 · -64.6%
Race, ethnicity, and origin ACS 2023
- Neighborhood character
- Predominantly White (67%)
- Race & ethnicity
- White 67% Hispanic / Latino 18% Two or more races 8% Asian 2% Black 2% Native American 2% Pacific Islander 1%
- Hispanic origin (detail)
- Mexican 15% Puerto Rican 1%
- Common ancestry
- Lithuanian 5% Romanian 2% Portuguese 2%
- Foreign-born
- 6% · Canada
- Languages at home
- 90% English-only · Spanish 7% Other Asian/Pacific 1% Other Indo-European 1%
Political lean MEDSL · Nye
- 2024 margin
- Solid R (+42.2) · D 28.0% · R 70.2% · Other 1.8%
- 2008→2024 swing
- -28.8pp toward R · 2008: -13.4pp · 2024: -42.2pp
- All cycles
- 2024: R+42.2 2020: R+40.4 2016: R+42.0 2012: R+24.2 2008: R+13.4
Not yet ingested
- Civics
- —
Market trends
- HPI YoY
- ▲ 2.78%
- Current HPI
- 266.2633
- Rent YoY
- —
- Metro
- Pahrump, NV
- State GDP YoY
- ▲ 3.08%
- F500 in state
- 6
Industry mix (Fortune 500 HQ in NV)
| Industry | F500 HQs | Revenue |
|---|---|---|
| Hotels / Casinos | 3 | $36B |
|
||
Price history
+559.8% since first listed10 events — show timeline
- 2026-05-27 Listed $329,900 GLVAR
- 2025-11-12 Sold (Public Records) $190,000 Public Records
- 2025-11-12 Listed $190,000 GLVAR
- 2017-03-21 Sold (Public Records) $77,900 Public Records
- 2017-03-21 Sold (MLS) $77,900 GLVAR
- 2017-02-27 Contingent — GLVAR
- 2017-02-14 Listed $77,900 GLVAR
- 2013-01-02 Listing Removed — GLVAR
- 2012-07-13 Contingent — GLVAR
- 2012-06-22 Listed $50,000 GLVAR
Property tax history
-0.6%/yrLatest (2025): $1,070 · +6.1% YoY. Source: county tax records.
Cash-flow waterfall
monthlySold comps — $/sqft
last 12 mo · ≤1 miLoading sold comps…