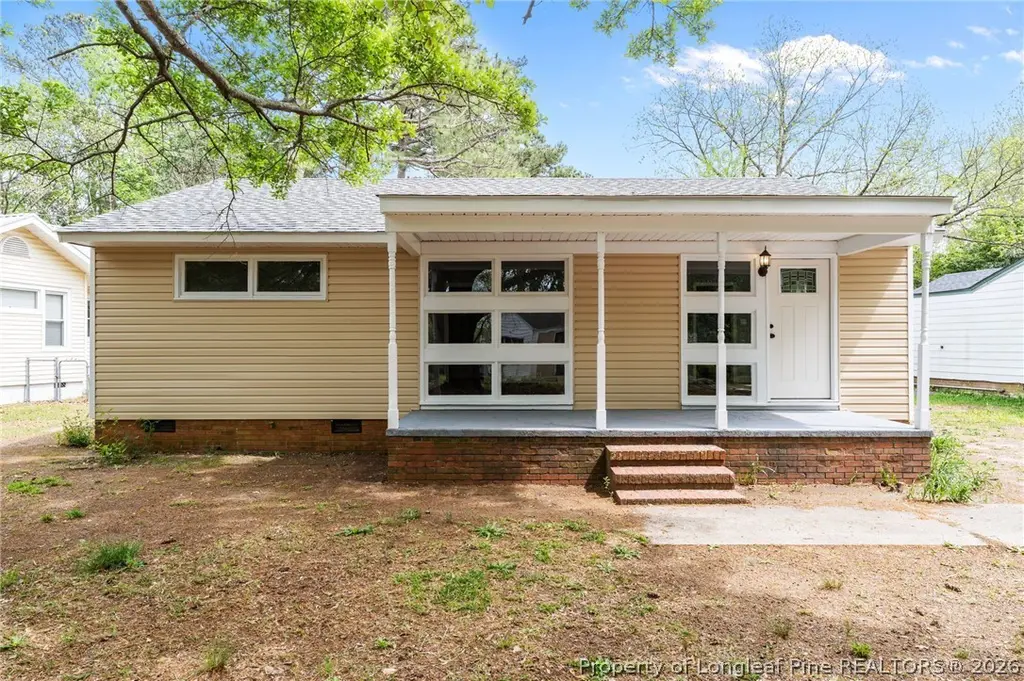
1032 Elizabeth Dr · Laurinburg, NC
Flood risk 1/10 · Minimal
- FEMA flood zone
- X (unshaded)
- Chance of flooding over 30 yrs
- 0.0%
- Est. flood insurance / yr
- $507 – $1,088
Fire risk 4/10 · Minor
- Est. fire insurance / yr
- $906 – $1,684
Heat risk 7/10 · Major
- Hot days now (above 107°F)
- 7 days/yr
- Hot days in 30 yrs
- 16 days/yr
Wind risk 7/10 · Major
- Chance of severe wind over 30 yrs
- 78.0%
Air-quality risk 1/10 · Minimal
- Unhealthy air days now
- 0 days/yr
- Unhealthy air days in 30 yrs
- 0 days/yr
Risk factors via First Street. Map © Google.
Why this score? — see what drove the D+ grade
The composite is a weighted blend of 9 inputs, each scored 0–100. Each bar is that input's sub-score; the figure is the points it added to the 100-point composite (weight × sub-score).
- Cash flow +19.3/30.0
- ARV discount +7.5/15.0
- DSCR +6.1/10.0
- 1% rule +3.9/10.0
- Livability +2.8/5.0
- Rent growth +2.5/5.0
- Condition / age +2.5/5.0
- Schools +2.1/10.0
- Appreciation +0.5/10.0
$119,000
🖨 Deal sheet 📄 Offer letter ✓ Due diligence
Listing remarks
Welcome to this updated 3-bedroom, 1-bath home in Laurinburg! With a long list of recent upgrades, this property offers a fresh, modern feel with the big-ticket items already taken care of. Improvements include: new siding, roof, flooring, paint throughout, cabinets, bath/shower combo, doors, HVAC, electrical panels, water heater, carpet, and more! The property also features stainless steel appliances, a large screened-in porch, spacious backyard, front porch, and a storage shed, providing both functionality and flexibility. Connected to city water and sewer, this home is a great option for investors looking to expand their portfolio or first-time buyers seeking a home with major update
Key facts
- New siding
- New flooring
- New paint
Tags
Property features AI
Exterior
- Utilities: Public water; Public sewer
- Home design: Single-family residence; One-level home (1 story); Vinyl siding
- Construction: Vinyl siding construction
- Exterior features: Lot listed (no detailed lot size provided)
Interior
- Kitchen: Refrigerator
- Bedrooms: Total of 5 rooms (includes bedrooms and living spaces)
- Flooring: Hardwood; Tile
- Bathrooms: 1 full bathroom
- Heating & cooling: Central air conditioning
- Interior features: Refrigerator included; Hardwood and tile flooring; No fireplace; Crawl space basement
- Laundry & utility: Crawl space (utility access)
Neighborhood map
What this means for you Summary
Snapshot
- This is a 2-bed/1.0-bath single-family listed at $119k.
Deal economics
- At list price, monthly cash flow is $130 ($2k/yr) — positive.
- The deal already cash-flows at list — no discount required.
- To meet the 1% rule (rent ≥ 1% of price), the offer needs to be $106k (10.8% below list).
- Recommended offer: $106k (10.8% below list) — sets the bar for 1% rule.
- Cap rate 7.6% vs local median 5.1% in Laurinburg — top-decile yield for the area; either an underpriced asset or a hidden risk that comps aren't pricing in. Stress-test before assuming the spread holds.
Location & tenants
- Location reads 56/100 on livability (#632 in NC) — a working-class tenant base; expect higher turnover. Strengths: cost of living A+, housing A-; Watch: health & safety C-, crime F, amenities F.
- Scotland County Schools (town): math 23% / reading 28% proficiency, ranked #160 of 178 in NC (top 90%) — low school quality limits family demand, transient renter base, plan for 1-2y turnover; 72% free/reduced lunch — lower-income household profile, screen leases tightly.
- Zoned schools: Scotland High School (math 45% / reading 44%, grade F, #352 of 535 statewide, top 68%, 1,445 students, 98% FRL) — zoned schools average 98% FRL vs 72% district-wide (26 pts higher); higher-poverty schools than district average — tighter screening recommended.
- Zoned-school proficiency averages 44% at this address vs 26% district-wide (+19 pts) — the actual schools serving this property are materially stronger than the Scotland County Schools average implies; a family-tenant draw the district grade alone would hide.
- Market conditions: 158 active listings in the ZIP; 70 units permitted in Scotland County in 2024 (0 in 5+ unit buildings).
Forward outlook
- Local home prices are declining (-3.0%/yr); year-one equity from $823 of loan paydown is wiped out by about $4k of value loss. Plan a longer hold.
- Scotland County population projected at -20% by 2050 — secular population decline; favor cash flow + early exit over multi-decade hold.
Negotiation context
- It's been on market 70 days — a 6% lower offer ($112k) is reasonable based on typical stale-listing flexibility.
- Current owner paid $45k; list at $119k implies a 164% gain — meaningful room to come down on a strong offer.
Risks & watch-outs
- Climate carrying-cost: major wind risk, 78% chance of damaging wind over 30y; extreme-heat days projected 7→16/yr by 2055 (HVAC capex compounding) — expect insurance premiums to compound above CPI over the hold.
Questions for the listing agent
- It's been on market 70 days. Have you received any prior offers? Is the seller open to a 11% concession, seller financing, or rate buy-down credit?
- Built in 1965 — when were the roof, HVAC, electrical panel, plumbing, and water heater last replaced?
- Why hasn't it sold? Are there any deal-killer items the seller is aware of (foundation, flood, title, zoning, code violations)?
- Is there a deadline driving the sale (1031 exchange, divorce, estate, relocation)? That informs how much negotiation room exists.
- Schools are F-rated, which usually means shorter tenancies and higher turnover. Who's the typical renter profile here, and what's been the actual vacancy rate?
- Crime grade is F in this area — have there been break-ins, vandalism, or insurance claims at this property in the last 3 years? What carrier currently insures it and at what premium?
- The area grade is low — what's the realistic commute time and amenity access for the typical tenant pool here? Any planned neighborhood developments (good or bad) we should know about?
- What's the average days-on-market for RENTAL listings here right now (not sales)? A rising rental-DOM trend means longer vacancies and softer asking-rent achievability than the comps imply.
- What's the recent tenant-quality profile in this submarket — average credit score on applications, eviction rate, late-payment / NSF rate, and stable-employment percentage? A property-management company in the area should have these aggregated.
- How much new for-sale + rental construction is in the pipeline within 1–3 miles? Heavy new supply typically softens prices + rents 12–24 months out; constrained supply supports both.
Investment metrics
- 1% rule
- 0.89% ✗
- Cap rate
- 7.61%
- Cash-on-cash
- 4.69%
- DSCR
- 1.21
- GRM
- 9.3
CMA / ARV
- ARV (on-the-fly)
- $78,625
- Comps found
- 12
Show comp detail 12 sales within ~0.75 mi
| Address | Dist | Beds/Ba | Sqft | Sold | Price | $/sf | Match |
|---|---|---|---|---|---|---|---|
| 311 Wilson St | 0.27mi | 2/1.0 | 926 (+0%) | 4mo | $65,000 | $70 | 84 |
| 1115 S Pine St | 0.11mi | 2/1.0 | 945 (+2%) | 12mo | $100,000 | $106 | 81 |
| 1111 Hammond Dr | 0.04mi | 3/1.0 (+1) | 960 (+4%) | 13mo | $68,000 | $71 | 76 |
| 423 Midland Way | 0.38mi | 2/1.0 | 1,005 (+9%) | 4mo | $76,500 | $76 | 65 |
| 720 Spruce St | 0.34mi | 2/1.0 | 862 (-7%) | 10mo | $37,000 | $43 | 65 |
| 714 S Pine St | 0.35mi | 3/1.5 (+1) | 986 (+7%) | 2mo | $138,000 | $140 | 64 |
| 907 Biggs St | 0.19mi | 2/1.0 | 823 (-11%) | 16mo | $53,000 | $64 | 60 |
| 519 Atkinson St | 0.57mi | 2/1.0 | 850 (-8%) | 4mo | $97,000 | $114 | 57 |
| 718 Anson Ave | 0.56mi | 2/1.0 | 839 (-9%) | 7mo | $105,000 | $125 | 53 |
| 728 Anson Ave | 0.52mi | 2/1.0 | 824 (-11%) | 11mo | $100,000 | $121 | 49 |
| 514 E Covington St | 0.67mi | 2/1.0 | 822 (-11%) | 7mo | $70,000 | $85 | 44 |
| 522 S Caledonia Rd | 0.59mi | 3/1.0 (+1) | 816 (-12%) | 6mo | $56,500 | $69 | 42 |
Match score weights: distance 35% · size 25% · config 20% · recency 20%. Top-matched comps best support the ARV.
Projected returns pro-forma
-3.0% appreciation · 3.0% rent growth · sell at horizon
- IRR
- -9.0%
- Equity multiple
- 0.67×
- Total profit
- $-11,048
- Equity at exit
- $17,743
- IRR
- 0.4%
- Equity multiple
- 1.02×
- Total profit
- $832
- Equity at exit
- $10,289
Cash invested: $33,320 (down + closing). Projections, not guarantees.
Landlord ↔ Tenant lean methodology
- Overall (STATE)
- 85 Strongly Landlord-Friendly
- State North Carolina
- 85 Strongly Landlord-Friendly · R+3
- County
- — inherits STATE
- City
- — inherits STATE
ZIP-level market 28352
- Home prices YoY
- -3.4%
- Active inventory
- 158
- Price-to-rent
- 9.3×
Monthly cashflow live
- Estimated rent
- $1,061 medium interval (Pro) →
- Mortgage (P&I)
- −$624
- Tax from tax record
- −$35 /mo · $414/yr
- Insurance
- −$50
- HOA
- −$0
- Vacancy / Maint / Mgmt
- −$223
- Net cashflow
- $130
Break-even live
UW: 25.0% down · 7.5% · 30yr · 1.5% tax · 5.0% vac · 8.0% maint · 8.0% mgmt
Financing live
Cash to close
- Down payment
- $29,750
- Closing costs
- $3,570
- Reserves months
- —
- Total cash needed
- —
Loan-product check · same deal, 3 products live
Conventional
25% down · 7.5% · 30yr
- Down + closing
- —
- Monthly P&I
- —
- Monthly cashflow
- —
- DSCR
- —
- Eligible?
- —
Personal DTI + credit; lowest rate.
DSCR
20% down · 8.5% · 30yr
- Down + closing
- —
- Monthly P&I
- —
- Monthly cashflow
- —
- DSCR
- —
- Eligible?
- —
No personal income docs; deal must DSCR.
Hard money
10% down · 12.0% · 12mo
- Down + closing
- —
- Monthly P&I
- —
- Monthly cashflow
- —
- DSCR
- —
- Eligible?
- —
Short-term bridge; refi at stabilization.
Listing history 21 events
-
2026-06-18days on market $119,000 Active 70 DOM
-
2026-06-17days on market $119,000 Active 69 DOM
-
2026-06-16days on market $119,000 Active 68 DOM
-
2026-06-15pricedays on market $119,000 Active 67 DOM
-
2026-06-14days on market $124,000 Active 65 DOM
-
2026-06-13days on market $124,000 Active 64 DOM
-
2026-06-10days on market $124,000 Active 62 DOM
-
2026-06-09days on market $124,000 Active 61 DOM
-
2026-06-08days on market $124,000 Active 60 DOM
-
2026-06-07days on market $124,000 Active 59 DOM
-
2026-06-05days on market $124,000 Active 56 DOM
-
2026-06-03days on market $124,000 Active 55 DOM
-
2026-06-02days on market $124,000 Active 54 DOM
-
2026-06-01days on market $124,000 Active 53 DOM
-
2026-05-31days on market $124,000 Active 52 DOM
-
2026-05-30pricedays on market $124,000 Active 51 DOM
-
2026-05-19price $129,000
-
2026-05-01price $134,000
-
2026-04-09$139,000 Active
-
2025-10-15soldstatus $45,000
-
2005-06-01soldstatus $57,500
ⓘ Source: listings_history table (triggers on properties + properties_extension) + one-shot
backfill from property_details.listing_events for pre-trigger history.
Tax reassessment forecast NC · Resets to sale price
- Current annual tax
- $414 · $35/mo
- Projected year-2 tax
- $976 · $81/mo
- Expected delta
- +$562/yr (+$47/mo · 135.7%)
ⓘ Screening estimate from a state-policy table — verify with the county assessor before closing.
Climate risk First Street
- Flood 1/10 Low FEMA zone X (unshaded) · 0% chance over 30 yrs
- Wildfire 4/10 Moderate
- Heat 7/10 Severe 7 d/yr ≥107°F today · 16 d/yr by 30 yrs out
- Wind 7/10 Severe 78% chance of damaging wind over 30 yrs
- Air quality 1/10 Low 0 unhealthy d/yr today · 0 by 30 yrs out
Nearby sold comps map
Loading sold comps map…
Walkable amenities ~0.75 mi
Loading nearby amenities…
Taxation est. · year 1
- Rental income
- $12,733
- − Mortgage interest
- −$6,666
- − Property taxes
- −$414
- − Insurance
- −$595
- − Repairs & maintenance
- −$1,019
- − Management
- −$1,019
- − Depreciation
- −$3,462
- Taxable loss
- −$441
- Est. tax savings @ 24.0%
- +$106
- After-tax cash flow
- $1,667/yr
For passive investors: Depreciation is non-cash, so a rental often shows a tax loss while cash-flowing — sheltering income. Rental losses are passive: they offset passive income freely, and up to $25,000/yr can offset ordinary (W-2) income if you actively participate and your MAGI is under $100k (phasing out to $0 by $150k); unused losses carry forward. On sale, claimed depreciation is recaptured at up to 25%, and gains may owe capital-gains tax (a 1031 exchange can defer both). Figures are a year-1 estimate at your 24.0% rate — not tax advice; consult a CPA.
Schools (NCES district)
- District
- Scotland County Schools
- NCES district ID
- 3704200
- Math proficiency
- 23% ▼ -5.00%
- Reading proficiency
- 28% ▼ -3.00%
- Median HH income
- $31,203
- Composite
- 20.66/100
- National rank
- #8536
- State rank
- #160 of 178 in NC
Livability — Laurinburg
- Score
- 56/100
- State rank
- #632
- US rank
- #22962
Category grades
Schools grade is shown separately in the Schools card above.
Census & demographics
- Census place
- Laurinburg, NC
- City population
- 24,177
- Population (ZIP)
- 24,177
Population outlook (Scotland County) Hauer SSP2
- Today (2025)
- 33,331 people
- By 2030
- 32,017 · -3.9%
- By 2040
- 29,290 · -12.1%
- By 2050
- 26,554 · -20.3%
- By 2075
- 19,857 · -40.4%
- By 2100
- 13,851 · -58.4%
Race, ethnicity, and origin ACS 2023
- Neighborhood character
- Diverse neighborhood (Simpson 0.69)
- Race & ethnicity
- Black 42% White 37% Native American 11% Two or more races 6% Hispanic / Latino 4% Asian 1%
- Common ancestry
- Serbian 2% Slovak 1% Italian 1%
- Foreign-born
- 3% · Canada, China
- Languages at home
- 94% English-only · Spanish 3% Chinese 1%
Political lean MEDSL · Scotland
- 2024 margin
- Lean R (+6.9) · D 46.2% · R 53.1%
- 2008→2024 swing
- -22.0pp toward R · 2008: 15.1pp · 2024: -6.9pp
- All cycles
- 2024: R+6.9 2020: R+1.9 2016: D+7.8 2012: D+16.6 2008: D+15.1
Not yet ingested
- Civics
- —
Market trends
- HPI YoY
- ▼ -9.08%
- Current HPI
- 255.331
- Rent YoY
- —
- Metro
- —
- State GDP YoY
- ▲ 3.28%
- F500 in state
- 26
Industry mix (Fortune 500 HQ in NC)
| Industry | F500 HQs | Revenue |
|---|---|---|
| Financial Services | 2 | $213B |
|
||
| Retail | 2 | $95B |
|
||
| Industrial Conglomerate | 1 | $38B |
|
||
| Metals / Steel | 1 | $35B |
|
||
| Utilities | 1 | $30B |
|
||
| Industrial Machinery | 1 | $19B |
|
||
Price history
+124.3% since first listed5 events — show timeline
- 2026-05-19 Price Changed $129,000 LPRMLS
- 2026-05-01 Price Changed $134,000 LPRMLS
- 2026-04-09 Listed $139,000 LPRMLS
- 2025-10-15 Sold (Public Records) $45,000 Public Records
- 2005-06-01 Sold (Public Records) $57,500 Public Records
Property tax history
+2.0%/yrLatest (2025): $414 · +0.0% YoY. Source: county tax records.
Cash-flow waterfall
monthlySold comps — $/sqft
last 12 mo · ≤1 miLoading sold comps…