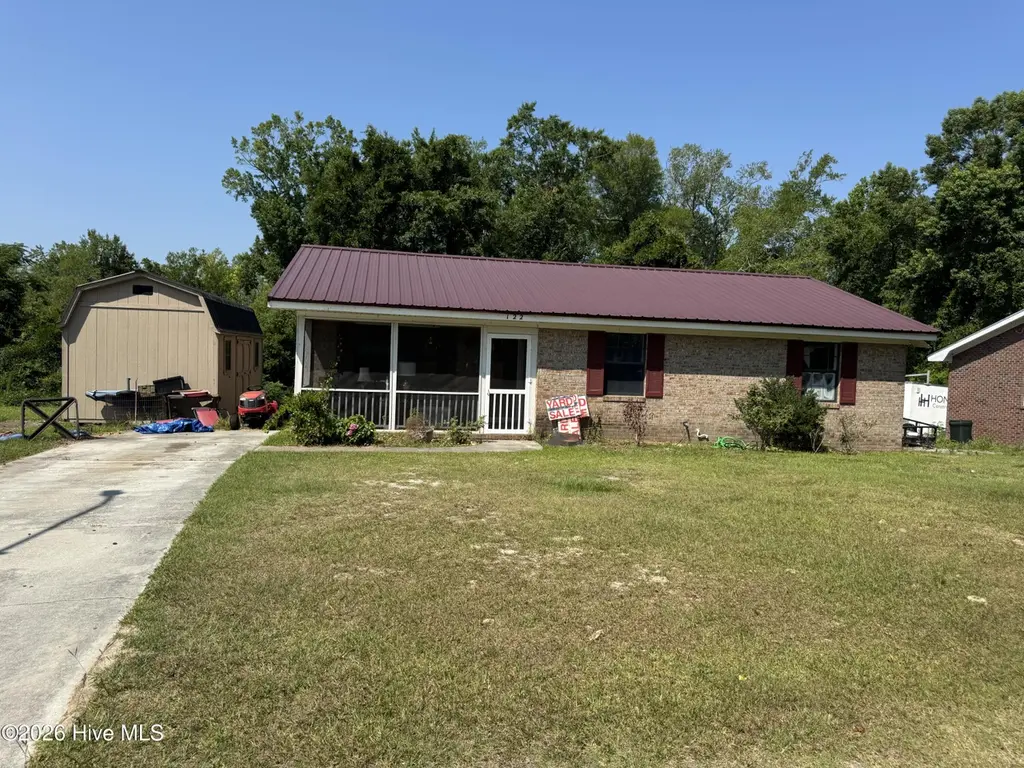
122 Hampton Dr · Wrightsboro, NC
Flood risk 1/10 · Minimal
- FEMA flood zone
- X (unshaded)
- Chance of flooding over 30 yrs
- 0.0%
- Est. flood insurance / yr
- $507 – $1,088
Fire risk 6/10 · Moderate
- Est. fire insurance / yr
- $906 – $1,684
Heat risk 9/10 · Severe
- Hot days now (above 105°F)
- 7 days/yr
- Hot days in 30 yrs
- 19 days/yr
Wind risk 8/10 · Major
- Chance of severe wind over 30 yrs
- 99.0%
Air-quality risk 2/10 · Minimal
- Unhealthy air days now
- 1 days/yr
- Unhealthy air days in 30 yrs
- 2 days/yr
Risk factors via First Street. Map © Google.
Why this score? — see what drove the C grade
The composite is a weighted blend of 9 inputs, each scored 0–100. Each bar is that input's sub-score; the figure is the points it added to the 100-point composite (weight × sub-score).
- Cash flow +19.6/30.0
- ARV discount +13.6/15.0
- DSCR +6.2/10.0
- Schools +4.3/10.0
- 1% rule +3.9/10.0
- Livability +3.1/5.0
- Rent growth +2.5/5.0
- Condition / age +2.5/5.0
- Appreciation +0.0/10.0
$249,900
🖨 Deal sheet 📄 Offer letter ✓ Due diligence
Listing remarks
This is an estate sale, SOLD AS IS. No repairs will be made. Welcome to 122 Hampton Drive, a charming brick ranch nestled in the established Walnut Hills community of Castle Hayne. This 3-bedroom, 1.5-bath home offers comfortable one-level living with a functional floor plan and timeless appeal. Inside, you'll find a bright living area, spacious bedrooms, and an inviting layout designed for everyday living. The brick exterior provides lasting durability and low-maintenance ownership, while the generous lot offers plenty of room for outdoor entertaining, gardening, or relaxing in your private backyard. Conveniently located just minutes from Wilmington, I-140, Wilmington International Airport
Key facts
- Generous lot
- Bright living area
- Private backyard
Tags
Property features AI
Exterior
- Parking: Off-street paved parking
- Utilities: Public water; Sewer available; Water available
- Home design: Single-family residence; One-story; Entry level: 1
- Construction: Brick veneer and frame construction; Slab foundation; Built using typical residential materials
- Exterior features: Screened porch; Front porch; Shingle roof; Paved road access; Has a view; No fencing
Interior
- Bedrooms: Master on main level
- Bathrooms: 1 full bathroom; 1 half bathroom
- Heating & cooling: Central air conditioning; Electric heating; Heat pump
- Interior features: Master bedroom on main level; Ceiling fans
Neighborhood map
What this means for you Summary
Snapshot
- This is a 3-bed/1.5-bath single-family listed at $250k.
Deal economics
- At list price, monthly cash flow is $290 ($3k/yr) — positive.
- The deal already cash-flows at list — no discount required.
- To meet the 1% rule (rent ≥ 1% of price), the offer needs to be $222k (11.3% below list).
- Recommended offer: $222k (11.3% below list) — sets the bar for 1% rule.
- Cap rate 7.7% vs local median 2.6% in Wrightsboro — top-decile yield for the area; either an underpriced asset or a hidden risk that comps aren't pricing in. Stress-test before assuming the spread holds.
Location & tenants
- Location reads 62/100 on livability (#467 in NC) — a middle-class / working-renter tenant base. Strengths: cost of living A+, housing A+; Watch: health & safety D, amenities F, commute F.
- New Hanover County Schools (urban): math 48% / reading 53% proficiency, ranked #61 of 178 in NC (top 34%) — acceptable for families but not a draw, mixed tenant base, ~2y average lease.
- Zoned schools: Wrightsboro Elementary (math 21% / reading 29%, grade F, #1,101 of 1,410 statewide, top 79%, 522 students, 98% FRL); Holly Shelter Middle (math 39% / reading 43%, grade F, #209 of 475 statewide, top 45%, 858 students, 100% FRL); Emsley A Laney High (math 62% / reading 63%, grade B-, #179 of 535 statewide, top 34%, 2,220 students, 42% FRL) — zoned schools average 80% FRL vs 42% district-wide (38 pts higher); higher-poverty schools than district average — tighter screening recommended.
- Market conditions: 185 active listings in the ZIP; 2,581 units permitted in New Hanover County in 2024 (1,185 in 5+ unit buildings).
- This rent runs 37% of the median local income ($72k/yr) — at the standard rent-burdened threshold; future hikes will face affordability resistance.
Forward outlook
- Local home prices are declining (-3.0%/yr); year-one equity from $2k of loan paydown is wiped out by about $7k of value loss. Plan a longer hold.
- New Hanover County population projected at +37% by 2050 — long-run rental-demand tailwind backs the buy-and-hold thesis.
Negotiation context
- Only 6 days on market — expect competitive offers; lowballing is unlikely to land.
- Current owner paid $82k; list at $250k implies a 207% gain — meaningful room to come down on a strong offer.
Risks & watch-outs
- Climate carrying-cost: severe wind risk, 99% chance of damaging wind over 30y; major wildfire risk; extreme-heat days projected 7→19/yr by 2055 (HVAC capex compounding) — expect insurance premiums to compound above CPI over the hold.
Questions for the listing agent
- Is there a deadline driving the sale (1031 exchange, divorce, estate, relocation)? That informs how much negotiation room exists.
- Schools are F-rated, which usually means shorter tenancies and higher turnover. Who's the typical renter profile here, and what's been the actual vacancy rate?
- What's the average days-on-market for RENTAL listings here right now (not sales)? A rising rental-DOM trend means longer vacancies and softer asking-rent achievability than the comps imply.
- What's the recent tenant-quality profile in this submarket — average credit score on applications, eviction rate, late-payment / NSF rate, and stable-employment percentage? A property-management company in the area should have these aggregated.
- How much new for-sale + rental construction is in the pipeline within 1–3 miles? Heavy new supply typically softens prices + rents 12–24 months out; constrained supply supports both.
Investment metrics
- 1% rule
- 0.89% ✗
- Cap rate
- 7.68%
- Cash-on-cash
- 4.97%
- DSCR
- 1.22
- GRM
- 9.4
CMA / ARV
- ARV (on-the-fly)
- $289,416
- Comps found
- 12
Show comp detail 12 sales within ~0.75 mi
| Address | Dist | Beds/Ba | Sqft | Sold | Price | $/sf | Match |
|---|---|---|---|---|---|---|---|
| 3107 Harvest Rd | 0.48mi | 3/2.0 | 1,150 (-2%) | 1mo | $299,999 | $261 | 72 |
| 3021 Evening Rd | 0.09mi | 3/2.0 | 1,300 (+11%) | 8mo | $284,900 | $219 | 68 |
| 304 Cottonwood Ln | 0.26mi | 3/1.5 | 1,050 (-10%) | 9mo | $219,390 | $209 | 64 |
| 3132 Reminisce Rd | 0.51mi | 3/2.0 | 1,117 (-4%) | 9mo | $260,000 | $233 | 60 |
| 12 Diamond Dr | 0.16mi | 2/1.5 (-1) | 1,022 (-12%) | 11mo | $210,000 | $205 | 57 |
| 3127 Memory Ln | 0.56mi | 3/2.0 | 1,220 (+4%) | 8mo | $303,000 | $248 | 57 |
| 3019 Harvest Rd | 0.39mi | 3/2.0 | 1,084 (-7%) | 13mo | $295,000 | $272 | 57 |
| 3003 Memory Ln | 0.58mi | 3/2.0 | 1,218 (+4%) | 9mo | $310,000 | $255 | 57 |
| 321 Bountiful Ln | 0.44mi | 3/1.5 | 1,031 (-12%) | 9mo | $265,000 | $257 | 53 |
| 3119 Memory Ln | 0.57mi | 3/2.0 | 1,232 (+6%) | 16mo | $299,000 | $243 | 49 |
| 3107 Memory Ln | 0.57mi | 3/2.0 | 1,077 (-8%) | 11mo | $312,000 | $290 | 49 |
| 3006 Tinga Ct | 0.45mi | 2/2.0 (-1) | 1,011 (-13%) | 17mo | $250,000 | $247 | 36 |
Match score weights: distance 35% · size 25% · config 20% · recency 20%. Top-matched comps best support the ARV.
Projected returns pro-forma
-3.0% appreciation · 3.0% rent growth · sell at horizon
- IRR
- -8.6%
- Equity multiple
- 0.68×
- Total profit
- $-22,175
- Equity at exit
- $37,261
- IRR
- 0.8%
- Equity multiple
- 1.06×
- Total profit
- $3,919
- Equity at exit
- $21,607
Cash invested: $69,972 (down + closing). Projections, not guarantees.
Landlord ↔ Tenant lean methodology
- Overall (STATE)
- 85 Strongly Landlord-Friendly
- State North Carolina
- 85 Strongly Landlord-Friendly · R+3
- County
- — inherits STATE
- City
- — inherits STATE
ZIP-level market 28429
- Active inventory
- 185
- Price-to-rent
- 9.4×
Monthly cashflow live
- Estimated rent
- $2,217 medium interval (Pro) →
- Mortgage (P&I)
- −$1,311
- Tax from tax record
- −$47 /mo · $562/yr
- Insurance
- −$104
- HOA
- −$0
- Vacancy / Maint / Mgmt
- −$465
- Net cashflow
- $290
Break-even live
UW: 25.0% down · 7.5% · 30yr · 1.5% tax · 5.0% vac · 8.0% maint · 8.0% mgmt
Financing live
Cash to close
- Down payment
- $62,475
- Closing costs
- $7,497
- Reserves months
- —
- Total cash needed
- —
Loan-product check · same deal, 3 products live
Conventional
25% down · 7.5% · 30yr
- Down + closing
- —
- Monthly P&I
- —
- Monthly cashflow
- —
- DSCR
- —
- Eligible?
- —
Personal DTI + credit; lowest rate.
DSCR
20% down · 8.5% · 30yr
- Down + closing
- —
- Monthly P&I
- —
- Monthly cashflow
- —
- DSCR
- —
- Eligible?
- —
No personal income docs; deal must DSCR.
Hard money
10% down · 12.0% · 12mo
- Down + closing
- —
- Monthly P&I
- —
- Monthly cashflow
- —
- DSCR
- —
- Eligible?
- —
Short-term bridge; refi at stabilization.
Listing history 6 events
-
2026-06-18days on market $249,900 Active 6 DOM
-
2026-06-17days on market $249,900 Active 5 DOM
-
2026-06-16days on market $249,900 Active 4 DOM
-
2026-06-15days on market $249,900 Active 3 DOM
-
2026-06-13remarks 699-char remark
-
2026-06-13$249,900 Active 1 DOM
ⓘ Source: listings_history table (triggers on properties + properties_extension) + one-shot
backfill from property_details.listing_events for pre-trigger history.
Tax reassessment forecast NC · Resets to sale price
- Current annual tax
- $562 · $47/mo
- Projected year-2 tax
- $2,049 · $171/mo
- Expected delta
- +$1,487/yr (+$124/mo · 264.5%)
ⓘ Screening estimate from a state-policy table — verify with the county assessor before closing.
Climate risk First Street
- Flood 1/10 Low FEMA zone X (unshaded) · 0% chance over 30 yrs
- Wildfire 6/10 Major
- Heat 9/10 Extreme 7 d/yr ≥105°F today · 19 d/yr by 30 yrs out
- Wind 8/10 Severe 99% chance of damaging wind over 30 yrs
- Air quality 2/10 Low 1 unhealthy d/yr today · 2 by 30 yrs out
Nearby sold comps map
Loading sold comps map…
Walkable amenities ~0.75 mi
Loading nearby amenities…
Taxation est. · year 1
- Rental income
- $26,600
- − Mortgage interest
- −$13,998
- − Property taxes
- −$562
- − Insurance
- −$1,250
- − Repairs & maintenance
- −$2,128
- − Management
- −$2,128
- − Depreciation
- −$7,270
- Taxable loss
- −$736
- Est. tax savings @ 24.0%
- +$177
- After-tax cash flow
- $3,653/yr
For passive investors: Depreciation is non-cash, so a rental often shows a tax loss while cash-flowing — sheltering income. Rental losses are passive: they offset passive income freely, and up to $25,000/yr can offset ordinary (W-2) income if you actively participate and your MAGI is under $100k (phasing out to $0 by $150k); unused losses carry forward. On sale, claimed depreciation is recaptured at up to 25%, and gains may owe capital-gains tax (a 1031 exchange can defer both). Figures are a year-1 estimate at your 24.0% rate — not tax advice; consult a CPA.
Schools (NCES district)
- District
- New Hanover County Schools
- NCES district ID
- 3703330
- Math proficiency
- 48% ▼ -3.00%
- Reading proficiency
- 53% ▬ 0.00%
- Median HH income
- $49,406
- Composite
- 43.13/100
- National rank
- #3081
- State rank
- #61 of 178 in NC
Livability — Wrightsboro
- Score
- 62/100
- State rank
- #467
- US rank
- #17023
Category grades
Schools grade is shown separately in the Schools card above.
Census & demographics
- Census place
- Wrightsboro, NC
- County
- New Hanover County · 232,153 people
- Metro
- Wilmington, NC
- Population (ZIP)
- 9,662
- Household income
- $72,337
- Rent vs Own
- Severe rent burden
- 110.0
Population outlook (New Hanover County) Hauer SSP2
- Today (2025)
- 259,517 people
- By 2030
- 279,586 · +7.7%
- By 2040
- 318,223 · +22.6%
- By 2050
- 354,831 · +36.7%
- By 2075
- 437,158 · +68.5%
- By 2100
- 486,769 · +87.6%
Race, ethnicity, and origin ACS 2023
- Neighborhood character
- Predominantly White (71%)
- Race & ethnicity
- White 71% Black 14% Hispanic / Latino 8% Two or more races 6%
- Hispanic origin (detail)
- Mexican 8%
- Common ancestry
- Italian 3% Slovak 3% Lithuanian 2%
- Foreign-born
- 3% · Canada
- Languages at home
- 94% English-only · Spanish 5% German/W. Germanic 1%
Political lean MEDSL · New Hanover
- 2024 margin
- Toss-up / Even · D 49.8% · R 49.1% · Other 1.1%
- 2008→2024 swing
- +2.0pp toward D · 2008: -1.4pp · 2024: 0.6pp
- All cycles
- 2024: D+0.6 2020: D+2.1 2016: R+4.1 2012: R+4.7 2008: R+1.4
Not yet ingested
- Civics
- —
Market trends
- HPI YoY
- ▼ -120.39%
- Current HPI
- 220.4084
- Rent YoY
- —
- Metro
- Wilmington, NC
- State GDP YoY
- ▲ 3.28%
- F500 in state
- 26
Industry mix (Fortune 500 HQ in NC)
| Industry | F500 HQs | Revenue |
|---|---|---|
| Financial Services | 2 | $213B |
|
||
| Retail | 2 | $95B |
|
||
| Industrial Conglomerate | 1 | $38B |
|
||
| Metals / Steel | 1 | $35B |
|
||
| Utilities | 1 | $30B |
|
||
| Industrial Machinery | 1 | $19B |
|
||
Price history
+206.6% since first listed2 events — show timeline
- 2026-06-12 Listed $249,900 Hive MLS
- 2004-09-01 Sold (Public Records) $81,500 Public Records
Property tax history
+0.2%/yrLatest (2025): $562 · -37.2% YoY. Source: county tax records.
Cash-flow waterfall
monthlySold comps — $/sqft
last 12 mo · ≤1 miLoading sold comps…