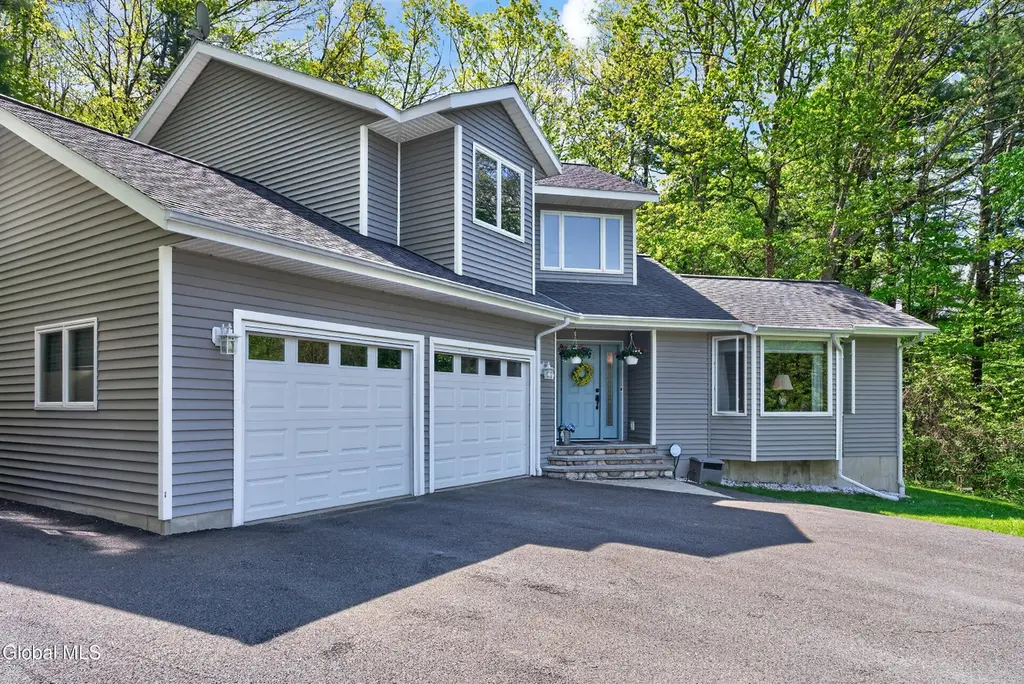
2598 New York 43 · Averill Park, NY
Flood risk 1/10 · Minimal
- FEMA flood zone
- X
- Chance of flooding over 30 yrs
- 0.0%
- Est. flood insurance / yr
- $473 – $860
Fire risk 4/10 · Minor
- Est. fire insurance / yr
- $691 – $1,283
Heat risk 2/10 · Minimal
- Hot days now (above 92°F)
- 7 days/yr
- Hot days in 30 yrs
- 16 days/yr
Wind risk 3/10 · Minor
- Chance of severe wind over 30 yrs
- 6.0%
Air-quality risk 2/10 · Minimal
- Unhealthy air days now
- 1 days/yr
- Unhealthy air days in 30 yrs
- 1 days/yr
Risk factors via First Street. Map © Google.
Why this score? — see what drove the D- grade
The composite is a weighted blend of 9 inputs, each scored 0–100. Each bar is that input's sub-score; the figure is the points it added to the 100-point composite (weight × sub-score).
- Appreciation +10.0/10.0
- ARV discount +7.5/15.0
- Cash flow +5.7/30.0
- Schools +5.7/10.0
- Livability +4.0/5.0
- Rent growth +2.5/5.0
- Condition / age +2.5/5.0
- 1% rule +1.4/10.0
- DSCR +0.1/10.0
$549,000
🖨 Deal sheet 📄 Offer letter ✓ Due diligence
Listing remarks MLS
Truly Unique Must See Contemporary Home Built in 2006. Private wooded 1.5 acre lot w/huge front yard & wrap-around Trex deck across from Glass Lake. Ceramic tile floors throughout gives the feel of Southern living, great for anyone w/allergy concerns and easy to maintain. Fabulous Kitchen w/island and s/s appliances, vaulted ceilings, 1st floor laundry, master bedroom suite w/window overlooking entry. Lots of windows bring in great light. Energy Efficient Propane Heat, A/C, Tankless H2O Heater & Generator. Excellent Condition
Key facts
- Water softener
- Finished basement
- Sunroom addition
Tags
Property features AI
Exterior
- Parking: Attached garage with garage door opener; 2-car garage; Total parking for 8 vehicles; Paved parking
- Security: Smoke detectors; Carbon monoxide detectors
- Utilities: Public sewer
- Home design: Single family residence; Updated / remodeled; Below-grade finished area
- Construction: Vinyl siding; Asphalt roof; Finished full basement
- Exterior features: Screened wrap-around porch; Composite deck and additional deck; Porch; Paved driveway; Outdoor lighting; Shed(s); Private, sloped, landscaped, wooded lot with views; Waterfront on Glass Lake
Interior
- Kitchen: Built-in electric oven; Range / Oven; Microwave; Dishwasher; Refrigerator
- Bedrooms: Primary bedroom on second floor; Additional bedrooms on second floor
- Flooring: Carpet; Ceramic tile
- Bathrooms: Two full bathrooms (located on second floor); One half bathroom (located on first floor)
- Heating & cooling: Forced air heating (propane and solar); Central air conditioning
- Interior features: Paddle fans; Walk-in closets; Built-in features; Ceramic tile baths; Chair rail; Double-pane, ENERGY STAR qualified windows; Finished full basement
- Laundry & utility: Main-level laundry room; Washer and dryer included; Tankless water heater
Neighborhood map
What this means for you Summary
Snapshot
- This is a 3-bed/2.5-bath single-family listed at $549k.
Deal economics
- At list price, monthly cash flow is $-1k ($-13k/yr) — negative.
- To cash-flow at today's rent, offer at most $351k (36.1% below list).
- To meet the 1% rule (rent ≥ 1% of price), the offer needs to be $350k (36.2% below list).
- Recommended offer: $350k (36.2% below list) — sets the bar for 1% rule.
Location & tenants
- Location reads 80/100 on livability (#101 in NY, #1,641 nationally) — a professional / high-income tenant draw. Strengths: crime A+, employment A+, housing A+; Watch: amenities F, commute F.
- Averill Park Central School District (rural): math 58% / reading 69% proficiency, ranked #169 of 590 in NY (top 29%) — acceptable for families but not a draw, mixed tenant base, ~2y average lease; only 14% free/reduced lunch — higher-income household profile.
- Zoned schools: Miller Hill School (math 57% / reading 67%, grade B, #675 of 2,108 statewide, top 35%, 385 students, 25% FRL); Averill Park High School (math 97% / reading 98%, grade A+, #49 of 1,100 statewide, top 5%, 897 students, 25% FRL).
- Zoned-school proficiency averages 80% at this address vs 64% district-wide (+16 pts) — the actual schools serving this property are materially stronger than the Averill Park Central School District average implies; a family-tenant draw the district grade alone would hide.
- Market conditions: 52 active listings in the ZIP; 1 comparable units currently listed for rent nearby; 405 units permitted in Rensselaer County in 2024 (224 in 5+ unit buildings).
Forward outlook
- In year one you build about $59k of equity ($4k loan paydown + $55k appreciation (10.0% local appreciation)).
- Rensselaer County population projected to shrink 6% by 2050 — rents likely to lag national; underwrite the cash flow, not the appreciation.
- By year 2, paydown + projected appreciation supports a ~$94k cash-out refi (75% LTV) — recoverable capital for the next deal without selling this one.
Negotiation context
- It's been on market 17 days — a 2% lower offer ($541k) is reasonable based on typical stale-listing flexibility.
- 5 sale attempts since 11y ago with the ask held roughly flat each time — persistent listings suggest the price (not the market) is what's stuck; bring a comps-based counter.
- Current owner paid $290k; list at $549k implies a 89% gain — meaningful room to come down on a strong offer.
Questions for the listing agent
- What do current leases actually rent for vs. the listed asking? Can we see a recent rent roll and the last 12 months of T-12 income?
- Is there a deadline driving the sale (1031 exchange, divorce, estate, relocation)? That informs how much negotiation room exists.
- Schools are B-rated — typically a magnet for longer-tenancy family renters. What's the average tenant stay here, and is there a school-zone premium baked into asking?
- The area grade is low — what's the realistic commute time and amenity access for the typical tenant pool here? Any planned neighborhood developments (good or bad) we should know about?
- What's the average days-on-market for RENTAL listings here right now (not sales)? A rising rental-DOM trend means longer vacancies and softer asking-rent achievability than the comps imply.
- What's the recent tenant-quality profile in this submarket — average credit score on applications, eviction rate, late-payment / NSF rate, and stable-employment percentage? A property-management company in the area should have these aggregated.
- How much new for-sale + rental construction is in the pipeline within 1–3 miles? Heavy new supply typically softens prices + rents 12–24 months out; constrained supply supports both.
Investment metrics
- 1% rule
- 0.64% ✗
- Cap rate
- 3.84%
- Cash-on-cash
- -8.77%
- DSCR
- 0.61
- GRM
- 13.1
CMA / ARV
No comps found within radius.
Projected returns pro-forma
10.0% appreciation · 3.0% rent growth · sell at horizon
- IRR
- 18.1%
- Equity multiple
- 2.48×
- Total profit
- $227,589
- Equity at exit
- $494,583
- IRR
- 16.9%
- Equity multiple
- 5.73×
- Total profit
- $726,676
- Equity at exit
- $1,066,586
Cash invested: $153,720 (down + closing). Projections, not guarantees.
Landlord ↔ Tenant lean methodology
- Overall (STATE)
- 15 Strongly Tenant-Friendly
- State New York
- 15 Strongly Tenant-Friendly · D+10
- County
- — inherits STATE
- City
- — inherits STATE
ZIP-level market 12018
- Home prices YoY
- 4.5%
- Active inventory
- 52
- Price-to-rent
- 13.1×
Monthly cashflow live
- Estimated rent
- $3,500 medium interval (Pro) →
- Mortgage (P&I)
- −$2,879
- Tax from tax record
- −$780 /mo · $9,362/yr
- Insurance
- −$229
- HOA
- −$0
- Vacancy / Maint / Mgmt
- −$735
- Net cashflow
- $-1,123
Break-even live
UW: 25.0% down · 7.5% · 30yr · 1.5% tax · 5.0% vac · 8.0% maint · 8.0% mgmt
Financing live
Cash to close
- Down payment
- $137,250
- Closing costs
- $16,470
- Reserves months
- —
- Total cash needed
- —
Loan-product check · same deal, 3 products live
Conventional
25% down · 7.5% · 30yr
- Down + closing
- —
- Monthly P&I
- —
- Monthly cashflow
- —
- DSCR
- —
- Eligible?
- —
Personal DTI + credit; lowest rate.
DSCR
20% down · 8.5% · 30yr
- Down + closing
- —
- Monthly P&I
- —
- Monthly cashflow
- —
- DSCR
- —
- Eligible?
- —
No personal income docs; deal must DSCR.
Hard money
10% down · 12.0% · 12mo
- Down + closing
- —
- Monthly P&I
- —
- Monthly cashflow
- —
- DSCR
- —
- Eligible?
- —
Short-term bridge; refi at stabilization.
Rent comps 1 comps
| Address | Beds | Baths | Sqft | Rent | $/sqft | DOM | Units | Dist |
|---|---|---|---|---|---|---|---|---|
| 204 Eastern Union Tpke Unit 1 Averill Park, NY | 3.0 | 3.0 | 2600 | $3,500 | $1.35 | 14d | 1 | 0.71mi |
Listing history 12 events
-
2026-06-18days on market $549,000 Active 17 DOM
-
2026-06-17days on market $549,000 Active 16 DOM
-
2026-06-16days on market $549,000 Active 15 DOM
-
2026-06-15days on market $549,000 Active 14 DOM
-
2026-06-14days on market $549,000 Active 12 DOM
-
2026-06-10days on market $549,000 Active 9 DOM
-
2026-06-09days on market $549,000 Active 8 DOM
-
2026-06-08days on market $549,000 Active 7 DOM
-
2026-06-07days on market $549,000 Active 6 DOM
-
2026-06-03days on market $549,000 Active 2 DOM
-
2026-06-01remarks 699-char remark
-
2026-06-01$549,000 Active 1 DOM
ⓘ Source: listings_history table (triggers on properties + properties_extension) + one-shot
backfill from property_details.listing_events for pre-trigger history.
Tax reassessment forecast NY · Partial reset (capped growth)
- Current annual tax
- $9,362 · $780/mo
- Projected year-2 tax
- $9,362 · $780/mo
- Expected delta
- $0/yr ($0/mo · 0.0%)
ⓘ Screening estimate from a state-policy table — verify with the county assessor before closing.
Climate risk First Street
- Flood 1/10 Low FEMA zone X · 0% chance over 30 yrs
- Wildfire 4/10 Moderate
- Heat 2/10 Low 7 d/yr ≥92°F today · 16 d/yr by 30 yrs out
- Wind 3/10 Moderate 6% chance of damaging wind over 30 yrs
- Air quality 2/10 Low 1 unhealthy d/yr today · 1 by 30 yrs out
Nearby sold comps map
Loading sold comps map…
Walkable amenities ~0.75 mi
Loading nearby amenities…
Taxation est. · year 1
- Rental income
- $42,000
- − Mortgage interest
- −$30,753
- − Property taxes
- −$9,362
- − Insurance
- −$2,745
- − Repairs & maintenance
- −$3,360
- − Management
- −$3,360
- − Depreciation
- −$15,971
- Taxable loss
- −$23,551
- Est. tax savings @ 24.0%
- +$5,652
- After-tax cash flow
- $-7,823/yr
For passive investors: Depreciation is non-cash, so a rental often shows a tax loss while cash-flowing — sheltering income. Rental losses are passive: they offset passive income freely, and up to $25,000/yr can offset ordinary (W-2) income if you actively participate and your MAGI is under $100k (phasing out to $0 by $150k); unused losses carry forward. On sale, claimed depreciation is recaptured at up to 25%, and gains may owe capital-gains tax (a 1031 exchange can defer both). Figures are a year-1 estimate at your 24.0% rate — not tax advice; consult a CPA.
Schools (NCES district)
- District
- Averill Park Central School District
- NCES district ID
- 3600016
- Math proficiency
- 58% ▼ -15.00%
- Reading proficiency
- 69% ▲ 2.00%
- Median HH income
- $81,340
- Composite
- 56.94/100
- National rank
- #1113
- State rank
- #169 of 590 in NY
Livability — Averill Park
- Score
- 80/100
- State rank
- #101
- US rank
- #1641
Category grades
Schools grade is shown separately in the Schools card above.
Census & demographics
- Population (ZIP)
- 7,069
Population outlook (Rensselaer County) Hauer SSP2
- Today (2025)
- 162,400 people
- By 2030
- 161,746 · -0.4%
- By 2040
- 158,095 · -2.7%
- By 2050
- 152,966 · -5.8%
- By 2075
- 140,767 · -13.3%
- By 2100
- 124,727 · -23.2%
Race, ethnicity, and origin ACS 2023
- Neighborhood character
- Predominantly White (95%)
- Race & ethnicity
- White 95% Two or more races 4% Hispanic / Latino 3%
- Common ancestry
- Romanian 5% Lithuanian 4% Italian 4%
- Foreign-born
- 5% · Canada
- Languages at home
- 93% English-only · Other Indo-European 4% French/Haitian/Cajun 1% Russian/Polish/Slavic 1%
Political lean MEDSL · Rensselaer
- 2024 margin
- Toss-up / Even · D 50.7% · R 49.3%
- 2008→2024 swing
- -8.0pp toward R · 2008: 9.3pp · 2024: 1.4pp
- All cycles
- 2024: D+1.4 2020: D+5.6 2016: R+2.9 2012: D+11.8 2008: D+9.3
Not yet ingested
- Civics
- —
Market trends
- HPI YoY
- ▲ 11.43%
- Current HPI
- 263.2196
- Rent YoY
- —
- Metro
- —
- State GDP YoY
- ▲ 2.60%
- F500 in state
- 92
Industry mix (Fortune 500 HQ in NY)
| Industry | F500 HQs | Revenue |
|---|---|---|
| Financial Services | 10 | $950B |
|
||
| Consumer Goods | 9 | $162B |
|
||
| Insurance | 4 | $225B |
|
||
| Telecommunications | 2 | $144B |
|
||
| Pharmaceuticals | 2 | $112B |
|
||
| Media / Entertainment | 2 | $69B |
|
||
Price history
+62.7% since first listed12 events — show timeline
- 2026-06-01 Listed $549,000 Global MLS
- 2017-07-10 Sold (Public Records) $290,000 Public Records
- 2017-07-05 Sold (MLS) $290,000 Global MLS
- 2017-05-26 Pending — Global MLS
- 2017-02-02 Listed $295,000 Global MLS
- 2017-02-02 Listing Removed — Global MLS
- 2016-11-17 Price Changed $295,000 Global MLS
- 2016-09-07 Price Changed $299,900 Global MLS
- 2016-08-03 Listed $309,900 Global MLS
- 2015-09-01 Listing Removed — Global MLS
- 2015-04-27 Listed $327,500 Global MLS
- 2015-04-27 Listed $337,500 HVCRMLS
Property tax history
+1.6%/yrLatest (2025): $9,362 · -5.2% YoY. Source: county tax records.
Cash-flow waterfall
monthlySold comps — $/sqft
last 12 mo · ≤1 miLoading sold comps…