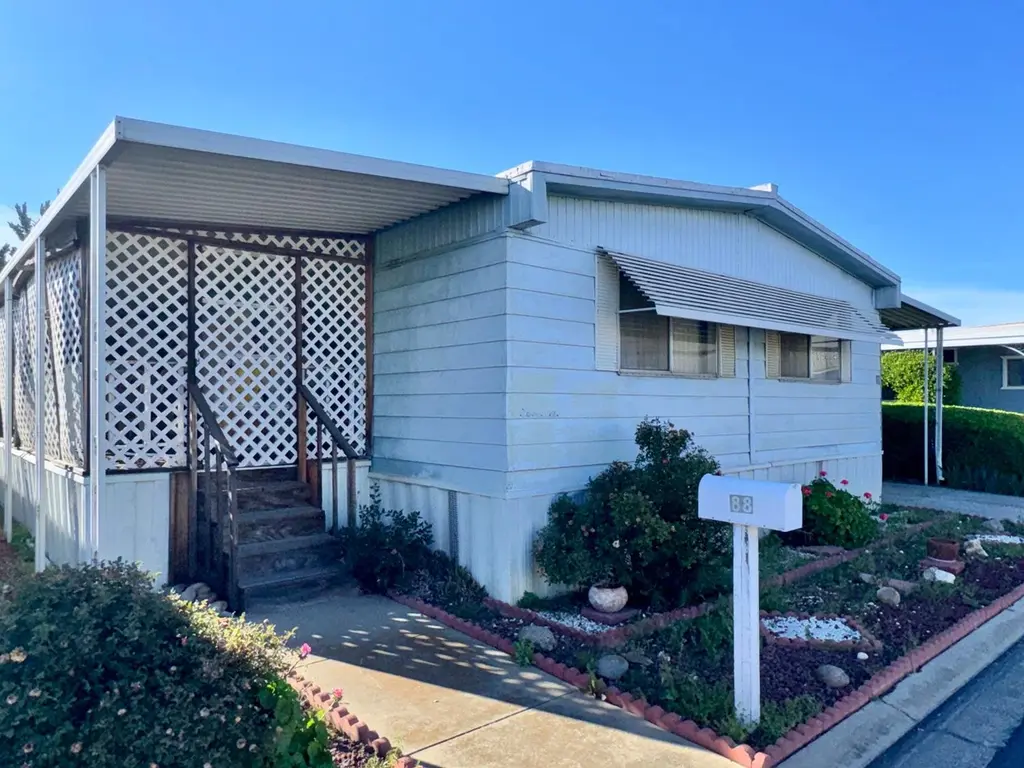
2240 Golden Oak #88 · Merced, CA
Flood risk 5/10 · Moderate
- FEMA flood zone
- AO
- Chance of flooding over 30 yrs
- 0.51%
- Est. flood insurance / yr
- $848 – $2,087
Fire risk 8/10 · Major
- Est. fire insurance / yr
- $659 – $1,223
Heat risk 7/10 · Major
- Hot days now (above 104°F)
- 7 days/yr
- Hot days in 30 yrs
- 16 days/yr
Wind risk 1/10 · Minimal
- Chance of severe wind over 30 yrs
- —
Air-quality risk 10/10 · Severe
- Unhealthy air days now
- 38 days/yr
- Unhealthy air days in 30 yrs
- 40 days/yr
Risk factors via First Street. Map © Google.
Why this score? — see what drove the B+ grade
The composite is a weighted blend of 9 inputs, each scored 0–100. Each bar is that input's sub-score; the figure is the points it added to the 100-point composite (weight × sub-score).
- Cash flow +30.0/30.0
- ARV discount +15.0/15.0
- 1% rule +10.0/10.0
- DSCR +10.0/10.0
- Livability +3.7/5.0
- Rent growth +2.9/5.0
- Schools +2.8/10.0
- Condition / age +2.5/5.0
- Appreciation +0.0/10.0
$69,900
🖨 Deal sheet (PDF) 📄 Offer letter ✓ Due diligence
Listing remarks
Welcome to Sierra Portal Mobile Estates, a desirable 55-or-better community in Merced. This spacious 2-bedroom, 2-bath manufactured home offers approximately 1,322 sq. ft. of living space and a great opportunity for a buyer looking for value, comfort, and the chance to make it their own. The home features a functional floor plan with generous living and dining areas, built-in cabinetry, indoor laundry, covered parking, a covered/enclosed patio area, and a storage shed. The exterior offers nice curb appeal with mature landscaping, a covered carport, storage shed, and easy access around the home. With its affordable price point and potential for improvements, this property is ideal for a
Key facts
- Covered parking
- Indoor laundry
- Spacious clubhouse
Tags
Property features AI
Finance
- Other: Park name: Sierra Portal Mobile Estates
- HOA & community: Senior community; Community amenities include dog park, sidewalks, and park; Land lease applies ($877 monthly)
Exterior
- Parking: Located in Sierra Portal Mobile Estates
- Security: Gated community with automatic gate; Card/code access
- Utilities: Public sewer; District/public water
- Home design: Single-story; Entry level 1; Mobile home remains
- Construction: Mobile home (110 ft by 12 ft)
- Exterior features: Back yard; Close to clubhouse; No pool listed
Interior
- Kitchen: Electric oven; Dishwasher; Electric water heater
- Bathrooms: 2 full bathrooms
- Heating & cooling: Central heating (electric furnace); Central electric cooling
- Interior features: Front entry; Card/code access; Carbon monoxide detector(s); Smoke detector; Gated community with automatic gate
- Laundry & utility: Washer hookup; Electric dryer hookup; Has laundry
Neighborhood map
What this means for you Summary
Snapshot
- This is a 2-bed/2.0-bath manufactured listed at $70k.
Deal economics
- At list price, monthly cash flow is $1k ($14k/yr) — positive.
- The deal already cash-flows at list — no discount required.
- Meets the 1% rule at list price ($2k rent vs $70k).
- Recommended offer: $68k (3.0% below list) — sets the bar for market timing.
- Cap rate 27.7% vs local median 3.4% in Merced — top-decile yield for the area; either an underpriced asset or a hidden risk that comps aren't pricing in. Stress-test before assuming the spread holds.
Location & tenants
- Location reads 73/100 on livability (#153 in CA) — a middle-class / working-renter tenant base. Strengths: amenities A+, commute A+, housing A+; Watch: employment D, crime F, cost of living F.
- Merced Union High (urban): math 20% / reading 46% proficiency, ranked #301 of 517 in CA (top 58%) — families likely to look elsewhere, expect single-tenant / working-renter base with shorter leases.
- Zoned schools: Pioneer Elementary (1,126 students, 67% FRL); Weaver Middle (math 15% / reading 36%, grade F, #260 of 498 statewide, top 54%, 1,003 students, 64% FRL); Golden Valley High (math 20% / reading 46%, grade F, #667 of 1,170 statewide, top 57%, 1,956 students, 81% FRL).
- Market conditions: Rents rising (+1.7%/yr); 171 active listings in the ZIP; 9 comparable units currently listed for rent nearby; rentals at typical pace (median 16d on market — plan ~3-4 weeks tenant-placement turnaround); 459 units permitted in Merced County in 2024 (0 in 5+ unit buildings).
- This rent runs 44% of the median local income ($57k/yr) — at the standard rent-burdened threshold; future hikes will face affordability resistance.
Forward outlook
- Local home prices are declining (-3.0%/yr); year-one equity from $483 of loan paydown is wiped out by about $2k of value loss. Plan a longer hold.
- Merced County population projected at +12% by 2050 — modest demand growth; plan on rents tracking national, not racing it.
- At projected returns (-3.0% appreciation + 1.7% rent growth), your $20k cash investment doubles in ~2 years — after that, you're playing with house money.
Negotiation context
- It's been on market 33 days — a 3% lower offer ($68k) is reasonable based on typical stale-listing flexibility.
Risks & watch-outs
- Watch-outs: flood insurance adds $122/mo.
- Climate carrying-cost: in FEMA flood zone AO (mandatory federal flood insurance); severe wildfire risk; extreme-heat days projected 7→16/yr by 2055 (HVAC capex compounding) — expect insurance premiums to compound above CPI over the hold.
Questions for the listing agent
- It's been on market 33 days. Have you received any prior offers? Is the seller open to a 3% concession, seller financing, or rate buy-down credit?
- Built in 1976 — when were the roof, HVAC, electrical panel, plumbing, and water heater last replaced?
- What's the actual annual flood-insurance premium (NFIP or private), and is the property in a SFHA with mandatory coverage?
- Is there a deadline driving the sale (1031 exchange, divorce, estate, relocation)? That informs how much negotiation room exists.
- Schools are D-rated, which usually means shorter tenancies and higher turnover. Who's the typical renter profile here, and what's been the actual vacancy rate?
- Crime grade is F in this area — have there been break-ins, vandalism, or insurance claims at this property in the last 3 years? What carrier currently insures it and at what premium?
- What's the average days-on-market for RENTAL listings here right now (not sales)? A rising rental-DOM trend means longer vacancies and softer asking-rent achievability than the comps imply.
- What's the recent tenant-quality profile in this submarket — average credit score on applications, eviction rate, late-payment / NSF rate, and stable-employment percentage? A property-management company in the area should have these aggregated.
- How much new for-sale + rental construction is in the pipeline within 1–3 miles? Heavy new supply typically softens prices + rents 12–24 months out; constrained supply supports both.
Investment metrics
- 1% rule
- 3.00% ✓
- Cap rate
- 27.72%
- Cash-on-cash
- 76.52%
- DSCR
- 4.40
- GRM
- 2.8
CMA / ARV
- ARV (on-the-fly)
- $88,574
- Comps found
- 11
Show comp detail 11 sales within ~0.75 mi
| Address | Dist | Beds/Ba | Sqft | Sold | Price | $/sf | Match |
|---|---|---|---|---|---|---|---|
| 2240 Golden Oak #94 | 0.06mi | 2/2.0 | 1,248 (-6%) | 2mo | $25,000 | $20 | 87 |
| 2240 Golden Oak Ln #83 | 0.15mi | 3/2.0 (+1) | 1,285 (-3%) | 3mo | $106,900 | $83 | 81 |
| 2240 Golden Oak Ln #147 | 0.13mi | 2/2.0 | 1,230 (-7%) | 3mo | $90,900 | $74 | 80 |
| 2240 Golden Oak Ln #85 | 0.16mi | 2/2.0 | 1,296 (-2%) | 13mo | $95,000 | $73 | 78 |
| 2240 Golden Oak Ln #138 | 0.06mi | 2/2.0 | 1,440 (+9%) | 9mo | $51,000 | $35 | 75 |
| 2240 Golden Oak #155 | 0.06mi | 2/2.0 | 1,200 (-9%) | 16mo | $95,000 | $79 | 68 |
| 2240 Golden Oak Ln #49 | 0.09mi | 3/2.0 (+1) | 1,440 (+9%) | 17mo | $97,000 | $67 | 62 |
| 2240 Golden Oak Ln #42 | 0.20mi | 2/2.0 | 1,440 (+9%) | 17mo | $79,000 | $55 | 62 |
| 2240 Golden Oak Ln #76 | 0.09mi | 2/2.0 | 1,464 (+11%) | 21mo | $74,000 | $51 | 60 |
| 1735 Santa Fe Ave | 0.44mi | 3/2.0 (+1) | 1,248 (-6%) | 12mo | $360,000 | $288 | 55 |
| 2499 E Gerard Ave #50 | 0.75mi | 2/2.0 | 1,200 (-9%) | 3mo | $75,000 | $63 | 47 |
Match score weights: distance 35% · size 25% · config 20% · recency 20%. Top-matched comps best support the ARV.
Projected returns pro-forma
-3.0% appreciation · 1.68% rent growth · sell at horizon
- IRR
- 67.0%
- Equity multiple
- 3.95×
- Total profit
- $57,679
- Equity at exit
- $10,422
- IRR
- 70.8%
- Equity multiple
- 7.73×
- Total profit
- $131,806
- Equity at exit
- $6,044
Cash invested: $19,572 (down + closing). Projections, not guarantees.
Landlord ↔ Tenant lean methodology
- Overall (STATE)
- 18 Strongly Tenant-Friendly
- State California
- 18 Strongly Tenant-Friendly · D+13
- County
- — inherits STATE
- City
- — inherits STATE
ZIP-level market 95341
- Home prices YoY
- -29.2%
- Rents YoY
- 1.7%
- Active inventory
- 171
- Price-to-rent
- 2.8×
Monthly cashflow live
- Estimated rent
- $2,097 high interval (Pro) →
- Mortgage (P&I)
- −$367
- Tax from tax record
- −$13 /mo · $159/yr
- Insurance
- −$29
- Flood insurance flood zone
- −$122 /mo · $1,468/yr
- HOA
- −$0
- Vacancy / Maint / Mgmt
- −$440
- Net cashflow
- $1,126
Break-even live
Sensitivity live
| Price | -10% $1,165 | -5% $1,145 | +0% $1,126 | +5% $1,106 | +10% $1,086 |
|---|---|---|---|---|---|
| Rent | -10% $960 | -5% $1,043 | +0% $1,126 | +5% $1,209 | +10% $1,291 |
| Rate | -1.0pp $1,161 | -0.5pp $1,143 | base $1,126 | +0.5pp $1,108 | +1.0pp $1,089 |
UW: 25.0% down · 7.5% · 30yr · 1.5% tax · 5.0% vac · 8.0% maint · 8.0% mgmt
Financing live
Cash to close
- Down payment
- $17,475
- Closing costs
- $2,097
- Reserves months
- —
- Total cash needed
- —
Loan-product check · same deal, 3 products live
Conventional
25% down · 7.5% · 30yr
- Down + closing
- —
- Monthly P&I
- —
- Monthly cashflow
- —
- DSCR
- —
- Eligible?
- —
Personal DTI + credit; lowest rate.
DSCR
20% down · 8.5% · 30yr
- Down + closing
- —
- Monthly P&I
- —
- Monthly cashflow
- —
- DSCR
- —
- Eligible?
- —
No personal income docs; deal must DSCR.
Hard money
10% down · 12.0% · 12mo
- Down + closing
- —
- Monthly P&I
- —
- Monthly cashflow
- —
- DSCR
- —
- Eligible?
- —
Short-term bridge; refi at stabilization.
Rent comps 9 comps
| Address | Beds | Baths | Sqft | Rent | $/sqft | DOM | Units | Dist |
|---|---|---|---|---|---|---|---|---|
| 1880 Barnett Way Merced, CA | 3.0 | 2.0 | 1286 | $1,975 | $1.54 | 15d | 1 | 0.58mi |
| 2632 Story Ave Merced, CA | 3.0 | 2.0 | 1286 | $2,150 | $1.67 | 15d | 1 | 0.62mi |
| 2210 Birchwood Ct Merced, CA | 3.0 | 2.0 | 1377 | $2,150 | $1.56 | 15d | 1 | 0.68mi |
| 341 Brad Ct Merced, CA | 3.0 | 2.0 | 1410 | $2,275 | $1.61 | 15d | 1 | 1.06mi |
| 405 Carly Anne Dr Merced, CA | 3.0 | 2.0 | 1815 | $1,995 | $1.10 | 0d | 1 | 1.07mi |
| 2685 Agnes Way Merced, CA | 3.0 | 2.0 | 1130 | $1,845 | $1.63 | 15d | 1 | 1.08mi |
| 2618 Hoover Ct Merced, CA | 3.0 | 2.0 | 1220 | $2,200 | $1.80 | 15d | 1 | 1.13mi |
| 2340 Circle Dr Merced, CA | 3.0 | 2.0 | 1250 | $1,900 | $1.52 | 15d | 1 | 1.18mi |
| 435 Petunia Ct Merced, CA | 3.0 | 2.0 | 1654 | $2,150 | $1.30 | 0d | 1 | 1.28mi |
Listing history 18 events
-
2026-06-22days on market $69,900 Active 33 DOM
-
2026-06-18days on market $69,900 Active 30 DOM
-
2026-06-17days on market $69,900 Active 29 DOM
-
2026-06-16days on market $69,900 Active 28 DOM
-
2026-06-15days on market $69,900 Active 27 DOM
-
2026-06-14days on market $69,900 Active 25 DOM
-
2026-06-13days on market $69,900 Active 24 DOM
-
2026-06-10days on market $69,900 Active 22 DOM
-
2026-06-09days on market $69,900 Active 21 DOM
-
2026-06-08days on market $69,900 Active 20 DOM
-
2026-06-07days on market $69,900 Active 19 DOM
-
2026-06-05days on market $69,900 Active 16 DOM
-
2026-06-03days on market $69,900 Active 15 DOM
-
2026-06-02days on market $69,900 Active 14 DOM
-
2026-06-01days on market $69,900 Active 13 DOM
-
2026-05-31days on market $69,900 Active 12 DOM
-
2026-05-30days on market $69,900 Active 11 DOM
-
2026-05-19$69,900 Active
ⓘ Source: listings_history table (triggers on properties + properties_extension) + one-shot
backfill from property_details.listing_events for pre-trigger history.
Tax reassessment forecast CA · Resets to sale price
- Current annual tax
- $159 · $13/mo
- Projected year-2 tax
- $531 · $44/mo
- Expected delta
- +$372/yr (+$31/mo · 233.1%)
ⓘ Screening estimate from a state-policy table — verify with the county assessor before closing.
Climate risk First Street
- Flood 5/10 Major FEMA zone AO · 51% chance over 30 yrs
- Wildfire 8/10 Severe
- Heat 7/10 Severe 7 d/yr ≥104°F today · 16 d/yr by 30 yrs out
- Wind 1/10 Low
- Air quality 10/10 Extreme 38 unhealthy d/yr today · 40 by 30 yrs out
Nearby sold comps map
Loading sold comps map…
Walkable amenities ~0.75 mi
Loading nearby amenities…
Taxation est. · year 1
- Rental income
- $25,169
- − Mortgage interest
- −$3,915
- − Property taxes
- −$159
- − Insurance
- −$1,817
- − Repairs & maintenance
- −$2,013
- − Management
- −$2,013
- − Depreciation
- −$2,033
- Taxable income
- $13,216
- Est. tax owed @ 24.0%
- −$3,172
- After-tax cash flow
- $10,336/yr
For passive investors: Depreciation is non-cash, so a rental often shows a tax loss while cash-flowing — sheltering income. Rental losses are passive: they offset passive income freely, and up to $25,000/yr can offset ordinary (W-2) income if you actively participate and your MAGI is under $100k (phasing out to $0 by $150k); unused losses carry forward. On sale, claimed depreciation is recaptured at up to 25%, and gains may owe capital-gains tax (a 1031 exchange can defer both). Figures are a year-1 estimate at your 24.0% rate — not tax advice; consult a CPA.
Schools (NCES district)
- District
- Merced Union High
- NCES district ID
- 0624660
- Math proficiency
- 20% ▲ 3.00%
- Reading proficiency
- 46% ▼ -1.00%
- Median HH income
- $44,977
- Composite
- 28.11/100
- National rank
- #6823
- State rank
- #301 of 517 in CA
Livability — Merced
- Score
- 73/100
- State rank
- #153
- US rank
- #5111
Category grades
Schools grade is shown separately in the Schools card above.
Census & demographics
- Census place
- Merced, CA
- County
- Merced County · 205,386 people
- City population
- 112,228
- Metro
- Merced, CA
- Population (ZIP)
- 36,385
- Household income
- $57,342
- Rent vs Own
- Severe rent burden
- 1419.0
Population outlook (Merced County) Hauer SSP2
- Today (2025)
- 285,501 people
- By 2030
- 293,437 · +2.8%
- By 2040
- 308,808 · +8.2%
- By 2050
- 321,011 · +12.4%
- By 2075
- 338,497 · +18.6%
- By 2100
- 330,493 · +15.8%
Race, ethnicity, and origin ACS 2023
- Neighborhood character
- Predominantly Hispanic (73%)
- Race & ethnicity
- Hispanic / Latino 73% White 12% Two or more races 11% Asian 8% Black 3%
- Hispanic origin (detail)
- Mexican 70%
- Common ancestry
- Russian 2%
- Foreign-born
- 30% · Canada
- Languages at home
- 37% English-only · Spanish 55% Other Asian/Pacific 6% Other Indo-European 1%
Political lean MEDSL · Merced
- 2024 margin
- Toss-up / Even · D 46.5% · R 50.9% · Other 2.6%
- 2008→2024 swing
- -12.7pp toward R · 2008: 8.3pp · 2024: -4.4pp
- All cycles
- 2024: R+4.4 2020: D+10.6 2016: D+7.9 2012: D+5.4 2008: D+8.3
Not yet ingested
- Civics
- —
Market trends
- HPI YoY
- ▼ -129.65%
- Current HPI
- 314.4223
- Rent YoY
- ▲ 1.68%
- Metro
- Merced, CA
- State GDP YoY
- ▲ 3.21%
- F500 in state
- 116
Industry mix (Fortune 500 HQ in CA)
| Industry | F500 HQs | Revenue |
|---|---|---|
| Technology | 27 | $1,492B |
|
||
| Financial Services | 3 | $174B |
|
||
| Retail | 3 | $44B |
|
||
| Insurance | 3 | $26B |
|
||
| Media / Entertainment | 2 | $115B |
|
||
| Pharmaceuticals / Biotech | 2 | $62B |
|
||
Price history
1 event — show timeline
- 2026-05-19 Listed $69,900 CRMLS
Property tax history
-1.6%/yrLatest (2020): $159 · -0.1% YoY. Source: county tax records.
Cash-flow waterfall
monthlySold comps — $/sqft
last 12 mo · ≤1 miLoading sold comps…