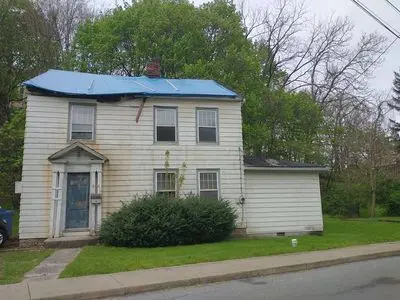
810 14th St · Huntingdon, PA
Flood risk 8/10 · Major
- FEMA flood zone
- X (unshaded)
- Chance of flooding over 30 yrs
- 0.78%
- Est. flood insurance / yr
- $473 – $860
Fire risk 1/10 · Minimal
- Est. fire insurance / yr
- $511 – $949
Heat risk 4/10 · Minor
- Hot days now (above 97°F)
- 7 days/yr
- Hot days in 30 yrs
- 17 days/yr
Wind risk 2/10 · Minimal
- Chance of severe wind over 30 yrs
- 0.0%
Air-quality risk 2/10 · Minimal
- Unhealthy air days now
- 1 days/yr
- Unhealthy air days in 30 yrs
- 2 days/yr
Risk factors via First Street. Map © Google.
Why this score? — see what drove the D grade
The composite is a weighted blend of 9 inputs, each scored 0–100. Each bar is that input's sub-score; the figure is the points it added to the 100-point composite (weight × sub-score).
- Cash flow +15.0/30.0
- ARV discount +7.5/15.0
- 1% rule +5.0/10.0
- DSCR +5.0/10.0
- Schools +3.3/10.0
- Livability +3.3/5.0
- Rent growth +2.5/5.0
- Condition / age +2.5/5.0
- Appreciation +0.0/10.0
$18,000
🖨 Deal sheet 📄 Offer letter ✓ Due diligence
Listing remarks
$20K & acirc; & euro; & ldquo; Investor Special / Full Rehab or Rebuild (Direct Buyers Only) 4BR / 2BA home with family room located in a convenient area near hospital, schools, and Juniata College, plus grocery and everyday essentials. Just minutes from Raystown Lake. This home was once a place where a larger household could comfortably live and grow. With four bedrooms, two full baths, and a family room, the layout itself is increasingly hard to find & acirc; & euro; & rdquo; especially at this price point. For the right buyer, this is an opportunity to restore that space for a new chapter or start fresh and build something new. Property is in major disrepair, in
Key facts
- Near schools
- Near hospital
- Near grocery
Tags
Neighborhood map
What this means for you Summary
Snapshot
- This is a 3-bed/2.0-bath single-family listed at $18k.
Deal economics
- At list price, monthly cash flow is $782 ($9k/yr) — positive.
- The deal already cash-flows at list — no discount required.
- Meets the 1% rule at list price ($1k rent vs $18k).
- Recommended offer: $18k (1.5% below list) — sets the bar for market timing.
- Cap rate 62.1% vs local median 3.6% in Huntingdon — top-decile yield for the area; either an underpriced asset or a hidden risk that comps aren't pricing in. Stress-test before assuming the spread holds.
Location & tenants
- Location reads 66/100 on livability (#1,050 in PA) — a middle-class / working-renter tenant base. Strengths: crime A+, cost of living A+, housing A+; Watch: schools D+, employment D+, amenities F.
- Huntingdon Area SD (town): math 32% / reading 47% proficiency, ranked #366 of 539 in PA (top 68%) — families likely to look elsewhere, expect single-tenant / working-renter base with shorter leases.
- Market conditions: 73 active listings in the ZIP; 70 units permitted in Huntingdon County in 2024 (0 in 5+ unit buildings).
Forward outlook
- Local home prices are declining (-3.0%/yr); year-one equity from $124 of loan paydown is wiped out by about $540 of value loss. Plan a longer hold.
- Huntingdon County population projected at -14% by 2050 — secular population decline; favor cash flow + early exit over multi-decade hold.
- At projected returns (-3.0% appreciation + 3.0% rent growth), your $5k cash investment doubles in ~1 year — after that, you're playing with house money.
Negotiation context
- It's been on market 24 days — a 2% lower offer ($18k) is reasonable based on typical stale-listing flexibility.
- 2 sale attempts since 2y ago with the ask held roughly flat each time — persistent listings suggest the price (not the market) is what's stuck; bring a comps-based counter.
Risks & watch-outs
- Watch-outs: flood insurance adds $56/mo; built in 1928 — expect roof / HVAC / electrical / plumbing capex.
- Climate carrying-cost: severe flood risk — expect insurance premiums to compound above CPI over the hold.
Questions for the listing agent
- Built in 1928 — when were the roof, HVAC, electrical panel, plumbing, and water heater last replaced?
- What's the actual annual flood-insurance premium (NFIP or private), and is the property in a SFHA with mandatory coverage?
- Is there a deadline driving the sale (1031 exchange, divorce, estate, relocation)? That informs how much negotiation room exists.
- Schools are D-rated, which usually means shorter tenancies and higher turnover. Who's the typical renter profile here, and what's been the actual vacancy rate?
- The area grade is low — what's the realistic commute time and amenity access for the typical tenant pool here? Any planned neighborhood developments (good or bad) we should know about?
- What's the average days-on-market for RENTAL listings here right now (not sales)? A rising rental-DOM trend means longer vacancies and softer asking-rent achievability than the comps imply.
- What's the recent tenant-quality profile in this submarket — average credit score on applications, eviction rate, late-payment / NSF rate, and stable-employment percentage? A property-management company in the area should have these aggregated.
- How much new for-sale + rental construction is in the pipeline within 1–3 miles? Heavy new supply typically softens prices + rents 12–24 months out; constrained supply supports both.
Investment metrics
- 1% rule
- 6.77% ✓
- Cap rate
- 62.15%
- Cash-on-cash
- 199.48%
- DSCR
- 9.88
- GRM
- 1.2
CMA / ARV
- ARV (on-the-fly)
- $129,642
- Comps found
- 12
Show comp detail 12 sales within ~0.75 mi
| Address | Dist | Beds/Ba | Sqft | Sold | Price | $/sf | Match |
|---|---|---|---|---|---|---|---|
| 521 13th St | 0.16mi | 3/1.0 | 1,327 (-5%) | 3mo | $77,000 | $58 | 78 |
| 1413 Mifflin St | 0.28mi | 3/1.0 | 1,482 (+6%) | 1mo | $165,000 | $111 | 71 |
| 1319 Washington St | 0.35mi | 2/1.5 (-1) | 1,348 (-3%) | 1mo | $125,000 | $93 | 70 |
| 408 Church St | 0.64mi | 3/1.5 | 1,388 (-0%) | 2mo | $73,550 | $53 | 66 |
| 805 Fifth St | 0.42mi | 3/1.5 | 1,512 (+8%) | 7mo | $155,000 | $103 | 58 |
| 2622 Shadyside Ave | 0.67mi | 3/2.5 | 1,500 (+8%) | 1mo | $240,000 | $160 | 53 |
| 510 5th St | 0.56mi | 3/1.5 | 1,547 (+11%) | 1mo | $101,000 | $65 | 52 |
| 710 7th St | 0.37mi | 3/1.5 | 1,600 (+15%) | 5mo | $85,000 | $53 | 51 |
| 1135 Washington St | 0.38mi | 4/1.5 (+1) | 1,600 (+15%) | 1mo | $175,000 | $109 | 50 |
| 230 Church St | 0.71mi | 2/2.0 (-1) | 1,280 (-8%) | 2mo | $75,000 | $59 | 47 |
| 219 19th St | 0.60mi | 2/2.0 (-1) | 1,188 (-15%) | 0mo | $195,501 | $165 | 42 |
| 424 Moore St | 0.56mi | 3/1.0 | 1,186 (-15%) | 6mo | $37,000 | $31 | 40 |
Match score weights: distance 35% · size 25% · config 20% · recency 20%. Top-matched comps best support the ARV.
Projected returns pro-forma
-3.0% appreciation · 3.0% rent growth · sell at horizon
- IRR
- —
- Equity multiple
- 10.32×
- Total profit
- $46,958
- Equity at exit
- $2,684
- IRR
- —
- Equity multiple
- 21.88×
- Total profit
- $105,258
- Equity at exit
- $1,556
Cash invested: $5,040 (down + closing). Projections, not guarantees.
Landlord ↔ Tenant lean methodology
- Overall (STATE)
- 62 Landlord-Friendly
- State Pennsylvania
- 62 Landlord-Friendly · EVEN
- County
- — inherits STATE
- City
- — inherits STATE
ZIP-level market 16652
- Home prices YoY
- -21.5%
- Active inventory
- 73
- Price-to-rent
- 1.2×
Monthly cashflow live
- Estimated rent
- $1,218 medium interval (Pro) →
- Mortgage (P&I)
- −$94
- Tax est. 1.5%
- −$22 /mo · $270/yr
- Insurance
- −$8
- Flood insurance flood zone
- −$56 /mo · $666/yr
- HOA
- −$0
- Vacancy / Maint / Mgmt
- −$256
- Net cashflow
- $782
Break-even live
UW: 25.0% down · 7.5% · 30yr · 1.5% tax · 5.0% vac · 8.0% maint · 8.0% mgmt
Financing live
Cash to close
- Down payment
- $4,500
- Closing costs
- $540
- Reserves months
- —
- Total cash needed
- —
Loan-product check · same deal, 3 products live
Conventional
25% down · 7.5% · 30yr
- Down + closing
- —
- Monthly P&I
- —
- Monthly cashflow
- —
- DSCR
- —
- Eligible?
- —
Personal DTI + credit; lowest rate.
DSCR
20% down · 8.5% · 30yr
- Down + closing
- —
- Monthly P&I
- —
- Monthly cashflow
- —
- DSCR
- —
- Eligible?
- —
No personal income docs; deal must DSCR.
Hard money
10% down · 12.0% · 12mo
- Down + closing
- —
- Monthly P&I
- —
- Monthly cashflow
- —
- DSCR
- —
- Eligible?
- —
Short-term bridge; refi at stabilization.
Listing history 22 events
-
2026-06-19days on market $18,000 Active 24 DOM
-
2026-06-18days on market $18,000 Active 23 DOM
-
2026-06-17days on market $18,000 Active 22 DOM
-
2026-06-16days on market $18,000 Active 21 DOM
-
2026-06-15days on market $18,000 Active 20 DOM
-
2026-06-14days on market $18,000 Active 18 DOM
-
2026-06-13days on market $18,000 Active 17 DOM
-
2026-06-10days on market $18,000 Active 15 DOM
-
2026-06-09days on market $18,000 Active 14 DOM
-
2026-06-08days on market $18,000 Active 13 DOM
-
2026-06-07days on market $18,000 Active 12 DOM
-
2026-06-02days on market $18,000 Active 7 DOM
-
2026-06-01days on market $18,000 Active 6 DOM
-
2026-05-31days on market $18,000 Active 5 DOM
-
2026-05-30days on market $18,000 Active 4 DOM
-
2026-05-26$18,000 Active
-
2025-02-28historical
-
2025-01-25price $59,900
-
2024-10-31price $63,900
-
2024-10-17$65,000 Active
-
2024-10-17historical
-
1992-06-06soldstatus $49,500
ⓘ Source: listings_history table (triggers on properties + properties_extension) + one-shot
backfill from property_details.listing_events for pre-trigger history.
Climate risk First Street
- Flood 8/10 Severe FEMA zone X (unshaded) · 78% chance over 30 yrs
- Wildfire 1/10 Low
- Heat 4/10 Moderate 7 d/yr ≥97°F today · 17 d/yr by 30 yrs out
- Wind 2/10 Low 0% chance of damaging wind over 30 yrs
- Air quality 2/10 Low 1 unhealthy d/yr today · 2 by 30 yrs out
Nearby sold comps map
Loading sold comps map…
Walkable amenities ~0.75 mi
Loading nearby amenities…
Taxation est. · year 1
- Rental income
- $14,616
- − Mortgage interest
- −$1,008
- − Property taxes
- −$270
- − Insurance
- −$756
- − Repairs & maintenance
- −$1,169
- − Management
- −$1,169
- − Depreciation
- −$524
- Taxable income
- $9,719
- Est. tax owed @ 24.0%
- −$2,332
- After-tax cash flow
- $7,055/yr
For passive investors: Depreciation is non-cash, so a rental often shows a tax loss while cash-flowing — sheltering income. Rental losses are passive: they offset passive income freely, and up to $25,000/yr can offset ordinary (W-2) income if you actively participate and your MAGI is under $100k (phasing out to $0 by $150k); unused losses carry forward. On sale, claimed depreciation is recaptured at up to 25%, and gains may owe capital-gains tax (a 1031 exchange can defer both). Figures are a year-1 estimate at your 24.0% rate — not tax advice; consult a CPA.
Schools (NCES district)
- District
- Huntingdon Area SD
- NCES district ID
- 4212090
- Math proficiency
- 32% ▲ 1.00%
- Reading proficiency
- 47% ▼ -4.00%
- Median HH income
- $43,534
- Composite
- 33.4/100
- National rank
- #5478
- State rank
- #366 of 539 in PA
Livability — Huntingdon
- Score
- 66/100
- State rank
- #1050
- US rank
- #11779
Category grades
Schools grade is shown separately in the Schools card above.
Census & demographics
- Census place
- Huntingdon, PA
- Population (ZIP)
- 15,858
Population outlook (Huntingdon County) Hauer SSP2
- Today (2025)
- 44,212 people
- By 2030
- 43,057 · -2.6%
- By 2040
- 40,537 · -8.3%
- By 2050
- 37,844 · -14.4%
- By 2075
- 31,411 · -29.0%
- By 2100
- 23,907 · -45.9%
Race, ethnicity, and origin ACS 2023
- Neighborhood character
- Predominantly White (86%)
- Race & ethnicity
- White 86% Two or more races 6% Black 5% Hispanic / Latino 2%
- Common ancestry
- Romanian 3% Slovak 3% Serbian 2%
- Foreign-born
- 2% · Canada
- Languages at home
- 96% English-only · Spanish 2%
Political lean MEDSL · Huntingdon
- 2024 margin
- Solid R (+52.9) · D 23.2% · R 76.1%
- 2008→2024 swing
- -25.4pp toward R · 2008: -27.5pp · 2024: -52.9pp
- All cycles
- 2024: R+52.9 2020: R+51.0 2016: R+50.7 2012: R+37.4 2008: R+27.5
Not yet ingested
- Civics
- —
Market trends
- HPI YoY
- ▼ -54.10%
- Current HPI
- 197.6958
- Rent YoY
- —
- Metro
- —
- State GDP YoY
- ▲ 1.68%
- F500 in state
- 34
Industry mix (Fortune 500 HQ in PA)
| Industry | F500 HQs | Revenue |
|---|---|---|
| Healthcare | 2 | $309B |
|
||
| Insurance | 2 | $27B |
|
||
| Telecommunications / Media | 1 | $124B |
|
||
| Industrial Distribution | 1 | $22B |
|
||
| Financial Services | 1 | $20B |
|
||
| Chemicals / Materials | 1 | $18B |
|
||
Price history
-63.6% since first listed7 events — show timeline
- 2026-05-26 Listed $18,000 FSBO.com
- 2025-02-28 Listing Removed — BRIGHT MLS
- 2025-01-25 Price Changed $59,900 BRIGHT MLS
- 2024-10-31 Price Changed $63,900 BRIGHT MLS
- 2024-10-17 Listed $65,000 BRIGHT MLS
- 2024-10-17 Coming Soon — BRIGHT MLS
- 1992-06-06 Sold (Public Records) $49,500 Public Records
Property tax history
+3.4%/yrLatest (2026): $2,416 · +4.0% YoY. Source: county tax records.
Cash-flow waterfall
monthlySold comps — $/sqft
last 12 mo · ≤1 miLoading sold comps…