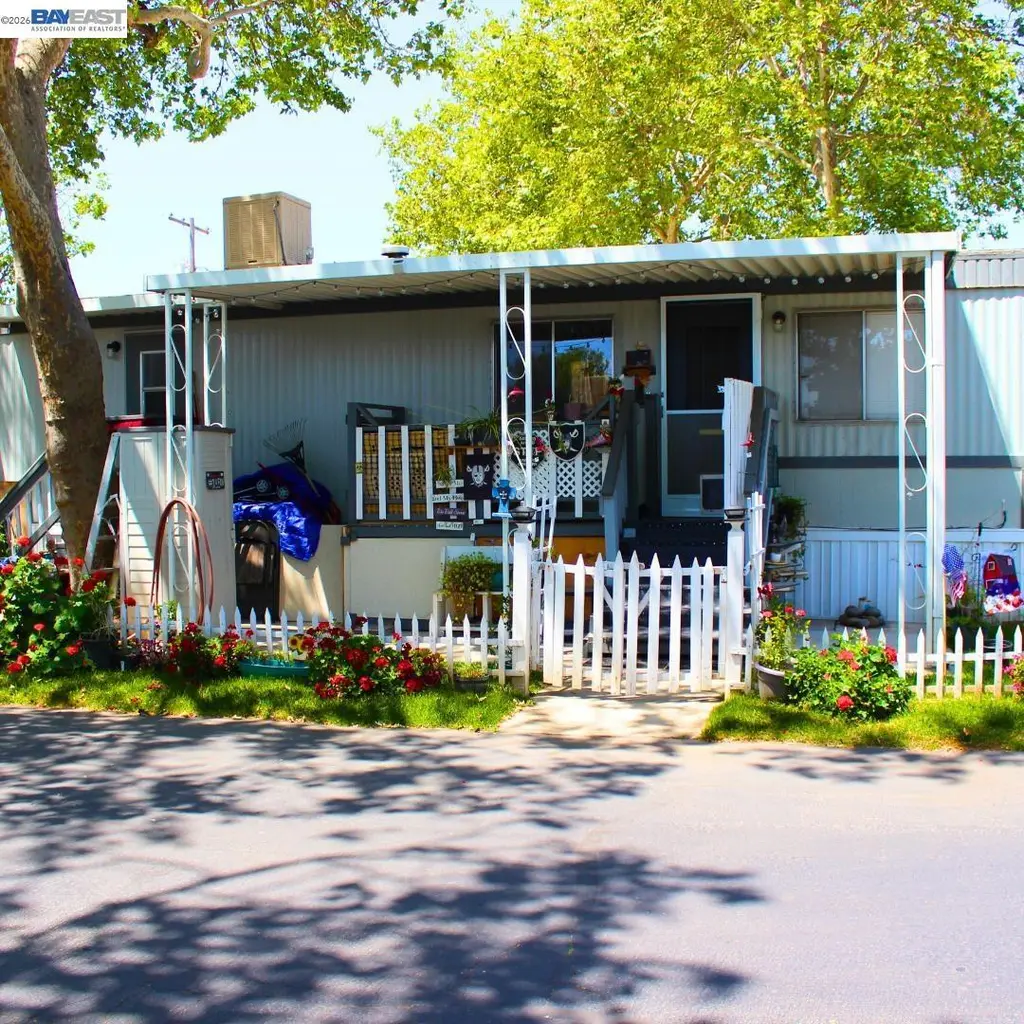
621 E Lockeford St. #30 #30 · Lodi, CA
Flood risk 1/10 · Minimal
- FEMA flood zone
- X (shaded)
- Chance of flooding over 30 yrs
- 0.0%
- Est. flood insurance / yr
- $507 – $1,088
Fire risk 4/10 · Minor
- Est. fire insurance / yr
- $659 – $1,223
Heat risk 7/10 · Major
- Hot days now (above 101°F)
- 7 days/yr
- Hot days in 30 yrs
- 14 days/yr
Wind risk 1/10 · Minimal
- Chance of severe wind over 30 yrs
- —
Air-quality risk 10/10 · Severe
- Unhealthy air days now
- 27 days/yr
- Unhealthy air days in 30 yrs
- 29 days/yr
Risk factors via First Street. Map © Google.
Why this score? — see what drove the B+ grade
The composite is a weighted blend of 9 inputs, each scored 0–100. Each bar is that input's sub-score; the figure is the points it added to the 100-point composite (weight × sub-score).
- Cash flow +30.0/30.0
- ARV discount +15.0/15.0
- 1% rule +10.0/10.0
- DSCR +10.0/10.0
- Rent growth +3.0/5.0
- Livability +2.9/5.0
- Schools +2.7/10.0
- Condition / age +2.5/5.0
- Appreciation +0.0/10.0
$48,500
🖨 Deal sheet 📄 Offer letter ✓ Due diligence
Listing remarks
This mobile home is in a quiet 55+ age community. Trash, water and the sewer fees are included in the rent. Gas and electricity charges are based on usage. It has central heating and a swamp cooler. Easy access to highway 99, shopping, movie theater, wineries, eateries, and much more.
Key facts
- Central heating
- Wineries
- Movie theater
Tags
Property features AI
Finance
- HOA & community: Pets allowed with approval, may require additional deposit, number and size limits apply; Park interview required; Laundry available in community; Senior community
Exterior
- Parking: One parking space per unit
- Utilities: Public water; Public sewer; Individual electric meter; Individual gas meter
- Home design: Manufactured in park (mobile home); Single wide body type; Model 4801; Entry skirt is metal
- Construction: Metal siding construction
- Exterior features: Fenced; Corner lot
Interior
- Kitchen: Gas range / cooktop
- Bedrooms: 3 rooms total
- Flooring: Laminate flooring; Tile flooring
- Bathrooms: 1 full bathroom
- Heating & cooling: Central heating; Evaporative cooling
- Interior features: No additional rooms
Neighborhood map
What this means for you Summary
Snapshot
- This is a 1-bed/1.0-bath manufactured listed at $48k.
Deal economics
- At list price, monthly cash flow is $708 ($8k/yr) — positive.
- The deal already cash-flows at list — no discount required.
- Meets the 1% rule at list price ($1k rent vs $48k).
- Recommended offer: $47k (3.0% below list) — sets the bar for market timing.
- Cap rate 23.8% vs local median 3.0% in Lodi — top-decile yield for the area; either an underpriced asset or a hidden risk that comps aren't pricing in. Stress-test before assuming the spread holds.
Location & tenants
- Location reads 58/100 on livability (#730 in CA) — a working-class tenant base; expect higher turnover. Strengths: housing A; Watch: schools C-, crime F, amenities F.
- Lodi Unified (urban): math 24% / reading 36% proficiency, ranked #325 of 517 in CA (top 63%) — families likely to look elsewhere, expect single-tenant / working-renter base with shorter leases.
- Market conditions: Rents rising (+2.1%/yr); 163 active listings in the ZIP; 12 comparable units currently listed for rent nearby; rentals lingering (median 44d on market — plan ~5-8 weeks vacancy on turnover, expect pricing pressure); 50% of comp listings sitting > 30 days — soft ceiling on asking rent; solid renter incomes; 3,779 units permitted in San Joaquin County in 2024 (0 in 5+ unit buildings).
Forward outlook
- Local home prices are declining (-3.0%/yr); year-one equity from $335 of loan paydown is wiped out by about $1k of value loss. Plan a longer hold.
- San Joaquin County population projected at +17% by 2050 — long-run rental-demand tailwind backs the buy-and-hold thesis.
- At projected returns (-3.0% appreciation + 2.1% rent growth), your $14k cash investment doubles in ~2 years — after that, you're playing with house money.
Negotiation context
- It's been on market 51 days — a 3% lower offer ($47k) is reasonable based on typical stale-listing flexibility.
Risks & watch-outs
- Climate carrying-cost: extreme-heat days projected 7→14/yr by 2055 (HVAC capex compounding) — expect insurance premiums to compound above CPI over the hold.
Questions for the listing agent
- It's been on market 51 days. Have you received any prior offers? Is the seller open to a 3% concession, seller financing, or rate buy-down credit?
- Is there a deadline driving the sale (1031 exchange, divorce, estate, relocation)? That informs how much negotiation room exists.
- Crime grade is F in this area — have there been break-ins, vandalism, or insurance claims at this property in the last 3 years? What carrier currently insures it and at what premium?
- What's the average days-on-market for RENTAL listings here right now (not sales)? A rising rental-DOM trend means longer vacancies and softer asking-rent achievability than the comps imply.
- What's the recent tenant-quality profile in this submarket — average credit score on applications, eviction rate, late-payment / NSF rate, and stable-employment percentage? A property-management company in the area should have these aggregated.
- How much new for-sale + rental construction is in the pipeline within 1–3 miles? Heavy new supply typically softens prices + rents 12–24 months out; constrained supply supports both.
Investment metrics
- 1% rule
- 2.72% ✓
- Cap rate
- 23.80%
- Cash-on-cash
- 62.54%
- DSCR
- 3.78
- GRM
- 3.1
CMA / ARV
- ARV (on-the-fly)
- $61,600
- Comps found
- 2
Show comp detail 2 sales within ~0.75 mi
| Address | Dist | Beds/Ba | Sqft | Sold | Price | $/sf | Match |
|---|---|---|---|---|---|---|---|
| 621 E Lockeford St #26 | 0.00mi | 2/1.0 (+1) | 672 (+9%) | 14mo | $65,000 | $97 | 68 |
| 621 E Lockeford St | 0.00mi | 1/1.0 | 550 (-11%) | 20mo | $55,000 | $100 | 66 |
Match score weights: distance 35% · size 25% · config 20% · recency 20%. Top-matched comps best support the ARV.
Projected returns pro-forma
-3.0% appreciation · 2.08% rent growth · sell at horizon
- IRR
- 60.5%
- Equity multiple
- 3.65×
- Total profit
- $36,027
- Equity at exit
- $7,232
- IRR
- 64.8%
- Equity multiple
- 7.23×
- Total profit
- $84,619
- Equity at exit
- $4,193
Cash invested: $13,580 (down + closing). Projections, not guarantees.
Landlord ↔ Tenant lean methodology
- Overall (STATE)
- 18 Strongly Tenant-Friendly
- State California
- 18 Strongly Tenant-Friendly · D+13
- County
- — inherits STATE
- City
- — inherits STATE
ZIP-level market 95240
- Rents YoY
- 2.1%
- Active inventory
- 163
- Price-to-rent
- 3.1×
Monthly cashflow live
- Estimated rent
- $1,320 high interval (Pro) →
- Mortgage (P&I)
- −$254
- Tax est. 1.5%
- −$61 /mo · $728/yr
- Insurance
- −$20
- HOA
- −$0
- Vacancy / Maint / Mgmt
- −$277
- Net cashflow
- $708
Break-even live
UW: 25.0% down · 7.5% · 30yr · 1.5% tax · 5.0% vac · 8.0% maint · 8.0% mgmt
Financing live
Cash to close
- Down payment
- $12,125
- Closing costs
- $1,455
- Reserves months
- —
- Total cash needed
- —
Loan-product check · same deal, 3 products live
Conventional
25% down · 7.5% · 30yr
- Down + closing
- —
- Monthly P&I
- —
- Monthly cashflow
- —
- DSCR
- —
- Eligible?
- —
Personal DTI + credit; lowest rate.
DSCR
20% down · 8.5% · 30yr
- Down + closing
- —
- Monthly P&I
- —
- Monthly cashflow
- —
- DSCR
- —
- Eligible?
- —
No personal income docs; deal must DSCR.
Hard money
10% down · 12.0% · 12mo
- Down + closing
- —
- Monthly P&I
- —
- Monthly cashflow
- —
- DSCR
- —
- Eligible?
- —
Short-term bridge; refi at stabilization.
Rent comps 12 comps
| Address | Beds | Baths | Sqft | Rent | $/sqft | DOM | Units | Dist |
|---|---|---|---|---|---|---|---|---|
| 417 Locust St Unit 3 Lodi, CA | — | 1.0 | 499 | $1,000 | $2.00 | 43d | 1 | 0.29mi |
| 537 E Pine St Unit 4 Lodi, CA | 1.0 | 1.0 | 350 | $895 | $2.56 | 3d | 1 | 0.32mi |
| 517 E Pine St #2 Lodi, CA | 1.0 | 1.0 | 500 | $1,195 | $2.39 | 3d | 1 | 0.35mi |
| 515 E Walnut St Lodi, CA | 2.0 | 2.0 | 750 | $1,850 | $2.47 | 19d | 1 | 0.49mi |
| 629 N Sacramento St Lodi, CA | 2.0 | 1.0 | 750 | $1,595 | $2.13 | 43d | 1 | 0.69mi |
| 403 N School St Unit 7 Lodi, CA | 1.0 | 1.0 | 525 | $1,100 | $2.10 | 43d | 1 | 0.74mi |
| 404 W Walnut St Unit B, Lodi, CA | — | 1.0 | 400 | $1,300 | $3.25 | 11d | 1 | 1.11mi |
| 404 W Walnut St Unit A, Lodi, CA | 1.0 | 1.0 | 600 | $1,495 | $2.49 | 43d | 1 | 1.11mi |
| 619 S Sacramento St Unit 619 Lodi, CA | 2.0 | 1.0 | 650 | $1,800 | $2.77 | 43d | 1 | 1.15mi |
| 735 S Sacramento St Apt 3 Lodi, CA | 1.0 | 1.0 | 475 | $895 | $1.88 | 3d | 1 | 1.23mi |
| 200 E Vine St Lodi, CA | 1.0 | 1.0 | 625 | $1,195 | $1.91 | 43d | 1 | 1.24mi |
| 310 S Orange Ave Lodi, CA | 1.0–3.0 | 1.0–2.0 | 680 | $1,350 | $1.99 | 1d | 6 | 1.48mi |
Listing history 15 events
-
2026-06-18days on market $48,500 Active 51 DOM
-
2026-06-17days on market $48,500 Active 50 DOM
-
2026-06-16days on market $48,500 Active 49 DOM
-
2026-06-15days on market $48,500 Active 48 DOM
-
2026-06-14days on market $48,500 Active 46 DOM
-
2026-06-10days on market $48,500 Active 43 DOM
-
2026-06-09days on market $48,500 Active 42 DOM
-
2026-06-08days on market $48,500 Active 41 DOM
-
2026-06-07days on market $48,500 Active 40 DOM
-
2026-06-05days on market $48,500 Active 37 DOM
-
2026-06-03days on market $48,500 Active 36 DOM
-
2026-06-03days on market $48,500 Active 35 DOM
-
2026-06-01days on market $48,500 Active 34 DOM
-
2026-05-31days on market $48,500 Active 33 DOM
-
2026-04-28$48,500 Active 290-char remark
ⓘ Source: listings_history table (triggers on properties + properties_extension) + one-shot
backfill from property_details.listing_events for pre-trigger history.
Climate risk First Street
- Flood 1/10 Low FEMA zone X (shaded) · 0% chance over 30 yrs
- Wildfire 4/10 Moderate
- Heat 7/10 Severe 7 d/yr ≥101°F today · 14 d/yr by 30 yrs out
- Wind 1/10 Low
- Air quality 10/10 Extreme 27 unhealthy d/yr today · 29 by 30 yrs out
Nearby sold comps map
Loading sold comps map…
Walkable amenities ~0.75 mi
Loading nearby amenities…
Taxation est. · year 1
- Rental income
- $15,842
- − Mortgage interest
- −$2,717
- − Property taxes
- −$728
- − Insurance
- −$242
- − Repairs & maintenance
- −$1,267
- − Management
- −$1,267
- − Depreciation
- −$1,411
- Taxable income
- $8,210
- Est. tax owed @ 24.0%
- −$1,970
- After-tax cash flow
- $6,523/yr
For passive investors: Depreciation is non-cash, so a rental often shows a tax loss while cash-flowing — sheltering income. Rental losses are passive: they offset passive income freely, and up to $25,000/yr can offset ordinary (W-2) income if you actively participate and your MAGI is under $100k (phasing out to $0 by $150k); unused losses carry forward. On sale, claimed depreciation is recaptured at up to 25%, and gains may owe capital-gains tax (a 1031 exchange can defer both). Figures are a year-1 estimate at your 24.0% rate — not tax advice; consult a CPA.
Schools (NCES district)
- District
- Lodi Unified
- NCES district ID
- 0622230
- Math proficiency
- 24% ▼ -8.00%
- Reading proficiency
- 36% ▼ -8.00%
- Median HH income
- $57,165
- Composite
- 26.84/100
- National rank
- #7108
- State rank
- #325 of 517 in CA
Livability — Lodi
- Score
- 58/100
- State rank
- #730
- US rank
- #21523
Category grades
Schools grade is shown separately in the Schools card above.
Census & demographics
- Census place
- Lodi, CA
- County
- San Joaquin County · 729,570 people
- City population
- 78,944
- Metro
- Stockton, CA
- Population (ZIP)
- 50,517
- Household income
- $82,137
- Rent vs Own
- Severe rent burden
- 1918.0
Population outlook (San Joaquin County) Hauer SSP2
- Today (2025)
- 796,965 people
- By 2030
- 828,849 · +4.0%
- By 2040
- 885,611 · +11.1%
- By 2050
- 929,798 · +16.7%
- By 2075
- 994,578 · +24.8%
- By 2100
- 971,291 · +21.9%
Race, ethnicity, and origin ACS 2023
- Neighborhood character
- Diverse neighborhood (Simpson 0.63)
- Race & ethnicity
- Hispanic / Latino 48% White 35% Two or more races 26% Asian 12% Native American 1%
- Hispanic origin (detail)
- Mexican 44% Puerto Rican 1%
- Common ancestry
- Italian 3% Lithuanian 1% Russian 1%
- Foreign-born
- 25% · Canada
- Languages at home
- 55% English-only · Spanish 35% Other Indo-European 7% Tagalog/Filipino 1%
Political lean MEDSL · San Joaquin
- 2024 margin
- Toss-up / Even · D 48.0% · R 48.9% · Other 3.0%
- 2008→2024 swing
- -11.6pp toward R · 2008: 10.7pp · 2024: -0.9pp
- All cycles
- 2024: R+0.9 2020: D+13.9 2016: D+12.9 2012: D+8.9 2008: D+10.7
Not yet ingested
- Civics
- —
Market trends
- HPI YoY
- ▼ -469.68%
- Current HPI
- 320.685
- Rent YoY
- ▲ 2.08%
- Metro
- Stockton, CA
- State GDP YoY
- ▲ 3.21%
- F500 in state
- 116
Industry mix (Fortune 500 HQ in CA)
| Industry | F500 HQs | Revenue |
|---|---|---|
| Technology | 27 | $1,492B |
|
||
| Financial Services | 3 | $174B |
|
||
| Retail | 3 | $44B |
|
||
| Insurance | 3 | $26B |
|
||
| Media / Entertainment | 2 | $115B |
|
||
| Pharmaceuticals / Biotech | 2 | $62B |
|
||
Price history
1 event — show timeline
- 2026-04-28 Listed $48,500 bridgeMLS, Bay East AOR, or Contra Costa AOR
Cash-flow waterfall
monthlySold comps — $/sqft
last 12 mo · ≤1 miLoading sold comps…