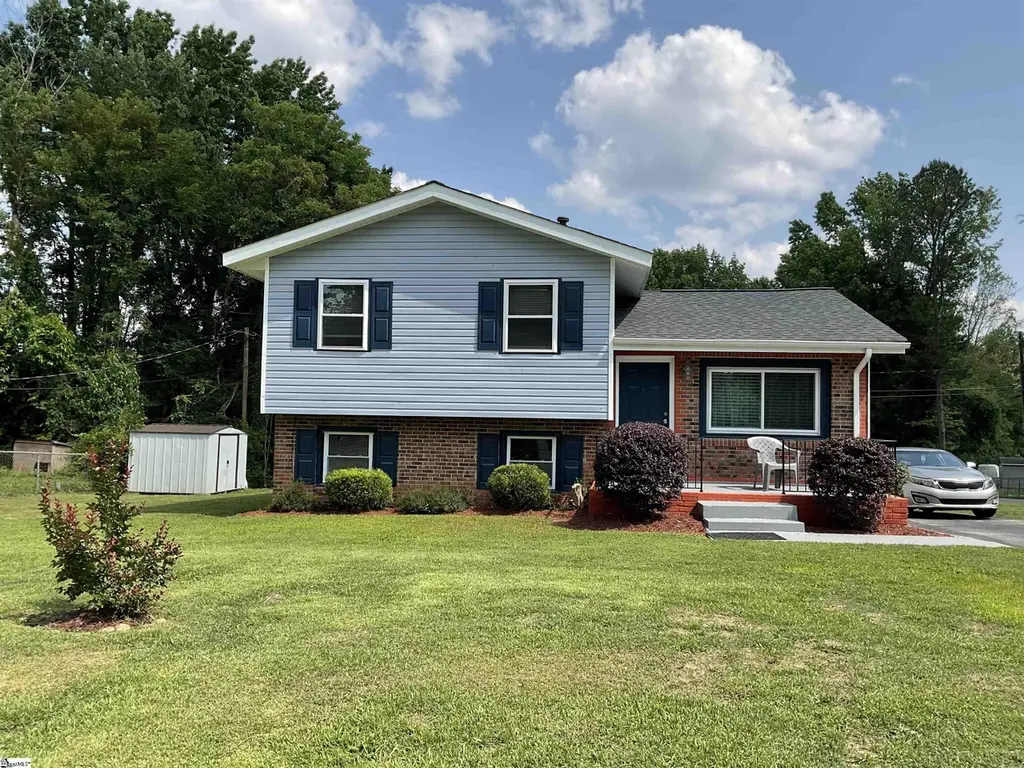
407 Old Farm Rd · Spartanburg, SC
Flood risk 1/10 · Minimal
- FEMA flood zone
- X (unshaded)
- Chance of flooding over 30 yrs
- 0.0%
- Est. flood insurance / yr
- $473 – $860
Fire risk 3/10 · Minor
- Est. fire insurance / yr
- $783 – $1,453
Heat risk 6/10 · Moderate
- Hot days now (above 105°F)
- 7 days/yr
- Hot days in 30 yrs
- 16 days/yr
Wind risk 2/10 · Minimal
- Chance of severe wind over 30 yrs
- 2.0%
Air-quality risk 4/10 · Minor
- Unhealthy air days now
- 4 days/yr
- Unhealthy air days in 30 yrs
- 5 days/yr
Risk factors via First Street. Map © Google.
Why this score? — see what drove the C grade
The composite is a weighted blend of 9 inputs, each scored 0–100. Each bar is that input's sub-score; the figure is the points it added to the 100-point composite (weight × sub-score).
- Cash flow +17.1/30.0
- ARV discount +15.0/15.0
- DSCR +5.3/10.0
- Appreciation +5.0/10.0
- Livability +3.8/5.0
- 1% rule +3.4/10.0
- Schools +3.2/10.0
- Rent growth +2.5/5.0
- Condition / age +2.5/5.0
$216,000
🖨 Deal sheet 📄 Offer letter ✓ Due diligence
Listing remarks MLS
Newly renovated home. Convenient location close to I85 and 26. Close to shopping and schools. Dist. 6 schools. Tri-level adorable 3BR/1.5BA home. Tri-Level featuring a large downstairs lower level area, could be a 4th Bedroom, man cave, she cave, loft or In-Law suite with a half Bath and separate entrance if needed. Updated kitchen with neutral colors, updated counters and floors. NEW ROOF. NEW WINDOWS. Upstairs are 3 bedrooms with ample closet space. Call today to schedule your appointment before this opportunity passes you by!
Key facts
- Expansive lot
- Backyard patio
- 0.39 acre lot
Tags
Property features AI
Finance
- HOA & community: No HOA fees; Pets allowed in the community
Exterior
- Parking: Driveway parking; Paved driveway; No garage
- Utilities: Public water; Gas water heater; Public sewer; Central forced cooling; Private garbage pickup
- Home design: Tri/split level home; Approximately 31–50 years old; Outbuilding for storage; Crawl space/slab foundation
- Construction: Partial brick veneer and vinyl siding exterior; Composition shingle roof
- Exterior features: Patio; Some storm doors; Tilt-out windows; Thermal windows; Corner lot; Approximate lot dimensions 93 x 181 x 82 x 183; Lot one-half acre or less
Interior
- Kitchen: Kitchen approx. 8 x 12; Dishwasher; Refrigerator; Electric cooktop
- Bedrooms: Three bedrooms on the main level; Primary bedroom with separate shower; Primary bedroom approx. 13 x 11; Second bedroom approx. 11 x 10; Third bedroom approx. 10 x 9; Fourth bedroom/room approx. 12 x 24
- Flooring: Luxury vinyl tile/plank flooring
- Bathrooms: One full bathroom on the main level; One half bathroom
- Heating & cooling: Natural gas heating
- Interior features: Cable available; Some window treatments; Laminate countertops; No fireplace; Other finished room(s) (see remarks)
- Laundry & utility: Laundry in basement — closet-style and walk-in options
Neighborhood map
What this means for you Summary
Snapshot
- This is a 3-bed/1.5-bath single-family listed at $216k.
Deal economics
- At list price, monthly cash flow is $149 ($2k/yr) — positive.
- The deal already cash-flows at list — no discount required.
- To meet the 1% rule (rent ≥ 1% of price), the offer needs to be $182k (15.6% below list).
- Recommended offer: $182k (15.6% below list) — sets the bar for 1% rule.
Location & tenants
- Location reads 76/100 on livability (#24 in SC, #3,679 nationally) — a middle-class / working-renter tenant base. Strengths: amenities A+, commute A+, cost of living A+; Watch: crime F, employment F.
- Spartanburg 06 (suburban): math 33% / reading 42% proficiency, ranked #35 of 80 in SC (top 44%) — families likely to look elsewhere, expect single-tenant / working-renter base with shorter leases.
- Zoned schools: Anderson Mill Elementary (math 52% / reading 48%, grade D+, #163 of 597 statewide, top 28%, 651 students, 64% FRL) — zoned schools average 64% FRL vs 48% district-wide (15 pts higher); higher-poverty schools than district average — tighter screening recommended.
- Zoned-school proficiency averages 50% at this address vs 38% district-wide (+12 pts) — the actual schools serving this property are materially stronger than the Spartanburg 06 average implies; a family-tenant draw the district grade alone would hide.
- Market conditions: 1 active listings in the ZIP; 8 comparable units currently listed for rent nearby; rentals at typical pace (median 21d on market — plan ~3-4 weeks tenant-placement turnaround); 3,129 units permitted in Spartanburg County in 2024 (40 in 5+ unit buildings).
Forward outlook
- In year one you build about $8k of equity ($1k loan paydown + $6k appreciation (3.0% local appreciation)).
- Spartanburg County population projected at +18% by 2050 — long-run rental-demand tailwind backs the buy-and-hold thesis.
- At projected returns (3.0% appreciation + 3.0% rent growth), your $60k cash investment doubles in ~6 years — after that, you're playing with house money.
- By year 5, paydown + projected appreciation supports a ~$35k cash-out refi (75% LTV) — recoverable capital for the next deal without selling this one.
Negotiation context
- It's been on market 16 days — a 2% lower offer ($213k) is reasonable based on typical stale-listing flexibility.
- 5 sale attempts since 6y ago with the ask held roughly flat each time — persistent listings suggest the price (not the market) is what's stuck; bring a comps-based counter.
- Current owner paid $138k; list at $216k implies a 57% gain — meaningful room to come down on a strong offer.
Risks & watch-outs
- Climate carrying-cost: extreme-heat days projected 7→16/yr by 2055 (HVAC capex compounding) — expect insurance premiums to compound above CPI over the hold.
Questions for the listing agent
- Built in 1971 — when were the roof, HVAC, electrical panel, plumbing, and water heater last replaced?
- Is there a deadline driving the sale (1031 exchange, divorce, estate, relocation)? That informs how much negotiation room exists.
- Schools are D-rated, which usually means shorter tenancies and higher turnover. Who's the typical renter profile here, and what's been the actual vacancy rate?
- Crime grade is F in this area — have there been break-ins, vandalism, or insurance claims at this property in the last 3 years? What carrier currently insures it and at what premium?
- What's the average days-on-market for RENTAL listings here right now (not sales)? A rising rental-DOM trend means longer vacancies and softer asking-rent achievability than the comps imply.
- What's the recent tenant-quality profile in this submarket — average credit score on applications, eviction rate, late-payment / NSF rate, and stable-employment percentage? A property-management company in the area should have these aggregated.
- How much new for-sale + rental construction is in the pipeline within 1–3 miles? Heavy new supply typically softens prices + rents 12–24 months out; constrained supply supports both.
Investment metrics
- 1% rule
- 0.84% ✗
- Cap rate
- 7.12%
- Cash-on-cash
- 2.96%
- DSCR
- 1.13
- GRM
- 9.9
CMA / ARV
- ARV (on-the-fly)
- $267,168
- Comps found
- 12
Show comp detail 12 sales within ~0.75 mi
| Address | Dist | Beds/Ba | Sqft | Sold | Price | $/sf | Match |
|---|---|---|---|---|---|---|---|
| 105 Churchill Ave | 0.46mi | 3/2.0 | 1,424 (-6%) | 1mo | $155,100 | $109 | 65 |
| 207 Old Salem Rd | 0.36mi | 3/2.0 | 1,648 (+9%) | 2mo | $270,000 | $164 | 65 |
| 433 Litchfield Dr | 0.34mi | 3/2.0 | 1,704 (+12%) | 1mo | $305,000 | $179 | 61 |
| 2236 Davenport Court Ct | 0.60mi | 3/2.0 | 1,456 (-4%) | 3mo | $259,930 | $179 | 60 |
| 2245 Davenport Court Ct | 0.63mi | 3/2.0 | 1,456 (-4%) | 2mo | $263,975 | $181 | 60 |
| 2054 Lachaise Ln | 0.63mi | 3/2.0 | 1,576 (+4%) | 3mo | $277,500 | $176 | 60 |
| 221 Angel Rose Dr | 0.33mi | 3/2.0 | 1,295 (-15%) | 2mo | $219,000 | $169 | 56 |
| 2209 Davenport Court Ct | 0.57mi | 3/2.0 | 1,368 (-10%) | 2mo | $260,065 | $190 | 53 |
| 360 Prosperity Ln Lot 60 | 0.42mi | 3/2.5 | 1,709 (+13%) | 3mo | $244,000 | $143 | 52 |
| 225 Georgetown Ct | 0.72mi | 3/2.0 | 1,400 (-8%) | 2mo | $278,900 | $199 | 50 |
| 376 Prosperity Ln Lot 64 | 0.45mi | 4/2.5 (+1) | 1,735 (+14%) | 3mo | $258,114 | $149 | 44 |
| 708 Larado Ct | 0.72mi | 2/2.0 (-1) | 1,369 (-10%) | 3mo | $215,000 | $157 | 41 |
Match score weights: distance 35% · size 25% · config 20% · recency 20%. Top-matched comps best support the ARV.
Projected returns pro-forma
3.0% appreciation · 3.0% rent growth · sell at horizon
- IRR
- 10.2%
- Equity multiple
- 1.59×
- Total profit
- $35,417
- Equity at exit
- $97,123
- IRR
- 12.5%
- Equity multiple
- 2.86×
- Total profit
- $112,679
- Equity at exit
- $149,678
Cash invested: $60,480 (down + closing). Projections, not guarantees.
Landlord ↔ Tenant lean methodology
- Overall (STATE)
- 90 Strongly Landlord-Friendly
- State South Carolina
- 90 Strongly Landlord-Friendly · R+6
- County
- — inherits STATE
- City
- — inherits STATE
ZIP-level market 29539
- Active inventory
- 1
- Price-to-rent
- 9.9×
Monthly cashflow live
- Estimated rent
- $1,824 high interval (Pro) →
- Mortgage (P&I)
- −$1,133
- Tax from tax record
- −$69 /mo · $827/yr
- Insurance
- −$90
- HOA
- −$0
- Vacancy / Maint / Mgmt
- −$383
- Net cashflow
- $149
Break-even live
UW: 25.0% down · 7.5% · 30yr · 1.5% tax · 5.0% vac · 8.0% maint · 8.0% mgmt
Financing live
Cash to close
- Down payment
- $54,000
- Closing costs
- $6,480
- Reserves months
- —
- Total cash needed
- —
Loan-product check · same deal, 3 products live
Conventional
25% down · 7.5% · 30yr
- Down + closing
- —
- Monthly P&I
- —
- Monthly cashflow
- —
- DSCR
- —
- Eligible?
- —
Personal DTI + credit; lowest rate.
DSCR
20% down · 8.5% · 30yr
- Down + closing
- —
- Monthly P&I
- —
- Monthly cashflow
- —
- DSCR
- —
- Eligible?
- —
No personal income docs; deal must DSCR.
Hard money
10% down · 12.0% · 12mo
- Down + closing
- —
- Monthly P&I
- —
- Monthly cashflow
- —
- DSCR
- —
- Eligible?
- —
Short-term bridge; refi at stabilization.
Rent comps 8 comps
| Address | Beds | Baths | Sqft | Rent | $/sqft | DOM | Units | Dist |
|---|---|---|---|---|---|---|---|---|
| 2180 Davenport Ct Moore, SC | 3.0 | 2.0 | 1456 | $2,000 | $1.37 | 13d | 1 | 0.50mi |
| 6039 Haddington Dr Roebuck, SC | 3.0 | 2.5 | 1913 | $1,975 | $1.03 | 21d | 1 | 0.95mi |
| 1071 Simmons Trce Moore, SC | 3.0 | 2.5 | 1407 | $1,725 | $1.23 | 21d | 1 | 1.33mi |
| 1035 Simmons Trce Moore, SC | 3.0 | 2.5 | 1407 | $1,665 | $1.18 | 21d | 1 | 1.36mi |
| 110 Southport Rd Spartanburg, SC | 1.0–3.0 | 1.0–2.0 | 1044 | $1,673 | $1.60 | 13d | 18 | 1.37mi |
| 1308 Simmons Ridge Ln Moore, SC | 3.0 | 2.5 | 1407 | $1,725 | $1.23 | 21d | 1 | 1.39mi |
| 807 Exley Ln Spartanburg, SC | 2.0–3.0 | 2.5–3.0 | 1562 | $1,764 | $1.13 | 3d | 10 | 1.43mi |
| 954 Simmons Trce Moore, SC | 3.0 | 2.5 | 1428 | $1,665 | $1.17 | 13d | 1 | 1.44mi |
Listing history 12 events
-
2026-06-18days on market $216,000 Active 16 DOM
-
2026-06-17days on market $216,000 Active 15 DOM
-
2026-06-16days on market $216,000 Active 14 DOM
-
2026-06-15days on market $216,000 Active 13 DOM
-
2026-06-14days on market $216,000 Active 11 DOM
-
2026-06-13days on market $216,000 Active 10 DOM
-
2026-06-10days on market $216,000 Active 8 DOM
-
2026-06-09days on market $216,000 Active 7 DOM
-
2026-06-08days on market $216,000 Active 6 DOM
-
2026-06-07days on market $216,000 Active 5 DOM
-
2026-06-03remarks 632-char remark
-
2026-06-03$216,000 Active 1 DOM
ⓘ Source: listings_history table (triggers on properties + properties_extension) + one-shot
backfill from property_details.listing_events for pre-trigger history.
Tax reassessment forecast SC · Resets to sale price
- Current annual tax
- $827 · $69/mo
- Projected year-2 tax
- $1,231 · $103/mo
- Expected delta
- +$404/yr (+$34/mo · 48.9%)
ⓘ Screening estimate from a state-policy table — verify with the county assessor before closing.
Climate risk First Street
- Flood 1/10 Low FEMA zone X (unshaded) · 0% chance over 30 yrs
- Wildfire 3/10 Moderate
- Heat 6/10 Major 7 d/yr ≥105°F today · 16 d/yr by 30 yrs out
- Wind 2/10 Low 2% chance of damaging wind over 30 yrs
- Air quality 4/10 Moderate 4 unhealthy d/yr today · 5 by 30 yrs out
Nearby sold comps map
Loading sold comps map…
Walkable amenities ~0.75 mi
Loading nearby amenities…
Taxation est. · year 1
- Rental income
- $21,884
- − Mortgage interest
- −$12,099
- − Property taxes
- −$827
- − Insurance
- −$1,080
- − Repairs & maintenance
- −$1,751
- − Management
- −$1,751
- − Depreciation
- −$6,284
- Taxable loss
- −$1,908
- Est. tax savings @ 24.0%
- +$458
- After-tax cash flow
- $2,246/yr
For passive investors: Depreciation is non-cash, so a rental often shows a tax loss while cash-flowing — sheltering income. Rental losses are passive: they offset passive income freely, and up to $25,000/yr can offset ordinary (W-2) income if you actively participate and your MAGI is under $100k (phasing out to $0 by $150k); unused losses carry forward. On sale, claimed depreciation is recaptured at up to 25%, and gains may owe capital-gains tax (a 1031 exchange can defer both). Figures are a year-1 estimate at your 24.0% rate — not tax advice; consult a CPA.
Schools (NCES district)
- District
- Spartanburg 06
- NCES district ID
- 4503630
- Math proficiency
- 33% ▼ -8.00%
- Reading proficiency
- 42% ▼ -2.00%
- Median HH income
- $46,110
- Composite
- 32.02/100
- National rank
- #5827
- State rank
- #35 of 80 in SC
Livability — Spartanburg
- Score
- 76/100
- State rank
- #24
- US rank
- #3679
Category grades
Schools grade is shown separately in the Schools card above.
Census & demographics
No demographic data for this ZIP.
Market trends
- HPI YoY
- —
- Current HPI
- —
- Rent YoY
- —
- Metro
- —
- State GDP YoY
- ▲ 4.51%
- F500 in state
- 2
Industry mix (Fortune 500 HQ in SC)
| Industry | F500 HQs | Revenue |
|---|---|---|
| Packaging | 1 | $7B |
|
||
Price history
+622.4% since first listed16 events — show timeline
- 2026-06-02 Listed $216,000 Greater Greenville MLS
- 2025-11-07 Listing Removed — Greater Greenville MLS
- 2025-08-07 Relisted — Greater Greenville MLS
- 2025-07-27 Contingent — Greater Greenville MLS
- 2025-06-06 Listed $223,000 Greater Greenville MLS
- 2020-08-05 Sold (Public Records) $138,000 Public Records
- 2020-07-31 Sold (MLS) $138,000 SPMLS
- 2020-06-16 Contingent — SPMLS
- 2020-06-02 Price Changed $138,000 SPMLS
- 2020-06-01 Relisted — SPMLS
- 2020-05-01 Contingent — SPMLS
- 2020-04-10 Price Changed $134,900 SPMLS
- 2020-03-21 Price Changed $139,900 SPMLS
- 2020-03-20 Listed $128,000 SPMLS
- 2004-05-24 Sold (Public Records) $78,000 Public Records
- 1985-06-01 Sold (Public Records) $29,900 Public Records
Property tax history
-5.8%/yrLatest (2025): $827 · -28.5% YoY. Source: county tax records.
Cash-flow waterfall
monthlySold comps — $/sqft
last 12 mo · ≤1 miLoading sold comps…