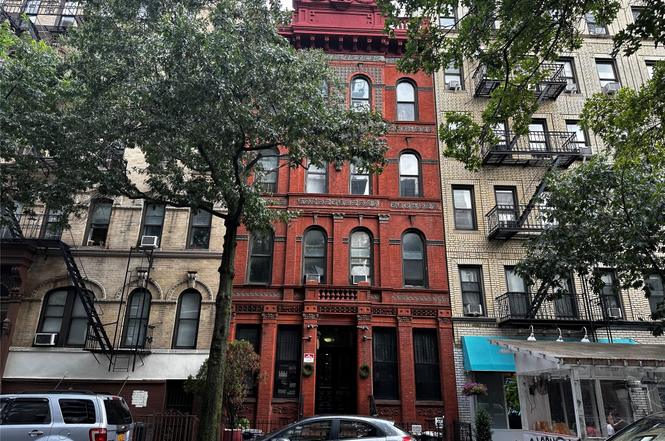
153 4th St #5 · New York, NY
Flood risk 1/10 · Minimal
- FEMA flood zone
- X (unshaded)
- Chance of flooding over 30 yrs
- 0.0%
- Est. flood insurance / yr
- $507 – $1,088
Fire risk 1/10 · Minimal
- Est. fire insurance / yr
- $691 – $1,283
Heat risk 6/10 · Moderate
- Hot days now (above 99°F)
- 7 days/yr
- Hot days in 30 yrs
- 14 days/yr
Wind risk 6/10 · Moderate
- Chance of severe wind over 30 yrs
- 27.0%
Air-quality risk 4/10 · Minor
- Unhealthy air days now
- 5 days/yr
- Unhealthy air days in 30 yrs
- 7 days/yr
Risk factors via First Street. Map © Google.
Why this score? — see what drove the A- grade
The composite is a weighted blend of 9 inputs, each scored 0–100. Each bar is that input's sub-score; the figure is the points it added to the 100-point composite (weight × sub-score).
- Cash flow +30.0/30.0
- 1% rule +10.0/10.0
- DSCR +10.0/10.0
- Appreciation +10.0/10.0
- ARV discount +7.5/15.0
- Schools +5.0/10.0
- Rent growth +4.0/5.0
- Livability +3.8/5.0
- Condition / age +2.5/5.0
$410,000
🖨 Deal sheet (PDF) 📄 Offer letter ✓ Due diligence
Listing remarks
Welcome to this spacious and sunny 2 bedroom apartment in the heart of Williamsburg, Brooklyn. This unit features hardwood floors, high ceilings, large windows. The bedrooms are generously sized and can fit queen beds and furniture. There is also ample closet space and a washer and dryer in the unit. The building is a historic walk-up with a charming brick facade and a shared rooftop deck with stunning views of the Manhattan skyline. The location is unbeatable, just steps away from the Bedford Avenue L train station and the East River Ferry. You will also enjoy the vibrant neighborhood with its many restaurants, bars, cafes, shops, and parks. This is a rare opportunity to live in one of the
Key facts
- Large windows
- Historic walk-up
- Washer and dryer
Tags
Neighborhood map
What this means for you Summary
Snapshot
- This is a 2-bed/1.0-bath condo listed at $410k.
Deal economics
- At list price, monthly cash flow is $2k ($27k/yr) — positive.
- The deal already cash-flows at list — no discount required.
- Meets the 1% rule at list price ($6k rent vs $410k).
- Cap rate 12.9% vs local median 2.6% in New York — top-decile yield for the area; either an underpriced asset or a hidden risk that comps aren't pricing in. Stress-test before assuming the spread holds.
Location & tenants
- Location reads 75/100 on livability (#268 in NY, #4,188 nationally) — a middle-class / working-renter tenant base. Strengths: amenities A+, commute A+, health & safety A; Watch: crime F, cost of living F.
- Zoned schools: Elm Tree Elementary School (math 27% / reading 52%, grade F, #1,444 of 2,108 statewide, top 71%, 806 students, 94% FRL); Is 318 Eugenio Maria De Hostos (math 54% / reading 74%, grade A-, #121 of 729 statewide, top 17%, 1,069 students, 64% FRL); Midwood High School (math 94% / reading 96%, grade A+, #83 of 1,100 statewide, top 8%, 4,062 students, 73% FRL).
- Market conditions: Rents rising fast (+6.1%/yr); 135 active listings in the ZIP; 11 comparable units currently listed for rent nearby; rentals leasing fast (median 9d on market — plan ~1-2 weeks tenant-placement turnaround); solid renter incomes; 10,063 units permitted in Kings County in 2024 (9,789 in 5+ unit buildings).
- At $6,435/mo this rent would consume 72% of the median local household income ($108k/yr) (locally 5879% of renters already pay >50% of income on rent) — very limited rent-growth headroom before tenants either downsize or default.
Forward outlook
- In year one you build about $44k of equity ($3k loan paydown + $41k appreciation (10.0% local appreciation)).
- Kings County population projected at +13% by 2050 — modest demand growth; plan on rents tracking national, not racing it.
- At projected returns (10.0% appreciation + 6.1% rent growth), your $115k cash investment doubles in ~2 years — after that, you're playing with house money.
- By year 2, paydown + projected appreciation supports a ~$70k cash-out refi (75% LTV) — recoverable capital for the next deal without selling this one.
Negotiation context
- Only 12 days on market — expect competitive offers; lowballing is unlikely to land.
- 2 sale attempts since 3y ago with the ask held roughly flat each time — persistent listings suggest the price (not the market) is what's stuck; bring a comps-based counter.
Risks & watch-outs
- Watch-outs: built in 1890 — expect roof / HVAC / electrical / plumbing capex.
- Climate carrying-cost: major wind risk, 27% chance of damaging wind over 30y; extreme-heat days projected 7→14/yr by 2055 (HVAC capex compounding) — expect insurance premiums to compound above CPI over the hold.
Questions for the listing agent
- Built in 1890 — when were the roof, HVAC, electrical panel, plumbing, and water heater last replaced?
- Any open or pending special assessments — roof, HVAC, plumbing, elevator, façade? What's the per-unit balance and payoff schedule, and is the seller paying it off at close or rolling it to the buyer?
- Is there a deadline driving the sale (1031 exchange, divorce, estate, relocation)? That informs how much negotiation room exists.
- Schools are B-rated — typically a magnet for longer-tenancy family renters. What's the average tenant stay here, and is there a school-zone premium baked into asking?
- Crime grade is F in this area — have there been break-ins, vandalism, or insurance claims at this property in the last 3 years? What carrier currently insures it and at what premium?
- What's the average days-on-market for RENTAL listings here right now (not sales)? A rising rental-DOM trend means longer vacancies and softer asking-rent achievability than the comps imply.
- What's the recent tenant-quality profile in this submarket — average credit score on applications, eviction rate, late-payment / NSF rate, and stable-employment percentage? A property-management company in the area should have these aggregated.
- How much new apartment / multifamily construction is in the pipeline within 1–3 miles? Heavy new supply (>2% of stock underway) typically softens rents 12–24 months out; light construction supports rent growth.
Investment metrics
- 1% rule
- 1.57% ✓
- Cap rate
- 12.88%
- Cash-on-cash
- 23.52%
- DSCR
- 2.05
- GRM
- 5.3
CMA / ARV
No comps found within radius.
Projected returns pro-forma
10.0% appreciation · 6.06% rent growth · sell at horizon
- IRR
- 43.7%
- Equity multiple
- 4.37×
- Total profit
- $387,117
- Equity at exit
- $369,360
- IRR
- 39.0%
- Equity multiple
- 10.36×
- Total profit
- $1,074,371
- Equity at exit
- $796,540
Cash invested: $114,800 (down + closing). Projections, not guarantees.
Landlord ↔ Tenant lean methodology
- Overall (CITY)
- 0 Strongly Tenant-Friendly
- State New York
- 15 Strongly Tenant-Friendly · D+10
- County
- — inherits STATE
- City New York
- 0 Strongly Tenant-Friendly · D+34
ZIP-level market 11211
- Home prices YoY
- 2.6%
- Rents YoY
- 6.1%
- Active inventory
- 135
- Price-to-rent
- 5.3×
Monthly cashflow live
- Estimated rent
- $6,435 high interval (Pro) →
- Mortgage (P&I)
- −$2,150
- Tax est. 1.5%
- −$512 /mo · $6,150/yr
- Insurance
- −$171
- HOA
- −$0
- Vacancy / Maint / Mgmt
- −$1,351
- Net cashflow
- $2,250
Break-even live
Sensitivity live
| Price | -10% $2,533 | -5% $2,392 | +0% $2,250 | +5% $2,108 | +10% $1,967 |
|---|---|---|---|---|---|
| Rent | -10% $1,742 | -5% $1,996 | +0% $2,250 | +5% $2,504 | +10% $2,758 |
| Rate | -1.0pp $2,457 | -0.5pp $2,354 | base $2,250 | +0.5pp $2,144 | +1.0pp $2,036 |
UW: 25.0% down · 7.5% · 30yr · 1.5% tax · 5.0% vac · 8.0% maint · 8.0% mgmt
Financing live
Cash to close
- Down payment
- $102,500
- Closing costs
- $12,300
- Reserves months
- —
- Total cash needed
- —
Loan-product check · same deal, 3 products live
Conventional
25% down · 7.5% · 30yr
- Down + closing
- —
- Monthly P&I
- —
- Monthly cashflow
- —
- DSCR
- —
- Eligible?
- —
Personal DTI + credit; lowest rate.
DSCR
20% down · 8.5% · 30yr
- Down + closing
- —
- Monthly P&I
- —
- Monthly cashflow
- —
- DSCR
- —
- Eligible?
- —
No personal income docs; deal must DSCR.
Hard money
10% down · 12.0% · 12mo
- Down + closing
- —
- Monthly P&I
- —
- Monthly cashflow
- —
- DSCR
- —
- Eligible?
- —
Short-term bridge; refi at stabilization.
Rent comps 11 comps
| Address | Beds | Baths | Sqft | Rent | $/sqft | DOM | Units | Dist |
|---|---|---|---|---|---|---|---|---|
| 11 Wharf Way Brooklyn, NY | 1.0 | 1.0 | 610 | $4,870 | $7.98 | 1d | 2 | 0.45mi |
| 482 Kent Ave Brooklyn, NY | 2.0 | 1.0–2.0 | 750 | $8,290 | $11.05 | 1d | 3 | 0.48mi |
| 478 Kent Ave Brooklyn, NY | 2.0 | 1.0–2.0 | 775 | $7,530 | $9.72 | 4d | 3 | 0.48mi |
| 184 Kent Ave Brooklyn, NY | 1.0 | 1.0 | 753 | $5,800 | $7.70 | 26d | 1 | 0.48mi |
| 250 Union Ave #2119 Brooklyn, NY | 1.0–2.0 | 1.0 | 590 | $4,900 | $8.31 | 26d | 2 | 0.67mi |
| 68 Gold St New York, NY | 1.0–2.0 | 1.0 | 700 | $7,050 | $10.07 | 26d | 2 | 1.20mi |
| 180 Broome St #1521 New York, NY | 1.0–2.0 | 1.0–2.0 | 850 | $10,630 | $12.51 | 3d | 2 | 1.32mi |
| 171 Suffolk St #1265 New York, NY | 1.0–2.0 | 1.0 | 650 | $8,710 | $13.40 | 9d | 2 | 1.38mi |
| 125 Delancey St #1523 New York, NY | 1.0–2.0 | 1.0–2.0 | 850 | $9,670 | $11.38 | 3d | 2 | 1.43mi |
| 285 Kingsland Ave #2078 Brooklyn, NY | 1.0–2.0 | 1.0–2.0 | 725 | $6,380 | $8.80 | 26d | 2 | 1.44mi |
| 100 Jay St Unit 6B Brooklyn, NY | 1.0 | 1.0 | 800 | $4,600 | $5.75 | 26d | 1 | 1.49mi |
HOA detail condo
- Monthly dues
- $0 · $0/yr
- Assessments
- None detected in remarks — confirm with the listing agent.
Listing history 6 events
-
2025-03-19status Pending
-
2025-03-07$410,000 Active
-
2023-12-07status Pending
-
2023-12-07historical
-
2023-08-25price $399,000
-
2023-08-25$425,000 Active
ⓘ Source: listings_history table (triggers on properties + properties_extension) + one-shot
backfill from property_details.listing_events for pre-trigger history.
Climate risk First Street
- Flood 1/10 Low FEMA zone X (unshaded) · 0% chance over 30 yrs
- Wildfire 1/10 Low
- Heat 6/10 Major 7 d/yr ≥99°F today · 14 d/yr by 30 yrs out
- Wind 6/10 Major 27% chance of damaging wind over 30 yrs
- Air quality 4/10 Moderate 5 unhealthy d/yr today · 7 by 30 yrs out
Nearby sold comps map
Loading sold comps map…
Walkable amenities ~0.75 mi
Loading nearby amenities…
Taxation est. · year 1
- Rental income
- $77,217
- − Mortgage interest
- −$22,966
- − Property taxes
- −$6,150
- − Insurance
- −$2,050
- − Repairs & maintenance
- −$6,177
- − Management
- −$6,177
- − Depreciation
- −$11,927
- Taxable income
- $21,769
- Est. tax owed @ 24.0%
- −$5,224
- After-tax cash flow
- $21,776/yr
For passive investors: Depreciation is non-cash, so a rental often shows a tax loss while cash-flowing — sheltering income. Rental losses are passive: they offset passive income freely, and up to $25,000/yr can offset ordinary (W-2) income if you actively participate and your MAGI is under $100k (phasing out to $0 by $150k); unused losses carry forward. On sale, claimed depreciation is recaptured at up to 25%, and gains may owe capital-gains tax (a 1031 exchange can defer both). Figures are a year-1 estimate at your 24.0% rate — not tax advice; consult a CPA.
Schools (NCES district)
No district data.
Livability — New York
- Score
- 75/100
- State rank
- #268
- US rank
- #4188
Category grades
Schools grade is shown separately in the Schools card above.
Census & demographics
- Census place
- New York, NY
- County
- Kings County · 2,614,986 people
- City population
- 7,731,280
- Metro
- New York-Newark-Jersey City, NY-NJ-PA
- Population (ZIP)
- 65,314
- Household income
- $107,506
- Rent vs Own
- Severe rent burden
- 5879.0
Population outlook (Kings County) Hauer SSP2
- Today (2025)
- 2,847,441 people
- By 2030
- 2,937,006 · +3.1%
- By 2040
- 3,095,491 · +8.7%
- By 2050
- 3,228,968 · +13.4%
- By 2075
- 3,321,723 · +16.7%
- By 2100
- 3,111,387 · +9.3%
Race, ethnicity, and origin ACS 2023
- Neighborhood character
- Diverse neighborhood (Simpson 0.58)
- Race & ethnicity
- White 59% Hispanic / Latino 26% Two or more races 9% Asian 7% Black 4%
- Hispanic origin (detail)
- Mexican 3% Puerto Rican 10% Dominican 6%
- Common ancestry
- Italian 4% Romanian 3% Lithuanian 2%
- Foreign-born
- 23% · Canada, China, Jamaica
- Languages at home
- 50% English-only · Spanish 21% German/W. Germanic 17% Other Indo-European 3%
Political lean MEDSL · Kings
- 2024 margin
- Solid D (+44.0) · D 72.0% · R 28.0%
- 2008→2024 swing
- -15.5pp toward R · 2008: 59.4pp · 2024: 44.0pp
- All cycles
- 2024: D+44.0 2020: D+54.8 2016: D+61.8 2012: D+63.9 2008: D+59.4
Not yet ingested
- Civics
- —
Market trends
- HPI YoY
- ▲ 14.72%
- Current HPI
- 588.2538
- Rent YoY
- ▲ 6.06%
- Metro
- New York-Newark-Jersey City, NY-NJ-PA
- State GDP YoY
- ▲ 2.60%
- F500 in state
- 92
Industry mix (Fortune 500 HQ in NY)
| Industry | F500 HQs | Revenue |
|---|---|---|
| Financial Services | 10 | $950B |
|
||
| Consumer Goods | 9 | $162B |
|
||
| Insurance | 4 | $225B |
|
||
| Telecommunications | 2 | $144B |
|
||
| Pharmaceuticals | 2 | $112B |
|
||
| Media / Entertainment | 2 | $69B |
|
||
Price history
-3.5% since first listed6 events — show timeline
- 2025-03-19 Pending — OneKey® MLS as Distributed by MLS Grid
- 2025-03-07 Listed $410,000 OneKey® MLS as Distributed by MLS Grid
- 2023-12-07 Pending — OneKey® MLS as Distributed by MLS Grid
- 2023-12-07 Listing Removed — OneKey® MLS as Distributed by MLS Grid
- 2023-08-25 Price Changed $399,000 OneKey® MLS as Distributed by MLS Grid
- 2023-08-25 Listed $425,000 OneKey® MLS as Distributed by MLS Grid
Cash-flow waterfall
monthlySold comps — $/sqft
last 12 mo · ≤1 miLoading sold comps…