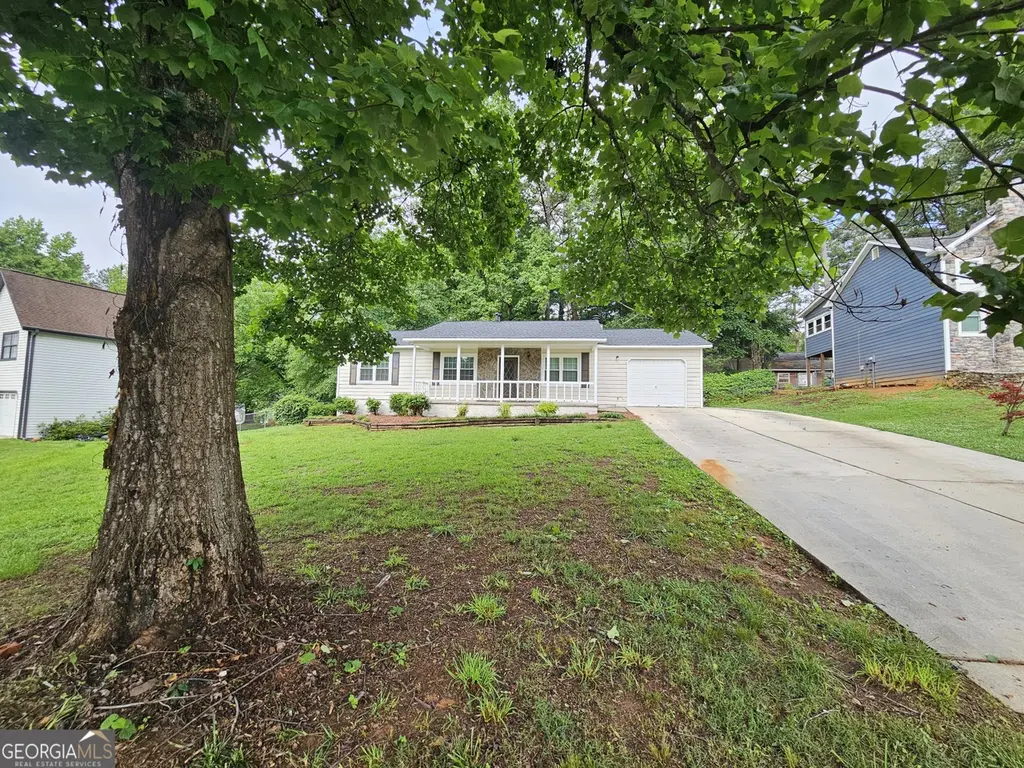
2896 Old South Dr · Stockbridge, GA
Flood risk 1/10 · Minimal
- FEMA flood zone
- X (unshaded)
- Chance of flooding over 30 yrs
- 0.0%
- Est. flood insurance / yr
- $507 – $1,088
Fire risk 1/10 · Minimal
- Est. fire insurance / yr
- $963 – $1,789
Heat risk 6/10 · Moderate
- Hot days now (above 106°F)
- 7 days/yr
- Hot days in 30 yrs
- 18 days/yr
Wind risk 5/10 · Moderate
- Chance of severe wind over 30 yrs
- 26.0%
Air-quality risk 4/10 · Minor
- Unhealthy air days now
- 5 days/yr
- Unhealthy air days in 30 yrs
- 6 days/yr
Risk factors via First Street. Map © Google.
Why this score? — see what drove the F grade
The composite is a weighted blend of 9 inputs, each scored 0–100. Each bar is that input's sub-score; the figure is the points it added to the 100-point composite (weight × sub-score).
- Cash flow +14.4/30.0
- DSCR +4.4/10.0
- 1% rule +3.9/10.0
- Rent growth +3.0/5.0
- Livability +3.0/5.0
- Condition / age +2.5/5.0
- Schools +1.3/10.0
- ARV discount +0.9/15.0
- Appreciation +0.0/10.0
$199,900
🖨 Deal sheet (PDF) 📄 Offer letter ✓ Due diligence
Listing remarks
Cozy ranch home with 3 bedrooms and 2 baths. Recently renovated. Laminate flooring throughout. Great for first time home owners! Hurry, it won't last long!
Key facts
- Garage
- Built 1980
- Listed 7 days
Property features AI
Finance
- Other: Public records list living/building area as 1332
- HOA & community: No HOA
Exterior
- Parking: Attached garage
- Utilities: Public water; Public sewer; Electricity available; Propane available; High-speed internet available; Cable available; Phone available; Sewer connected; Water available
- Home design: Single-family residence; House; Resale property; One story
- Construction: Built in 1980; Stone and wood siding exterior; Composition roof
- Exterior features: Level lot
Interior
- Kitchen: Dishwasher
- Bedrooms: 3 bedrooms on the main level
- Flooring: Laminate flooring
- Bathrooms: 2 full bathrooms (main level)
- Heating & cooling: Central heating; Central air conditioning
- Interior features: One-level living; Family room; Fireplace (1)
- Laundry & utility: Laundry area (other)
Neighborhood map
What this means for you Summary
Snapshot
- This is a 3-bed/2.0-bath single-family listed at $200k.
Deal economics
- At list price, monthly cash flow is $42 ($499/yr) — positive.
- The deal already cash-flows at list — no discount required.
- To meet the 1% rule (rent ≥ 1% of price), the offer needs to be $178k (10.7% below list).
- Recommended offer: $178k (10.7% below list) — sets the bar for 1% rule.
- Cap rate 6.5% vs local median 4.3% in Stockbridge — top-decile yield for the area; either an underpriced asset or a hidden risk that comps aren't pricing in. Stress-test before assuming the spread holds.
Location & tenants
- Location reads 60/100 on livability (#389 in GA) — a middle-class / working-renter tenant base. Strengths: housing A+, cost of living A; Watch: crime D, amenities F, commute F.
- Clayton County (suburban): math 11% / reading 20% proficiency, ranked #155 of 174 in GA (top 89%) — low school quality limits family demand, transient renter base, plan for 1-2y turnover; 78% free/reduced lunch — lower-income household profile, screen leases tightly.
- Zoned schools: James Jackson Elementary School (math 5% / reading 24%, grade F, #988 of 1,228 statewide, top 81%, 633 students, 90% FRL); M. D. Roberts Middle School (math 22% / reading 37%, grade F, #249 of 470 statewide, top 55%, 852 students, 90% FRL); Mount Zion High School (math 2% / reading 23%, grade F, #333 of 424 statewide, top 78%, 1,239 students, 91% FRL).
- Market conditions: Rents rising (+2.1%/yr); 265 active listings in the ZIP; 34 comparable units currently listed for rent nearby; rentals at typical pace (median 23d on market — plan ~3-4 weeks tenant-placement turnaround); 865 units permitted in Clayton County in 2024 (448 in 5+ unit buildings).
- This rent runs 32% of the median local income ($67k/yr) — at the standard rent-burdened threshold; future hikes will face affordability resistance.
Forward outlook
- Local home prices are declining (-3.0%/yr); year-one equity from $1k of loan paydown is wiped out by about $6k of value loss. Plan a longer hold.
- Clayton County population projected at +29% by 2050 — long-run rental-demand tailwind backs the buy-and-hold thesis.
Negotiation context
- Only 7 days on market — expect competitive offers; lowballing is unlikely to land.
- Current owner paid $125k; list at $200k implies a 60% gain — meaningful room to come down on a strong offer.
Risks & watch-outs
- Climate carrying-cost: moderate wind risk, 26% chance of damaging wind over 30y; extreme-heat days projected 7→18/yr by 2055 (HVAC capex compounding) — expect insurance premiums to compound above CPI over the hold.
Questions for the listing agent
- Is there a deadline driving the sale (1031 exchange, divorce, estate, relocation)? That informs how much negotiation room exists.
- Schools are D-rated, which usually means shorter tenancies and higher turnover. Who's the typical renter profile here, and what's been the actual vacancy rate?
- Crime grade is D in this area — have there been break-ins, vandalism, or insurance claims at this property in the last 3 years? What carrier currently insures it and at what premium?
- The area grade is low — what's the realistic commute time and amenity access for the typical tenant pool here? Any planned neighborhood developments (good or bad) we should know about?
- What's the average days-on-market for RENTAL listings here right now (not sales)? A rising rental-DOM trend means longer vacancies and softer asking-rent achievability than the comps imply.
- What's the recent tenant-quality profile in this submarket — average credit score on applications, eviction rate, late-payment / NSF rate, and stable-employment percentage? A property-management company in the area should have these aggregated.
- How much new for-sale + rental construction is in the pipeline within 1–3 miles? Heavy new supply typically softens prices + rents 12–24 months out; constrained supply supports both.
Investment metrics
- 1% rule
- 0.89% ✗
- Cap rate
- 6.54%
- Cash-on-cash
- 0.89%
- DSCR
- 1.04
- GRM
- 9.3
CMA / ARV
- ARV (on-the-fly)
- $174,492
- Comps found
- 9
Show comp detail 9 sales within ~0.75 mi
| Address | Dist | Beds/Ba | Sqft | Sold | Price | $/sf | Match |
|---|---|---|---|---|---|---|---|
| 7641 Kevin Pl | 0.14mi | 3/2.0 | 1,290 (-3%) | 8mo | $190,000 | $147 | 82 |
| 2900 Kevin Ln | 0.10mi | 3/2.0 | 1,369 (+3%) | 12mo | $120,000 | $88 | 81 |
| 2811 Woodhollow Ln | 0.16mi | 3/2.0 | 1,452 (+9%) | 0mo | $169,900 | $117 | 78 |
| 2916 Kevin Ln | 0.11mi | 3/2.0 | 1,378 (+4%) | 17mo | $179,900 | $131 | 75 |
| 2919 Cushing Ct | 0.09mi | 3/2.0 | 1,489 (+12%) | 7mo | $180,000 | $121 | 71 |
| 2884 Kevin Ln | 0.09mi | 3/2.0 | 1,500 (+13%) | 6mo | $215,000 | $143 | 70 |
| 7600 Becker Ct | 0.28mi | 3/1.0 | 1,210 (-9%) | 0mo | $169,000 | $140 | 67 |
| 7595 Teton Ct | 0.25mi | 3/2.0 | 1,222 (-8%) | 16mo | $218,000 | $178 | 61 |
| 7613 Suwannee Ct | 0.44mi | 4/2.0 (+1) | 1,504 (+13%) | 13mo | $164,000 | $109 | 42 |
Match score weights: distance 35% · size 25% · config 20% · recency 20%. Top-matched comps best support the ARV.
Projected returns pro-forma
-3.0% appreciation · 2.15% rent growth · sell at horizon
- IRR
- -15.8%
- Equity multiple
- 0.44×
- Total profit
- $-31,239
- Equity at exit
- $29,806
- IRR
- -8.9%
- Equity multiple
- 0.47×
- Total profit
- $-29,821
- Equity at exit
- $17,284
Cash invested: $55,972 (down + closing). Projections, not guarantees.
Landlord ↔ Tenant lean methodology
- Overall (STATE)
- 90 Strongly Landlord-Friendly
- State Georgia
- 90 Strongly Landlord-Friendly · R+3
- County
- — inherits STATE
- City
- — inherits STATE
ZIP-level market 30236
- Rents YoY
- 2.1%
- Active inventory
- 265
- Price-to-rent
- 9.3×
Monthly cashflow live
- Estimated rent
- $1,785 high interval (Pro) →
- Mortgage (P&I)
- −$1,048
- Tax from tax record
- −$237 /mo · $2,843/yr
- Insurance
- −$83
- HOA
- −$0
- Vacancy / Maint / Mgmt
- −$375
- Net cashflow
- $42
Break-even live
Sensitivity live
| Price | -10% $155 | -5% $98 | +0% $42 | +5% $-15 | +10% $-72 |
|---|---|---|---|---|---|
| Rent | -10% $-99 | -5% $-29 | +0% $42 | +5% $112 | +10% $183 |
| Rate | -1.0pp $142 | -0.5pp $92 | base $42 | +0.5pp $-10 | +1.0pp $-63 |
UW: 25.0% down · 7.5% · 30yr · 1.5% tax · 5.0% vac · 8.0% maint · 8.0% mgmt
Financing live
Cash to close
- Down payment
- $49,975
- Closing costs
- $5,997
- Reserves months
- —
- Total cash needed
- —
Loan-product check · same deal, 3 products live
Conventional
25% down · 7.5% · 30yr
- Down + closing
- —
- Monthly P&I
- —
- Monthly cashflow
- —
- DSCR
- —
- Eligible?
- —
Personal DTI + credit; lowest rate.
DSCR
20% down · 8.5% · 30yr
- Down + closing
- —
- Monthly P&I
- —
- Monthly cashflow
- —
- DSCR
- —
- Eligible?
- —
No personal income docs; deal must DSCR.
Hard money
10% down · 12.0% · 12mo
- Down + closing
- —
- Monthly P&I
- —
- Monthly cashflow
- —
- DSCR
- —
- Eligible?
- —
Short-term bridge; refi at stabilization.
Rent comps 34 comps
| Address | Beds | Baths | Sqft | Rent | $/sqft | DOM | Units | Dist |
|---|---|---|---|---|---|---|---|---|
| 7582 Colonial Ct Jonesboro, GA | 4.0 | 2.0 | 1808 | $1,650 | $0.91 | 21d | 1 | 0.02mi |
| 7472 Lerose Dr Jonesboro, GA | 3.0 | 2.0 | 1768 | $1,931 | $1.09 | 44d | 1 | 0.41mi |
| 7538 Fielder Rd Jonesboro, GA | 3.0 | 3.0 | 1456 | $1,779 | $1.22 | 3d | 1 | 0.46mi |
| 2615 Mount Zion Pkwy Jonesboro, GA | 1.0–3.0 | 1.0–2.0 | 1049 | $1,784 | $1.70 | 3d | 10 | 0.49mi |
| 1 Hatcher Dr Stockbridge, GA | 1.0–3.0 | 1.0–2.0 | 1048 | $2,905 | $2.77 | 0d | 43 | 0.54mi |
| 100 Carrington Park Jonesboro, GA | 1.0–3.0 | 1.0–2.0 | 1008 | $1,789 | $1.77 | 2d | 15 | 0.62mi |
| 3110 Mount Zion Rd Stockbridge, GA | 2.0–3.0 | 1.0–2.0 | 1350 | $1,550 | $1.15 | 5d | 2 | 0.73mi |
| 2887 Botany Dr Jonesboro, GA | 3.0 | 2.0 | 1372 | $1,645 | $1.20 | 6d | 1 | 0.77mi |
| 3156 Mount Zion Rd Stockbridge, GA | 1.0–3.0 | 1.0–2.0 | 1149 | $1,795 | $1.56 | 2d | 15 | 0.79mi |
| 3017 Medina Dr Jonesboro, GA | 3.0 | 2.0 | 1788 | $1,820 | $1.02 | 25d | 1 | 0.89mi |
| 2447 Reeves Creek Rd Jonesboro, GA | 3.0 | 2.0 | 1458 | $1,725 | $1.18 | 44d | 1 | 0.92mi |
| 7177 Hazelwood Dr Jonesboro, GA | 3.0 | 2.0 | 1358 | $1,750 | $1.29 | 44d | 1 | 0.97mi |
| 3196 Mount Zion Rd Stockbridge, GA | 1.0–3.0 | 1.0–2.0 | 1095 | $1,885 | $1.72 | 2d | 27 | 0.97mi |
| 2822 Chelsey Trl Jonesboro, GA | 4.0 | 2.0 | 1225 | $1,725 | $1.41 | 44d | 1 | 0.99mi |
| 7302 Wagon Wheel Ct Jonesboro, GA | 3.0 | 2.5 | 1790 | $1,600 | $0.89 | 3d | 1 | 1.04mi |
| 3384 Mount Zion Rd Stockbridge, GA | 4.0 | 3.0 | 1448 | $1,950 | $1.35 | 44d | 1 | 1.06mi |
| 3461 Narrow Creek Ct Stockbridge, GA | 2.0 | 2.0 | 1672 | $1,900 | $1.14 | 44d | 1 | 1.10mi |
| 3470 Mount Zion Rd Stockbridge, GA | 1.0–3.0 | 1.0–2.0 | 973 | $1,584 | $1.63 | 22d | 23 | 1.15mi |
| 3470 Mount Zion Rd Stockbridge, GA | 1.0–3.0 | 1.0–2.0 | 973 | $2,021 | $2.08 | 18d | 10 | 1.15mi |
| 3386 Mount Zion Rd Stockbridge, GA | 1.0–3.0 | 1.0–2.0 | 905 | $1,675 | $1.85 | 2d | 65 | 1.16mi |
| 2324 Coach Way Jonesboro, GA | 4.0 | 2.5 | 1714 | $2,000 | $1.17 | 44d | 1 | 1.17mi |
| 3213 Stonemill Dr Jonesboro, GA | 3.0 | 2.0 | 1450 | $2,230 | $1.54 | 0d | 1 | 1.18mi |
| 3051 Brook Hollow Dr Rex, GA | 3.0 | 1.5 | 1070 | $1,630 | $1.52 | 44d | 1 | 1.19mi |
| 7166 Thunder Rdg Jonesboro, GA | 3.0 | 1.0 | 1500 | $675 | $0.45 | 44d | 1 | 1.28mi |
| 6898 Babbling Brook Dr Rex, GA | 3.0 | 2.5 | 1564 | $2,000 | $1.28 | 44d | 1 | 1.33mi |
| 6917 Knollwood Dr Morrow, GA | 3.0 | 2.0 | 1604 | $1,671 | $1.04 | 44d | 1 | 1.35mi |
| 6875 Fielder Ct Rex, GA | 3.0 | 2.0 | 1148 | $1,835 | $1.60 | 2d | 1 | 1.38mi |
| 2465 Richardson Pkwy Morrow, GA | 1.0–3.0 | 1.0–2.0 | 1002 | $2,209 | $2.20 | 3d | 22 | 1.39mi |
| 6855 Red Maple Dr Rex, GA | 3.0 | 2.0 | 1252 | $1,740 | $1.39 | 44d | 1 | 1.41mi |
| 6855 Red Maple Dr Rex, GA | 3.0 | 2.0 | 1252 | $1,740 | $1.39 | 25d | 1 | 1.41mi |
| 1000 Peridot Pkwy Stockbridge, GA | 1.0–3.0 | 1.0–2.0 | 1065 | $1,879 | $1.76 | 2d | 12 | 1.45mi |
| 6824 Red Maple Dr Rex, GA | 4.0 | 2.0 | 1542 | $1,951 | $1.27 | 25d | 1 | 1.46mi |
| 3431 Hollow Oak Dr Rex, GA | 3.0 | 2.0 | 1416 | $1,845 | $1.30 | 13d | 1 | 1.48mi |
| 3431 Hollow Oak Dr Rex, GA | 3.0 | 2.0 | 1416 | $1,845 | $1.30 | 44d | 1 | 1.48mi |
Listing history 10 events
-
2026-06-03statusdays on market $199,900 Under Contract 7 DOM
-
2026-06-02days on market $199,900 New 6 DOM
-
2026-06-01days on market $199,900 New 5 DOM
-
2026-05-31days on market $199,900 New 4 DOM
-
2026-05-26$199,900 New
-
2005-12-28soldstatus $125,000
-
1988-11-10soldstatus $62,900
-
1984-02-27soldstatus $52,100
-
1984-02-27soldstatus $52,100
-
1980-06-27soldstatus $46,500
ⓘ Source: listings_history table (triggers on properties + properties_extension) + one-shot
backfill from property_details.listing_events for pre-trigger history.
Tax reassessment forecast GA · Resets to sale price
- Current annual tax
- $2,843 · $237/mo
- Projected year-2 tax
- $2,843 · $237/mo
- Expected delta
- $0/yr ($0/mo · 0.0%)
ⓘ Screening estimate from a state-policy table — verify with the county assessor before closing.
Climate risk First Street
- Flood 1/10 Low FEMA zone X (unshaded) · 0% chance over 30 yrs
- Wildfire 1/10 Low
- Heat 6/10 Major 7 d/yr ≥106°F today · 18 d/yr by 30 yrs out
- Wind 5/10 Major 26% chance of damaging wind over 30 yrs
- Air quality 4/10 Moderate 5 unhealthy d/yr today · 6 by 30 yrs out
Nearby sold comps map
Loading sold comps map…
Walkable amenities ~0.75 mi
Loading nearby amenities…
Taxation est. · year 1
- Rental income
- $21,419
- − Mortgage interest
- −$11,198
- − Property taxes
- −$2,843
- − Insurance
- −$1,000
- − Repairs & maintenance
- −$1,714
- − Management
- −$1,714
- − Depreciation
- −$5,815
- Taxable loss
- −$2,863
- Est. tax savings @ 24.0%
- +$687
- After-tax cash flow
- $1,186/yr
For passive investors: Depreciation is non-cash, so a rental often shows a tax loss while cash-flowing — sheltering income. Rental losses are passive: they offset passive income freely, and up to $25,000/yr can offset ordinary (W-2) income if you actively participate and your MAGI is under $100k (phasing out to $0 by $150k); unused losses carry forward. On sale, claimed depreciation is recaptured at up to 25%, and gains may owe capital-gains tax (a 1031 exchange can defer both). Figures are a year-1 estimate at your 24.0% rate — not tax advice; consult a CPA.
Schools (NCES district)
- District
- Clayton County
- NCES district ID
- 1301230
- Math proficiency
- 11% ▼ -13.00%
- Reading proficiency
- 20% ▼ -9.00%
- Median HH income
- $42,266
- Composite
- 13.41/100
- National rank
- #9527
- State rank
- #155 of 174 in GA
Livability — Stockbridge
- Score
- 60/100
- State rank
- #389
- US rank
- #19479
Category grades
Schools grade is shown separately in the Schools card above.
Census & demographics
- County
- Clayton County · 230,153 people
- City population
- 93,280
- Metro
- Atlanta-Sandy Springs-Alpharetta, GA
- Population (ZIP)
- 50,089
- Household income
- $66,973
- Rent vs Own
- Severe rent burden
- 2024.0
Population outlook (Clayton County) Hauer SSP2
- Today (2025)
- 310,777 people
- By 2030
- 329,762 · +6.1%
- By 2040
- 368,052 · +18.4%
- By 2050
- 401,196 · +29.1%
- By 2075
- 472,488 · +52.0%
- By 2100
- 500,446 · +61.0%
Race, ethnicity, and origin ACS 2023
- Neighborhood character
- Diverse neighborhood (Simpson 0.56)
- Race & ethnicity
- Black 64% White 14% Hispanic / Latino 11% Two or more races 8% Asian 5%
- Hispanic origin (detail)
- Mexican 6% Puerto Rican 1%
- Common ancestry
- Slovak 1% Italian 1% Hispanic 1%
- Foreign-born
- 13% · Canada, Vietnam, China
- Languages at home
- 81% English-only · Spanish 10% Vietnamese 3% French/Haitian/Cajun 2%
Political lean MEDSL · Clayton
- 2024 margin
- Solid D (+69.2) · D 84.3% · R 15.1%
- 2008→2024 swing
- +2.8pp toward D · 2008: 66.4pp · 2024: 69.2pp
- All cycles
- 2024: D+69.2 2020: D+70.9 2016: D+71.9 2012: D+70.1 2008: D+66.4
Not yet ingested
- Civics
- —
Market trends
- HPI YoY
- ▼ -137.02%
- Current HPI
- 204.1778
- Rent YoY
- ▲ 2.15%
- Metro
- Atlanta-Sandy Springs-Alpharetta, GA
- State GDP YoY
- ▲ 2.66%
- F500 in state
- 28
Industry mix (Fortune 500 HQ in GA)
| Industry | F500 HQs | Revenue |
|---|---|---|
| Paper / Packaging | 2 | $29B |
|
||
| Retail | 1 | $160B |
|
||
| Transportation / Logistics | 1 | $91B |
|
||
| Airlines | 1 | $62B |
|
||
| Consumer Goods | 1 | $47B |
|
||
| Utilities | 1 | $25B |
|
||
Price history
+329.9% since first listed6 events — show timeline
- 2026-05-26 Listed $199,900 GAMLS
- 2005-12-28 Sold (Public Records) $125,000 Public Records
- 1988-11-10 Sold (Public Records) $62,900 Public Records
- 1984-02-27 Sold (Public Records) $52,100 Public Records
- 1984-02-27 Sold (Public Records) $52,100 Public Records
- 1980-06-27 Sold (Public Records) $46,500 Public Records
Property tax history
+4.5%/yrLatest (2025): $2,843 · +1.9% YoY. Source: county tax records.
Cash-flow waterfall
monthlySold comps — $/sqft
last 12 mo · ≤1 miLoading sold comps…