6130 CAMINO REAL #312 Plan · Jurupa Valley, CA
Flood risk 1/10 · Minimal
- FEMA flood zone
- X (unshaded)
- Chance of flooding over 30 yrs
- 0.0%
- Est. flood insurance / yr
- $507 – $1,088
Fire risk 4/10 · Minor
- Est. fire insurance / yr
- $659 – $1,223
Heat risk 8/10 · Major
- Hot days now (above 103°F)
- 7 days/yr
- Hot days in 30 yrs
- 20 days/yr
Wind risk 1/10 · Minimal
- Chance of severe wind over 30 yrs
- —
Air-quality risk 10/10 · Severe
- Unhealthy air days now
- 27 days/yr
- Unhealthy air days in 30 yrs
- 32 days/yr
Risk factors via First Street. Map © Google.
Why this score? — see what drove the C+ grade
The composite is a weighted blend of 9 inputs, each scored 0–100. Each bar is that input's sub-score; the figure is the points it added to the 100-point composite (weight × sub-score).
- Cash flow +25.5/30.0
- DSCR +8.5/10.0
- ARV discount +7.5/15.0
- 1% rule +6.7/10.0
- Condition / age +4.0/5.0
- Schools +3.1/10.0
- Rent growth +2.8/5.0
- Livability +2.5/5.0
- Appreciation +0.0/10.0
$234,995
🖨 Deal sheet 📄 Offer letter ✓ Due diligence
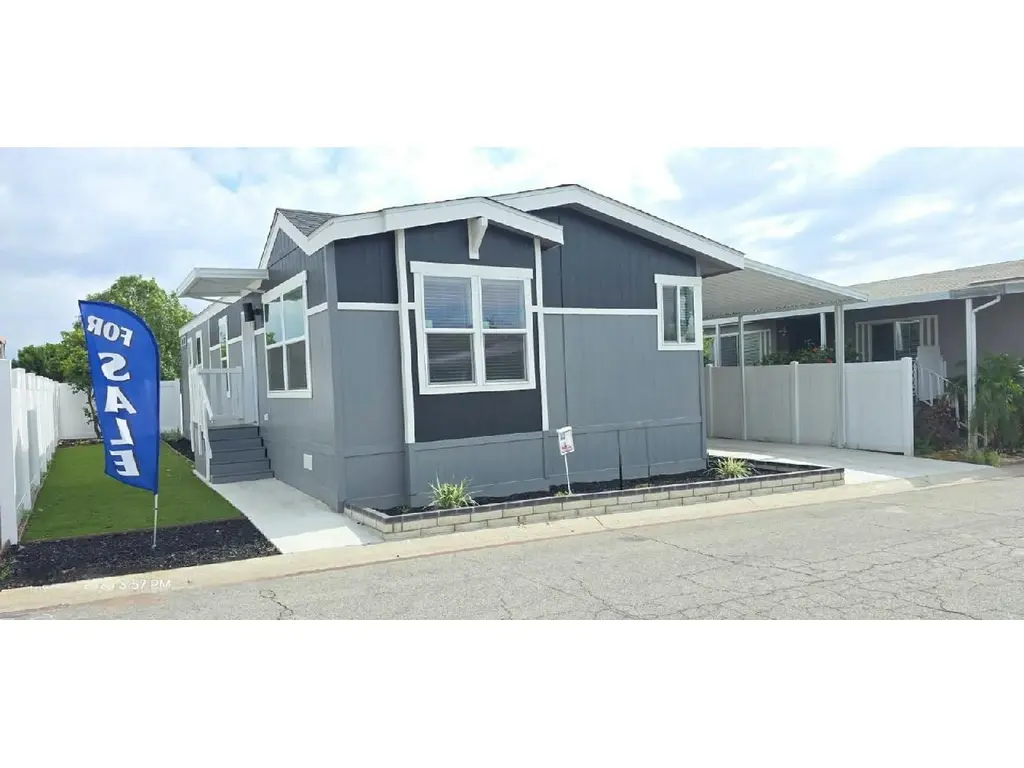
Listing remarks
PRICE DROP! Next Open House - June 14th 1230pm -3pm, 21st, & 27th from 1230-5pm. Meet at the homesite. Financing Help. Brand New home has an open plan with Grey cabinets, kitchen island, & a 4-ton AC!, a 1-year manufactured warranty PLUS a 6-year limited warranty! Stainless Appliances plus a side yard with artificial grass, a new driveway, new carport, & vinyl plank floors throughout the home! Be the 1st to move into this beauty! The vinyl fencing in this yard makes it a perfect area for a gathering or just some needed relax time. Call to see this one before its gone! Serial #235000HA002586A/B
Key facts
- Soho grey cabinets
- Stainless appliances
- Kitchen island
Tags
Property features AI
Finance
- Financial info: List price $234,995
Exterior
- Home design: Condo/Plan unit at 6130 Camino Real #312, Jurupa Valley, CA; Single-level (plan)
Interior
- Bedrooms: 3 bedrooms
- Bathrooms: 2 full bathrooms
- Interior features: Living area of 1180; Active new construction plan
Neighborhood map
What this means for you Summary
Snapshot
- This is a 3-bed/2.0-bath manufactured listed at $235k. Condition is rated good.
Deal economics
- At list price, monthly cash flow is $552 ($7k/yr) — positive.
- The deal already cash-flows at list — no discount required.
- Meets the 1% rule at list price ($3k rent vs $235k).
- Recommended offer: $231k (1.5% below list) — sets the bar for market timing.
- Cap rate 9.1% vs local median 2.9% in Jurupa Valley — top-decile yield for the area; either an underpriced asset or a hidden risk that comps aren't pricing in. Stress-test before assuming the spread holds.
Location & tenants
- Location reads 49/100 on livability (#1,170 in CA) — a working-class tenant base; expect higher turnover. Strengths: housing A+, employment A-; Watch: schools F, amenities F, commute F.
- Jurupa Unified (suburban): math 25% / reading 38% proficiency, ranked #953 of 1,400 in CA (top 68%) — families likely to look elsewhere, expect single-tenant / working-renter base with shorter leases; 64% free/reduced lunch — lower-income household profile, screen leases tightly.
- Market conditions: Rents rising (+1.3%/yr); 202 active listings in the ZIP; 1 comparable units currently listed for rent nearby; solid renter incomes; 9,195 units permitted in Riverside County in 2024 (1,512 in 5+ unit buildings).
- This rent runs 35% of the median local income ($95k/yr) — at the standard rent-burdened threshold; future hikes will face affordability resistance.
Forward outlook
- Local home prices are declining (-3.0%/yr); year-one equity from $2k of loan paydown is wiped out by about $7k of value loss. Plan a longer hold.
- Riverside County population projected at +22% by 2050 — long-run rental-demand tailwind backs the buy-and-hold thesis.
Negotiation context
- It's been on market 21 days — a 2% lower offer ($231k) is reasonable based on typical stale-listing flexibility.
Risks & watch-outs
- Climate carrying-cost: extreme-heat days projected 7→20/yr by 2055 (HVAC capex compounding) — expect insurance premiums to compound above CPI over the hold.
Questions for the listing agent
- Is there a deadline driving the sale (1031 exchange, divorce, estate, relocation)? That informs how much negotiation room exists.
- Schools are F-rated, which usually means shorter tenancies and higher turnover. Who's the typical renter profile here, and what's been the actual vacancy rate?
- What's the average days-on-market for RENTAL listings here right now (not sales)? A rising rental-DOM trend means longer vacancies and softer asking-rent achievability than the comps imply.
- What's the recent tenant-quality profile in this submarket — average credit score on applications, eviction rate, late-payment / NSF rate, and stable-employment percentage? A property-management company in the area should have these aggregated.
- How much new for-sale + rental construction is in the pipeline within 1–3 miles? Heavy new supply typically softens prices + rents 12–24 months out; constrained supply supports both.
Investment metrics
- 1% rule
- 1.17% ✓
- Cap rate
- 9.11%
- Cash-on-cash
- 10.06%
- DSCR
- 1.45
- GRM
- 7.1
CMA / ARV
- ARV (on-the-fly)
- $145,140
- Comps found
- 12
Show comp detail 12 sales within ~0.75 mi
| Address | Dist | Beds/Ba | Sqft | Sold | Price | $/sf | Match |
|---|---|---|---|---|---|---|---|
| 6130 Camino Real #238 | 0.09mi | 3/2.0 | 1,196 (+1%) | 2mo | $190,000 | $159 | 92 |
| 6130 Camino Real #47 | 0.15mi | 3/2.0 | 1,176 (-0%) | 11mo | $145,000 | $123 | 84 |
| 6130 Camino Real #130 | 0.01mi | 3/2.0 | 1,248 (+6%) | 9mo | $135,000 | $108 | 83 |
| 6130 Camino Real #97 | 0.01mi | 2/2.0 (-1) | 1,152 (-2%) | 11mo | $120,000 | $104 | 82 |
| 6130 Camino Real #251 | 0.01mi | 3/2.0 | 1,296 (+10%) | 5mo | $132,000 | $102 | 79 |
| 6130 Camino Real #126 | 0.01mi | 3/2.0 | 1,040 (-12%) | 2mo | $155,000 | $149 | 78 |
| 6130 Camino Real #95 | 0.01mi | 4/2.0 (+1) | 1,320 (+12%) | 3mo | $166,800 | $126 | 72 |
| 6130 Camino Real #230 | 0.17mi | 3/2.0 | 1,250 (+6%) | 14mo | $170,000 | $136 | 70 |
| 6130 Camino Real #112 | 0.13mi | 2/2.0 (-1) | 1,040 (-12%) | 1mo | $149,000 | $143 | 69 |
| 6130 Camino Real #244 | 0.01mi | 2/2.0 (-1) | 1,344 (+14%) | 13mo | $120,000 | $89 | 60 |
| 6130 Camino Real #253 | 0.08mi | 3/2.0 | 1,344 (+14%) | 15mo | $165,000 | $123 | 60 |
| 6130 Camino Real #181 | 0.09mi | 3/2.0 | 1,344 (+14%) | 15mo | $155,000 | $115 | 60 |
Match score weights: distance 35% · size 25% · config 20% · recency 20%. Top-matched comps best support the ARV.
Projected returns pro-forma
-3.0% appreciation · 1.31% rent growth · sell at horizon
- IRR
- -3.1%
- Equity multiple
- 0.89×
- Total profit
- $-7,509
- Equity at exit
- $35,039
- IRR
- 4.6%
- Equity multiple
- 1.31×
- Total profit
- $20,603
- Equity at exit
- $20,318
Cash invested: $65,799 (down + closing). Projections, not guarantees.
Landlord ↔ Tenant lean methodology
- Overall (STATE)
- 18 Strongly Tenant-Friendly
- State California
- 18 Strongly Tenant-Friendly · D+13
- County
- — inherits STATE
- City
- — inherits STATE
ZIP-level market 92509
- Rents YoY
- 1.3%
- Active inventory
- 202
- Price-to-rent
- 7.1×
Monthly cashflow live
- Estimated rent
- $2,754 medium interval (Pro) →
- Mortgage (P&I)
- −$1,232
- Tax est. 1.5%
- −$294 /mo · $3,525/yr
- Insurance
- −$98
- HOA
- −$0
- Vacancy / Maint / Mgmt
- −$578
- Net cashflow
- $552
Break-even live
UW: 25.0% down · 7.5% · 30yr · 1.5% tax · 5.0% vac · 8.0% maint · 8.0% mgmt
Financing live
Cash to close
- Down payment
- $58,749
- Closing costs
- $7,050
- Reserves months
- —
- Total cash needed
- —
Loan-product check · same deal, 3 products live
Conventional
25% down · 7.5% · 30yr
- Down + closing
- —
- Monthly P&I
- —
- Monthly cashflow
- —
- DSCR
- —
- Eligible?
- —
Personal DTI + credit; lowest rate.
DSCR
20% down · 8.5% · 30yr
- Down + closing
- —
- Monthly P&I
- —
- Monthly cashflow
- —
- DSCR
- —
- Eligible?
- —
No personal income docs; deal must DSCR.
Hard money
10% down · 12.0% · 12mo
- Down + closing
- —
- Monthly P&I
- —
- Monthly cashflow
- —
- DSCR
- —
- Eligible?
- —
Short-term bridge; refi at stabilization.
Rent comps 1 comps
| Address | Beds | Baths | Sqft | Rent | $/sqft | DOM | Units | Dist |
|---|---|---|---|---|---|---|---|---|
| 6322 Brian Cir Jurupa Valley, CA | 3.0 | 2.0 | 1177 | $2,800 | $2.38 | 43d | 1 | 0.46mi |
Listing history 15 events
-
2026-06-18days on market $234,995 Active 21 DOM
-
2026-06-17days on market $234,995 Active 20 DOM
-
2026-06-16days on market $234,995 Active 19 DOM
-
2026-06-15days on market $234,995 Active 18 DOM
-
2026-06-13days on market $234,995 Active 16 DOM
-
2026-06-13days on market $234,995 Active 15 DOM
-
2026-06-09days on market $234,995 Active 12 DOM
-
2026-06-08days on market $234,995 Active 11 DOM
-
2026-06-07days on market $234,995 Active 10 DOM
-
2026-06-04days on market $234,995 Active 7 DOM
-
2026-06-03days on market $234,995 Active 6 DOM
-
2026-06-02days on market $234,995 Active 5 DOM
-
2026-06-01days on market $234,995 Active 4 DOM
-
2026-05-31remarks 603-char remark
-
2026-05-31days on market $234,995 Active 3 DOM
ⓘ Source: listings_history table (triggers on properties + properties_extension) + one-shot
backfill from property_details.listing_events for pre-trigger history.
Climate risk First Street
- Flood 1/10 Low FEMA zone X (unshaded) · 0% chance over 30 yrs
- Wildfire 4/10 Moderate
- Heat 8/10 Severe 7 d/yr ≥103°F today · 20 d/yr by 30 yrs out
- Wind 1/10 Low
- Air quality 10/10 Extreme 27 unhealthy d/yr today · 32 by 30 yrs out
Nearby sold comps map
Loading sold comps map…
Walkable amenities ~0.75 mi
Loading nearby amenities…
Taxation est. · year 1
- Rental income
- $33,048
- − Mortgage interest
- −$13,163
- − Property taxes
- −$3,525
- − Insurance
- −$1,175
- − Repairs & maintenance
- −$2,644
- − Management
- −$2,644
- − Depreciation
- −$6,836
- Taxable income
- $3,061
- Est. tax owed @ 24.0%
- −$735
- After-tax cash flow
- $5,885/yr
For passive investors: Depreciation is non-cash, so a rental often shows a tax loss while cash-flowing — sheltering income. Rental losses are passive: they offset passive income freely, and up to $25,000/yr can offset ordinary (W-2) income if you actively participate and your MAGI is under $100k (phasing out to $0 by $150k); unused losses carry forward. On sale, claimed depreciation is recaptured at up to 25%, and gains may owe capital-gains tax (a 1031 exchange can defer both). Figures are a year-1 estimate at your 24.0% rate — not tax advice; consult a CPA.
Condition & rehab AI · 6 photos
This home is in excellent condition with modern finishes and a well-maintained exterior. It is move-in ready and has the potential for further value increases through landscaping and exterior painting.
Value-add opportunities
- Both Landscaping improvements — Enhances curb appeal and adds value for both resale and rental.
- Both Painting exterior walls — Fresh paint can improve the home's appearance and value.
- Both Landscaping and irrigation system — A well-maintained yard and irrigation system can increase curb appeal and attract potential buyers/tenants.
Renovation cost estimate screening
Value-add ROI direction
- Both Landscaping improvements — Enhances curb appeal and adds value for both resale and rental. ↑
- Both Painting exterior walls — Fresh paint can improve the home's appearance and value. ↑
- Both Landscaping and irrigation system — A well-maintained yard and irrigation system can increase curb appeal and attract potential buyers/tenants. ↑
ⓘ Cost ranges are severity-bucket heuristics (US national rule-of-thumb). Get contractor quotes + a written scope before underwriting a rehab budget.
Schools (NCES district)
- District
- Jurupa Unified
- NCES district ID
- 0619260
- Math proficiency
- 25% ▲ 2.00%
- Reading proficiency
- 38% ▲ 2.00%
- Median HH income
- $58,100
- Composite
- 30.97/100
- National rank
- #11327
- State rank
- #953 of 1400 in CA
Livability — Jurupa Valley
- Score
- 49/100
- State rank
- #1170
- US rank
- #25915
Category grades
Schools grade is shown separately in the Schools card above.
Census & demographics
- Census place
- Jurupa Valley, CA
- County
- Riverside County · 2,287,001 people
- City population
- 119,165
- Metro
- Riverside-San Bernardino-Ontario, CA
- Population (ZIP)
- 81,182
- Household income
- $95,355
- Rent vs Own
- Severe rent burden
- 1694.0
Population outlook (Riverside County) Hauer SSP2
- Today (2025)
- 2,664,475 people
- By 2030
- 2,802,692 · +5.2%
- By 2040
- 3,050,904 · +14.5%
- By 2050
- 3,256,783 · +22.2%
- By 2075
- 3,655,058 · +37.2%
- By 2100
- 3,766,594 · +41.4%
Race, ethnicity, and origin ACS 2023
- Neighborhood character
- Predominantly Hispanic (74%)
- Race & ethnicity
- Hispanic / Latino 74% White 17% Two or more races 16% Black 4% Asian 4% Native American 1%
- Hispanic origin (detail)
- Mexican 67%
- Common ancestry
- Lithuanian 1%
- Foreign-born
- 28% · Canada, China, Vietnam
- Languages at home
- 42% English-only · Spanish 54% Other Indo-European 1% Tagalog/Filipino 1%
Political lean MEDSL · Riverside
- 2024 margin
- Toss-up / Even · D 48.0% · R 49.3% · Other 2.6%
- 2008→2024 swing
- -3.6pp toward R · 2008: 2.3pp · 2024: -1.3pp
- All cycles
- 2024: R+1.3 2020: D+8.0 2016: D+4.3 2012: R+0.4 2008: D+2.3
Not yet ingested
- Civics
- —
Market trends
- HPI YoY
- ▼ -374.91%
- Current HPI
- 464.8939
- Rent YoY
- ▲ 1.31%
- Metro
- Riverside-San Bernardino-Ontario, CA
- State GDP YoY
- ▲ 3.21%
- F500 in state
- 116
Industry mix (Fortune 500 HQ in CA)
| Industry | F500 HQs | Revenue |
|---|---|---|
| Technology | 27 | $1,492B |
|
||
| Financial Services | 3 | $174B |
|
||
| Retail | 3 | $44B |
|
||
| Insurance | 3 | $26B |
|
||
| Media / Entertainment | 2 | $115B |
|
||
| Pharmaceuticals / Biotech | 2 | $62B |
|
||
Cash-flow waterfall
monthlySold comps — $/sqft
last 12 mo · ≤1 miLoading sold comps…