39 N Main St · Sharon, CT
Flood risk 1/10 · Minimal
- FEMA flood zone
- X
- Chance of flooding over 30 yrs
- 0.0%
- Est. flood insurance / yr
- $473 – $860
Fire risk 3/10 · Minor
- Est. fire insurance / yr
- $829 – $1,539
Heat risk 3/10 · Minor
- Hot days now (above 92°F)
- 7 days/yr
- Hot days in 30 yrs
- 16 days/yr
Wind risk 4/10 · Minor
- Chance of severe wind over 30 yrs
- 14.0%
Air-quality risk 3/10 · Minor
- Unhealthy air days now
- 2 days/yr
- Unhealthy air days in 30 yrs
- 3 days/yr
Risk factors via First Street. Map © Google.
Why this score? — see what drove the D+ grade
The composite is a weighted blend of 9 inputs, each scored 0–100. Each bar is that input's sub-score; the figure is the points it added to the 100-point composite (weight × sub-score).
- Cash flow +20.5/30.0
- DSCR +6.5/10.0
- Schools +5.1/10.0
- 1% rule +4.2/10.0
- Appreciation +3.9/10.0
- Livability +3.0/5.0
- Rent growth +2.5/5.0
- Condition / age +2.5/5.0
- ARV discount +0.0/15.0
$599,000
🖨 Deal sheet 📄 Offer letter ✓ Due diligence
Listing remarks
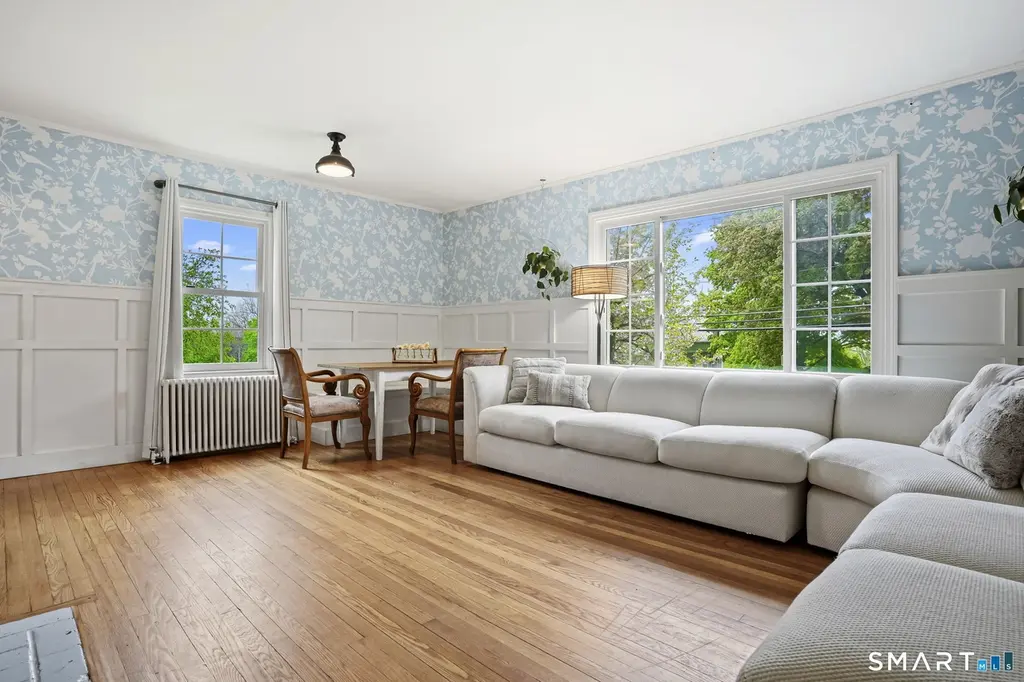
Step into effortless New England living with this beautifully maintained 4-bedroom, 2-full bath Cape, perfectly positioned on Sharon's iconic Main Street. Combining classic architectural charm with modern upgrades, this home offers the ideal blend of convenience and comfort. The recently renovated basement is a true standout, featuring a dedicated private office for your "work-from-home" needs and a spacious rec room perfect for movie nights or a home gym. Every inch feels fresh thanks to a newly painted exterior, and a newly updated second full bathroom featuring contemporary fixtures and finishes. Located close by to Sharon's vibrant town shopping center, charming local cafes, a
Key facts
- 0.29 acre lot
- 4 parking spots
- Built 1950
Property features AI
Finance
- Other: Living area listed as 1,479; Assessed value available
Exterior
- Parking: Driveway; Four parking spaces
- Utilities: Public water connected; Public sewer connected; Oil tank located in basement
- Home design: Single-family home
- Construction: Frame construction; Block foundation
- Exterior features: Sloping lot; Vinyl siding; Asphalt shingle roof
Interior
- Kitchen: Gas range; Refrigerator; Dishwasher
- Bedrooms: Four bedrooms
- Bathrooms: Two full bathrooms
- Heating & cooling: Hot water heating (oil-fired); Wall unit cooling
- Interior features: Six total rooms; One fireplace; Full, partially finished basement; Walk-up attic
- Laundry & utility: Washer and dryer in basement; 40-gallon hot water tank
Neighborhood map
What this means for you Summary
Snapshot
- This is a 4-bed/2.0-bath single-family listed at $599k.
Deal economics
- At list price, monthly cash flow is $787 ($9k/yr) — positive.
- The deal already cash-flows at list — no discount required.
- To meet the 1% rule (rent ≥ 1% of price), the offer needs to be $550k (8.3% below list).
- Recommended offer: $550k (8.3% below list) — sets the bar for 1% rule.
Location & tenants
- Location reads 59/100 on livability (#141 in CT) — a working-class tenant base; expect higher turnover. Strengths: employment A+, crime A, cost of living B+; Watch: amenities F, commute D-, housing F.
- Sharon School District (rural): math 50% / reading 60% proficiency, ranked #110 of 192 in CT (top 57%) — acceptable for families but not a draw, mixed tenant base, ~2y average lease; only 18% free/reduced lunch — higher-income household profile.
- Zoned schools: Sharon Center School (math 37% / reading 62%, grade D, #237 of 553 statewide, top 45%, 97 students, 41% FRL) — zoned schools average 41% FRL vs 18% district-wide (23 pts higher); higher-poverty schools than district average — tighter screening recommended.
- Market conditions: 36 active listings in the ZIP; 154 units permitted in Northwest Hills Planning Region in 2024 (6 in 5+ unit buildings).
Forward outlook
- Local home prices are declining (-2.2%/yr); year-one equity from $4k of loan paydown is wiped out by about $13k of value loss. Plan a longer hold.
Negotiation context
- It's been on market 43 days — a 3% lower offer ($581k) is reasonable based on typical stale-listing flexibility.
- 2 sale attempts since 25y ago with the ask held roughly flat each time — persistent listings suggest the price (not the market) is what's stuck; bring a comps-based counter.
- Current owner paid $186k; list at $599k implies a 222% gain — meaningful room to come down on a strong offer.
Risks & watch-outs
- Watch-outs: built in 1950 — expect roof / HVAC / electrical / plumbing capex.
Questions for the listing agent
- It's been on market 43 days. Have you received any prior offers? Is the seller open to a 8% concession, seller financing, or rate buy-down credit?
- Built in 1950 — when were the roof, HVAC, electrical panel, plumbing, and water heater last replaced?
- Is there a deadline driving the sale (1031 exchange, divorce, estate, relocation)? That informs how much negotiation room exists.
- Schools are B-rated — typically a magnet for longer-tenancy family renters. What's the average tenant stay here, and is there a school-zone premium baked into asking?
- The area grade is low — what's the realistic commute time and amenity access for the typical tenant pool here? Any planned neighborhood developments (good or bad) we should know about?
- What's the average days-on-market for RENTAL listings here right now (not sales)? A rising rental-DOM trend means longer vacancies and softer asking-rent achievability than the comps imply.
- What's the recent tenant-quality profile in this submarket — average credit score on applications, eviction rate, late-payment / NSF rate, and stable-employment percentage? A property-management company in the area should have these aggregated.
- How much new for-sale + rental construction is in the pipeline within 1–3 miles? Heavy new supply typically softens prices + rents 12–24 months out; constrained supply supports both.
Investment metrics
- 1% rule
- 0.92% ✗
- Cap rate
- 7.87%
- Cash-on-cash
- 5.63%
- DSCR
- 1.25
- GRM
- 9.1
CMA / ARV
- ARV (on-the-fly)
- $437,784
- Comps found
- 3
Show comp detail 3 sales within ~0.75 mi
| Address | Dist | Beds/Ba | Sqft | Sold | Price | $/sf | Match |
|---|---|---|---|---|---|---|---|
| 16 Upper Main St | 0.29mi | 3/1.5 (-1) | 1,604 (+8%) | 3mo | $525,000 | $327 | 63 |
| 79 Gay St | 0.64mi | 4/2.0 | 1,266 (-14%) | 10mo | $245,000 | $194 | 38 |
| 30 Cedar Rd | 0.70mi | 3/1.0 (-1) | 1,423 (-4%) | 23mo | $421,000 | $296 | 33 |
Match score weights: distance 35% · size 25% · config 20% · recency 20%. Top-matched comps best support the ARV.
Projected returns pro-forma
-2.17% appreciation · 3.0% rent growth · sell at horizon
- IRR
- -3.9%
- Equity multiple
- 0.84×
- Total profit
- $-26,290
- Equity at exit
- $111,587
- IRR
- 4.3%
- Equity multiple
- 1.35×
- Total profit
- $59,019
- Equity at exit
- $90,874
Cash invested: $167,720 (down + closing). Projections, not guarantees.
Landlord ↔ Tenant lean methodology
- Overall (STATE)
- 27 Tenant-Leaning
- State Connecticut
- 27 Tenant-Leaning · D+7
- County
- — inherits STATE
- City
- — inherits STATE
ZIP-level market 06069
- Home prices YoY
- -0.7%
- Active inventory
- 36
- Price-to-rent
- 9.1×
Monthly cashflow live
- Estimated rent
- $5,496 medium interval (Pro) →
- Mortgage (P&I)
- −$3,141
- Tax from tax record
- −$164 /mo · $1,966/yr
- Insurance
- −$250
- HOA
- −$0
- Vacancy / Maint / Mgmt
- −$1,154
- Net cashflow
- $787
Break-even live
UW: 25.0% down · 7.5% · 30yr · 1.5% tax · 5.0% vac · 8.0% maint · 8.0% mgmt
Financing live
Cash to close
- Down payment
- $149,750
- Closing costs
- $17,970
- Reserves months
- —
- Total cash needed
- —
Loan-product check · same deal, 3 products live
Conventional
25% down · 7.5% · 30yr
- Down + closing
- —
- Monthly P&I
- —
- Monthly cashflow
- —
- DSCR
- —
- Eligible?
- —
Personal DTI + credit; lowest rate.
DSCR
20% down · 8.5% · 30yr
- Down + closing
- —
- Monthly P&I
- —
- Monthly cashflow
- —
- DSCR
- —
- Eligible?
- —
No personal income docs; deal must DSCR.
Hard money
10% down · 12.0% · 12mo
- Down + closing
- —
- Monthly P&I
- —
- Monthly cashflow
- —
- DSCR
- —
- Eligible?
- —
Short-term bridge; refi at stabilization.
Listing history 25 events
-
2026-06-19days on market $599,000 Active 43 DOM
-
2026-06-18days on market $599,000 Active 42 DOM
-
2026-06-17days on market $599,000 Active 41 DOM
-
2026-06-16days on market $599,000 Active 40 DOM
-
2026-06-15days on market $599,000 Active 39 DOM
-
2026-06-13days on market $599,000 Active 37 DOM
-
2026-06-12days on market $599,000 Active 36 DOM
-
2026-06-10days on market $599,000 Active 34 DOM
-
2026-06-09days on market $599,000 Active 33 DOM
-
2026-06-08days on market $599,000 Active 32 DOM
-
2026-06-07days on market $599,000 Active 31 DOM
-
2026-06-05days on market $599,000 Active 29 DOM
-
2026-06-05days on market $599,000 Active 28 DOM
-
2026-06-03days on market $599,000 Active 27 DOM
-
2026-06-02days on market $599,000 Active 26 DOM
-
2026-06-01days on market $599,000 Active 25 DOM
-
2026-05-31days on market $599,000 Active 24 DOM
-
2026-05-30days on market $599,000 Active 23 DOM
-
2026-05-17price $599,000
-
2026-05-08$609,000 Active
-
2026-05-07historical $609,000
-
2018-03-27soldstatus $186,000
-
2003-07-01soldstatus $180,000
-
2002-03-22historical
-
2001-05-03$169,000
ⓘ Source: listings_history table (triggers on properties + properties_extension) + one-shot
backfill from property_details.listing_events for pre-trigger history.
Tax reassessment forecast CT · Partial reset (capped growth)
- Current annual tax
- $1,966 · $164/mo
- Projected year-2 tax
- $7,392 · $616/mo
- Expected delta
- +$5,426/yr (+$452/mo · 276.0%)
ⓘ Screening estimate from a state-policy table — verify with the county assessor before closing.
Climate risk First Street
- Flood 1/10 Low FEMA zone X · 0% chance over 30 yrs
- Wildfire 3/10 Moderate
- Heat 3/10 Moderate 7 d/yr ≥92°F today · 16 d/yr by 30 yrs out
- Wind 4/10 Moderate 14% chance of damaging wind over 30 yrs
- Air quality 3/10 Moderate 2 unhealthy d/yr today · 3 by 30 yrs out
Nearby sold comps map
Loading sold comps map…
Walkable amenities ~0.75 mi
Loading nearby amenities…
Taxation est. · year 1
- Rental income
- $65,946
- − Mortgage interest
- −$33,553
- − Property taxes
- −$1,966
- − Insurance
- −$2,995
- − Repairs & maintenance
- −$5,276
- − Management
- −$5,276
- − Depreciation
- −$17,425
- Taxable loss
- −$545
- Est. tax savings @ 24.0%
- +$131
- After-tax cash flow
- $9,573/yr
For passive investors: Depreciation is non-cash, so a rental often shows a tax loss while cash-flowing — sheltering income. Rental losses are passive: they offset passive income freely, and up to $25,000/yr can offset ordinary (W-2) income if you actively participate and your MAGI is under $100k (phasing out to $0 by $150k); unused losses carry forward. On sale, claimed depreciation is recaptured at up to 25%, and gains may owe capital-gains tax (a 1031 exchange can defer both). Figures are a year-1 estimate at your 24.0% rate — not tax advice; consult a CPA.
Schools (NCES district)
- District
- Sharon School District
- NCES district ID
- 0904020
- Math proficiency
- 50% ▲ 10.00%
- Reading proficiency
- 60% ▲ 15.00%
- Median HH income
- $72,415
- Composite
- 50.86/100
- National rank
- #3869
- State rank
- #110 of 192 in CT
Livability — Sharon
- Score
- 59/100
- State rank
- #141
- US rank
- #20344
Category grades
Schools grade is shown separately in the Schools card above.
Census & demographics
- Census place
- Sharon, CT
- Population (ZIP)
- 2,562
Population outlook (Northwest Hills County) Hauer SSP2
- By 2040
- 118,998
Race, ethnicity, and origin ACS 2023
- Neighborhood character
- Predominantly White (80%)
- Race & ethnicity
- White 80% Asian 5% Two or more races 4% Hispanic / Latino 1%
- Common ancestry
- Italian 5% Russian 4% Slovak 3%
- Foreign-born
- 18% · Canada, South Korea
- Languages at home
- 83% English-only · Other Indo-European 9% French/Haitian/Cajun 3% Korean 2%
Political lean MEDSL · Northwest Hills
- 2024 margin
- Toss-up / Even · D 48.6% · R 49.9% · Other 1.6%
- All cycles
- 2024: R+1.3
Not yet ingested
- Civics
- —
Market trends
- HPI YoY
- ▼ -2.17%
- Current HPI
- 321.8949
- Rent YoY
- —
- Metro
- —
- State GDP YoY
- ▲ 1.06%
- F500 in state
- 38
Industry mix (Fortune 500 HQ in CT)
| Industry | F500 HQs | Revenue |
|---|---|---|
| Industrial Machinery | 4 | $38B |
|
||
| Insurance | 3 | $71B |
|
||
| Financial Services | 2 | $25B |
|
||
| Transportation / Logistics | 2 | $18B |
|
||
| Healthcare | 1 | $247B |
|
||
| Telecommunications | 1 | $55B |
|
||
Price history
+254.4% since first listed7 events — show timeline
- 2026-05-17 Price Changed $599,000 Smart MLS
- 2026-05-08 Listed $609,000 Smart MLS
- 2026-05-07 Coming Soon $609,000 Smart MLS
- 2018-03-27 Sold (Public Records) $186,000 Public Records
- 2003-07-01 Sold (Public Records) $180,000 Public Records
- 2002-03-22 Listing Removed — Smart MLS
- 2001-05-03 Listed $169,000 Smart MLS
Property tax history
+1.3%/yrLatest (2023): $1,966 · +0.0% YoY. Source: county tax records.
Cash-flow waterfall
monthlySold comps — $/sqft
last 12 mo · ≤1 miLoading sold comps…