6600 S 300 E · Hamilton, IN
Flood risk 1/10 · Minimal
- FEMA flood zone
- X (unshaded)
- Chance of flooding over 30 yrs
- 0.0%
- Est. flood insurance / yr
- $507 – $1,088
Fire risk 1/10 · Minimal
- Est. fire insurance / yr
- $717 – $1,331
Heat risk 2/10 · Minimal
- Hot days now (above 100°F)
- 7 days/yr
- Hot days in 30 yrs
- 16 days/yr
Wind risk 2/10 · Minimal
- Chance of severe wind over 30 yrs
- —
Air-quality risk 2/10 · Minimal
- Unhealthy air days now
- 1 days/yr
- Unhealthy air days in 30 yrs
- 1 days/yr
Risk factors via First Street. Map © Google.
Why this score? — see what drove the D grade
The composite is a weighted blend of 9 inputs, each scored 0–100. Each bar is that input's sub-score; the figure is the points it added to the 100-point composite (weight × sub-score).
- Cash flow +15.6/30.0
- ARV discount +7.5/15.0
- DSCR +4.8/10.0
- 1% rule +3.9/10.0
- Livability +3.2/5.0
- Rent growth +2.5/5.0
- Condition / age +2.5/5.0
- Schools +2.4/10.0
- Appreciation +0.0/10.0
$209,000
🖨 Deal sheet (PDF) 📄 Offer letter ✓ Due diligence
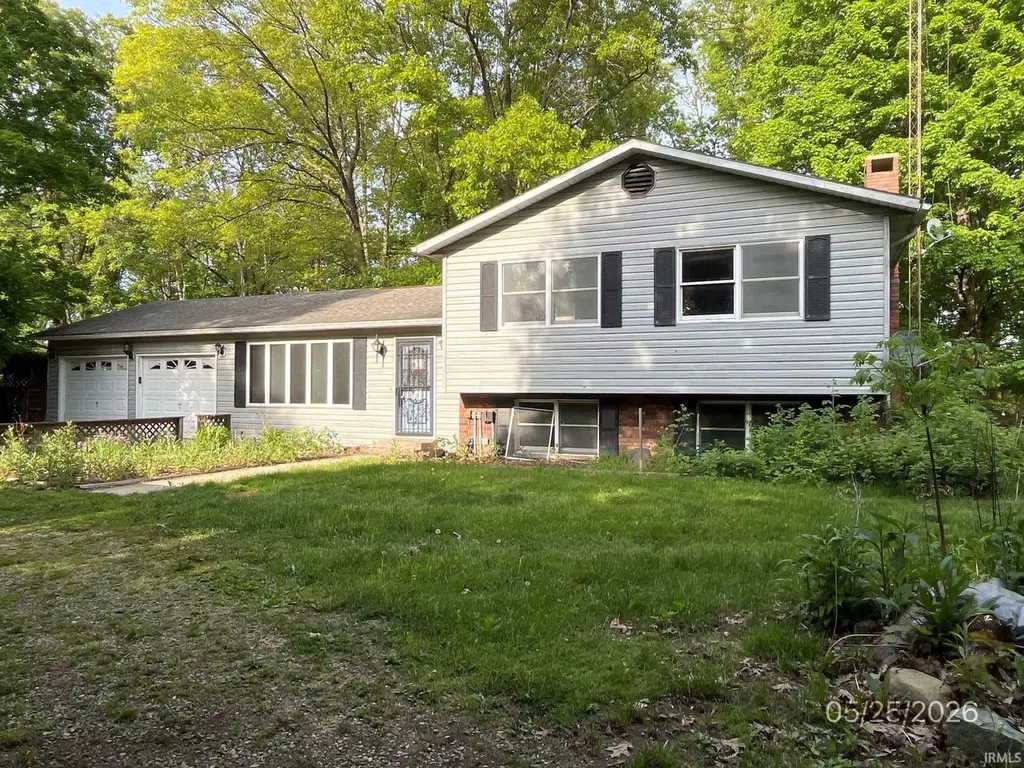
Listing remarks
Tri-level home with views of Hamilton Lake ready for you to put your touches on the interior. Offering 3 Bedrooms, 2 Full Baths plus Living Room and a large Family Room w/ fireplace. Some updates inside and out. Outside you will find a stand alone screened porch. A rare opportunity in the Hamilton Lake area - don't miss your chance to see this one!
Key facts
- 0.92 acre lot
- 2 garage spots
- Built 1975
Tags
Property features AI
Finance
- HOA & community: Homeowners association with an annual fee of $100 (about $8.33/month)
Exterior
- Parking: Attached garage with 2 spaces; Off-street parking
- Utilities: Private well water source; Septic tank sewer
- Home design: Single-family residential, site-built home
- Construction: Vinyl siding; Slab foundation; Built above grade finished area of 2,132
- Exterior features: Deck; Patio; Screened area; Porch; Shed(s); Rolling slope lot with wooded areas and views; Canal-front waterfront on Hamilton Lake
Interior
- Kitchen: Dishwasher; Refrigerator; Electric range
- Bedrooms: 9 total rooms (includes bedrooms and living spaces)
- Bathrooms: 2 full bathrooms
- Heating & cooling: Electric heating; Ceiling fans for cooling
- Interior features: Entrance foyer; Ceiling fans; 1 fireplace in the family room; Crawl space basement
- Laundry & utility: Electric dryer hookup on lower level; Electric water heater
Neighborhood map
What this means for you Summary
Snapshot
- This is a 3-bed/2.0-bath single-family listed at $209k.
Deal economics
- At list price, monthly cash flow is $90 ($1k/yr) — positive.
- The deal already cash-flows at list — no discount required.
- To meet the 1% rule (rent ≥ 1% of price), the offer needs to be $185k (11.5% below list).
- Recommended offer: $185k (11.5% below list) — sets the bar for 1% rule.
- Cap rate 6.8% vs local median 2.7% in Hamilton — top-decile yield for the area; either an underpriced asset or a hidden risk that comps aren't pricing in. Stress-test before assuming the spread holds.
Location & tenants
- Location reads 64/100 on livability (#384 in IN) — a middle-class / working-renter tenant base. Strengths: crime A+, cost of living A+, housing A+; Watch: amenities F, commute F, health & safety F.
- Hamilton Community Schools (rural): math 20% / reading 25% proficiency, ranked #300 of 324 in IN (top 93%) — low school quality limits family demand, transient renter base, plan for 1-2y turnover.
- Zoned schools: Hamilton Community Elementary Sch (math 47% / reading 37%, grade F, #434 of 994 statewide, top 48%, 166 students, 48% FRL); Hamilton Community High School (math 17% / reading 32%, grade F, #325 of 369 statewide, top 91%, 186 students, 42% FRL) — zoned schools average 45% FRL vs 30% district-wide (15 pts higher); higher-poverty schools than district average — tighter screening recommended.
- Market conditions: 35 active listings in the ZIP; 1 comparable units currently listed for rent nearby; 209 units permitted in Steuben County in 2024 (72 in 5+ unit buildings).
Forward outlook
- Local home prices are declining (-3.0%/yr); year-one equity from $1k of loan paydown is wiped out by about $6k of value loss. Plan a longer hold.
- Steuben County population projected at -13% by 2050 — secular population decline; favor cash flow + early exit over multi-decade hold.
Negotiation context
- Only 14 days on market — expect competitive offers; lowballing is unlikely to land.
Questions for the listing agent
- Built in 1975 — when were the roof, HVAC, electrical panel, plumbing, and water heater last replaced?
- What does the HOA fee cover, when was the last increase, and are there any pending special assessments or reserve-fund shortfalls?
- Is there a deadline driving the sale (1031 exchange, divorce, estate, relocation)? That informs how much negotiation room exists.
- Schools are F-rated, which usually means shorter tenancies and higher turnover. Who's the typical renter profile here, and what's been the actual vacancy rate?
- The area grade is low — what's the realistic commute time and amenity access for the typical tenant pool here? Any planned neighborhood developments (good or bad) we should know about?
- What's the average days-on-market for RENTAL listings here right now (not sales)? A rising rental-DOM trend means longer vacancies and softer asking-rent achievability than the comps imply.
- What's the recent tenant-quality profile in this submarket — average credit score on applications, eviction rate, late-payment / NSF rate, and stable-employment percentage? A property-management company in the area should have these aggregated.
- How much new for-sale + rental construction is in the pipeline within 1–3 miles? Heavy new supply typically softens prices + rents 12–24 months out; constrained supply supports both.
Investment metrics
- 1% rule
- 0.89% ✗
- Cap rate
- 6.81%
- Cash-on-cash
- 1.84%
- DSCR
- 1.08
- GRM
- 9.4
CMA / ARV
- ARV (on-the-fly)
- $938,080
- Comps found
- 2
Show comp detail 2 sales within ~0.75 mi
| Address | Dist | Beds/Ba | Sqft | Sold | Price | $/sf | Match |
|---|---|---|---|---|---|---|---|
| 460 Lane 221b Hamilton Lk Lk | 0.55mi | 3/2.5 | 2,192 (+3%) | 23mo | $645,000 | $294 | 48 |
| 660 Lane 221b Hamilton Lake Lk | 0.56mi | 3/2.0 | 1,851 (-13%) | 10mo | $815,000 | $440 | 43 |
Match score weights: distance 35% · size 25% · config 20% · recency 20%. Top-matched comps best support the ARV.
Projected returns pro-forma
-3.0% appreciation · 3.0% rent growth · sell at horizon
- IRR
- -13.4%
- Equity multiple
- 0.52×
- Total profit
- $-28,169
- Equity at exit
- $31,163
- IRR
- -4.5%
- Equity multiple
- 0.71×
- Total profit
- $-17,238
- Equity at exit
- $18,071
Cash invested: $58,520 (down + closing). Projections, not guarantees.
Landlord ↔ Tenant lean methodology
- Overall (STATE)
- 90 Strongly Landlord-Friendly
- State Indiana
- 90 Strongly Landlord-Friendly · R+11
- County
- — inherits STATE
- City
- — inherits STATE
ZIP-level market 46742
- Home prices YoY
- -31.9%
- Active inventory
- 35
- Price-to-rent
- 9.4×
Monthly cashflow live
- Estimated rent
- $1,850 medium interval (Pro) →
- Mortgage (P&I)
- −$1,096
- Tax from tax record
- −$181 /mo · $2,168/yr
- Insurance
- −$87
- HOA
- −$8
- Vacancy / Maint / Mgmt
- −$388
- Net cashflow
- $90
Break-even live
Sensitivity live
| Price | -10% $208 | -5% $149 | +0% $90 | +5% $31 | +10% $-29 |
|---|---|---|---|---|---|
| Rent | -10% $-56 | -5% $17 | +0% $90 | +5% $163 | +10% $236 |
| Rate | -1.0pp $195 | -0.5pp $143 | base $90 | +0.5pp $36 | +1.0pp $-20 |
UW: 25.0% down · 7.5% · 30yr · 1.5% tax · 5.0% vac · 8.0% maint · 8.0% mgmt
Financing live
Cash to close
- Down payment
- $52,250
- Closing costs
- $6,270
- Reserves months
- —
- Total cash needed
- —
Loan-product check · same deal, 3 products live
Conventional
25% down · 7.5% · 30yr
- Down + closing
- —
- Monthly P&I
- —
- Monthly cashflow
- —
- DSCR
- —
- Eligible?
- —
Personal DTI + credit; lowest rate.
DSCR
20% down · 8.5% · 30yr
- Down + closing
- —
- Monthly P&I
- —
- Monthly cashflow
- —
- DSCR
- —
- Eligible?
- —
No personal income docs; deal must DSCR.
Hard money
10% down · 12.0% · 12mo
- Down + closing
- —
- Monthly P&I
- —
- Monthly cashflow
- —
- DSCR
- —
- Eligible?
- —
Short-term bridge; refi at stabilization.
Rent comps 1 comps
| Address | Beds | Baths | Sqft | Rent | $/sqft | DOM | Units | Dist |
|---|---|---|---|---|---|---|---|---|
| 35 Lane 280 E Hamilton, IN | 3.0 | 1.0 | 1544 | $1,850 | $1.20 | 25d | 1 | 0.34mi |
HOA detail
- Monthly dues
- $8 · $96/yr
Listing history 11 events
-
2026-06-22days on market $209,000 Active 14 DOM
-
2026-06-21days on market $209,000 Active 13 DOM
-
2026-06-19days on market $209,000 Active 11 DOM
-
2026-06-18days on market $209,000 Active 10 DOM
-
2026-06-17days on market $209,000 Active 9 DOM
-
2026-06-16days on market $209,000 Active 8 DOM
-
2026-06-15days on market $209,000 Active 7 DOM
-
2026-06-14days on market $209,000 Active 5 DOM
-
2026-06-12days on market $209,000 Active 4 DOM
-
2026-06-09remarks 350-char remark
-
2026-06-09$209,000 Active 1 DOM
ⓘ Source: listings_history table (triggers on properties + properties_extension) + one-shot
backfill from property_details.listing_events for pre-trigger history.
Tax reassessment forecast IN · Partial reset (capped growth)
- Current annual tax
- $2,168 · $181/mo
- Projected year-2 tax
- $2,168 · $181/mo
- Expected delta
- $0/yr ($0/mo · 0.0%)
ⓘ Screening estimate from a state-policy table — verify with the county assessor before closing.
Climate risk First Street
- Flood 1/10 Low FEMA zone X (unshaded) · 0% chance over 30 yrs
- Wildfire 1/10 Low
- Heat 2/10 Low 7 d/yr ≥100°F today · 16 d/yr by 30 yrs out
- Wind 2/10 Low
- Air quality 2/10 Low 1 unhealthy d/yr today · 1 by 30 yrs out
Nearby sold comps map
Loading sold comps map…
Walkable amenities ~0.75 mi
Loading nearby amenities…
Taxation est. · year 1
- Rental income
- $22,200
- − Mortgage interest
- −$11,707
- − Property taxes
- −$2,168
- − Insurance
- −$1,045
- − Repairs & maintenance
- −$1,776
- − Management
- −$1,776
- − HOA
- −$96
- − Depreciation
- −$6,080
- Taxable loss
- −$2,448
- Est. tax savings @ 24.0%
- +$588
- After-tax cash flow
- $1,664/yr
For passive investors: Depreciation is non-cash, so a rental often shows a tax loss while cash-flowing — sheltering income. Rental losses are passive: they offset passive income freely, and up to $25,000/yr can offset ordinary (W-2) income if you actively participate and your MAGI is under $100k (phasing out to $0 by $150k); unused losses carry forward. On sale, claimed depreciation is recaptured at up to 25%, and gains may owe capital-gains tax (a 1031 exchange can defer both). Figures are a year-1 estimate at your 24.0% rate — not tax advice; consult a CPA.
Schools (NCES district)
- District
- Hamilton Community Schools
- NCES district ID
- 1804230
- Math proficiency
- 20% ▼ -20.00%
- Reading proficiency
- 25% ▼ -25.00%
- Median HH income
- $54,064
- Composite
- 23.5/100
- National rank
- #13286
- State rank
- #300 of 324 in IN
Livability — Hamilton
- Score
- 64/100
- State rank
- #384
- US rank
- #14236
Category grades
Schools grade is shown separately in the Schools card above.
Census & demographics
- Census place
- Hamilton, IN
- Population (ZIP)
- 3,126
Population outlook (Steuben County) Hauer SSP2
- Today (2025)
- 34,334 people
- By 2030
- 33,801 · -1.6%
- By 2040
- 32,076 · -6.6%
- By 2050
- 30,022 · -12.6%
- By 2075
- 25,626 · -25.4%
- By 2100
- 21,257 · -38.1%
Race, ethnicity, and origin ACS 2023
- Neighborhood character
- Predominantly White (98%)
- Race & ethnicity
- White 98% Two or more races 2%
- Common ancestry
- Romanian 3% Iranian 3% Italian 1%
- Foreign-born
- 1%
- Languages at home
- 99% English-only · Russian/Polish/Slavic 1%
Political lean MEDSL · Steuben
- 2024 margin
- Solid R (+42.1) · D 28.1% · R 70.2% · Other 1.6%
- 2008→2024 swing
- -32.3pp toward R · 2008: -9.8pp · 2024: -42.1pp
- All cycles
- 2024: R+42.1 2020: R+42.2 2016: R+44.0 2012: R+27.0 2008: R+9.8
Not yet ingested
- Civics
- —
Market trends
- HPI YoY
- ▼ -110.36%
- Current HPI
- 235.4538
- Rent YoY
- —
- Metro
- —
- State GDP YoY
- ▲ 2.90%
- F500 in state
- 18
Industry mix (Fortune 500 HQ in IN)
| Industry | F500 HQs | Revenue |
|---|---|---|
| Industrial Machinery | 2 | $37B |
|
||
| Healthcare | 1 | $177B |
|
||
| Pharmaceuticals | 1 | $45B |
|
||
| Metals / Steel | 1 | $18B |
|
||
| Agriculture | 1 | $17B |
|
||
| Packaging | 1 | $12B |
|
||
Price history
1 event — show timeline
- 2026-06-08 Listed $209,000 IRMLS
Property tax history
+0.4%/yrLatest (2024): $2,168 · +10.9% YoY. Source: county tax records.
Cash-flow waterfall
monthlySold comps — $/sqft
last 12 mo · ≤1 miLoading sold comps…