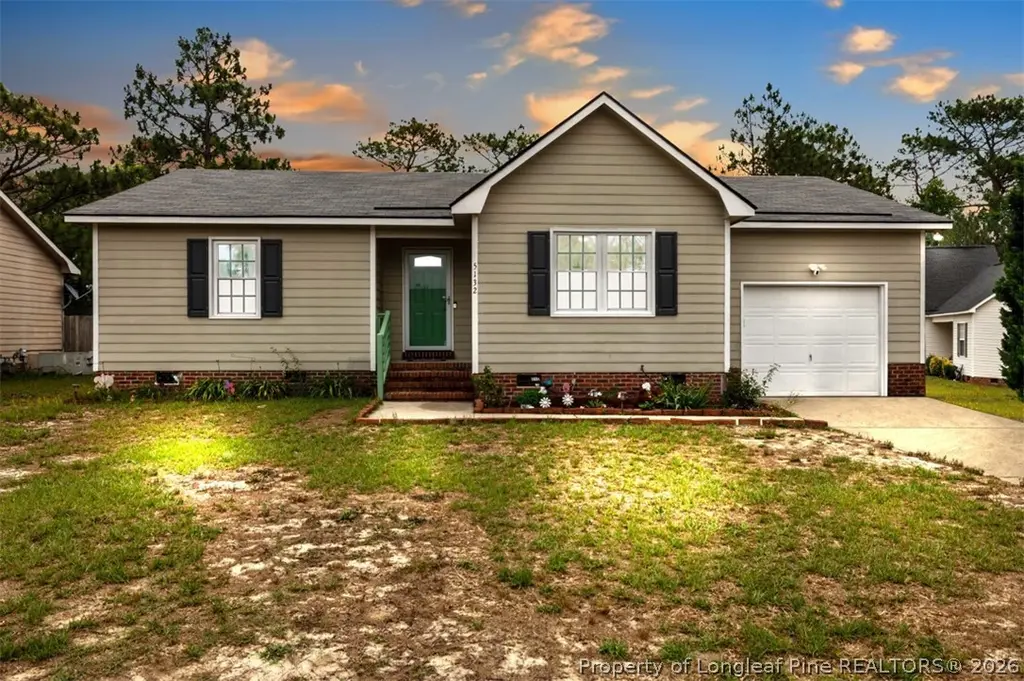
5132 Thackeray Dr · Hope Mills, NC
Flood risk 1/10 · Minimal
- FEMA flood zone
- X (unshaded)
- Chance of flooding over 30 yrs
- 0.0%
- Est. flood insurance / yr
- $507 – $1,088
Fire risk 6/10 · Moderate
- Est. fire insurance / yr
- $906 – $1,684
Heat risk 8/10 · Major
- Hot days now (above 106°F)
- 7 days/yr
- Hot days in 30 yrs
- 16 days/yr
Wind risk 7/10 · Major
- Chance of severe wind over 30 yrs
- 78.0%
Air-quality risk 1/10 · Minimal
- Unhealthy air days now
- 0 days/yr
- Unhealthy air days in 30 yrs
- 0 days/yr
Risk factors via First Street. Map © Google.
Why this score? — see what drove the D grade
The composite is a weighted blend of 9 inputs, each scored 0–100. Each bar is that input's sub-score; the figure is the points it added to the 100-point composite (weight × sub-score).
- Cash flow +13.1/30.0
- ARV discount +8.5/15.0
- DSCR +3.9/10.0
- Livability +3.4/5.0
- Schools +3.1/10.0
- 1% rule +3.0/10.0
- Rent growth +2.7/5.0
- Condition / age +2.5/5.0
- Appreciation +0.0/10.0
$208,000
🖨 Deal sheet 📄 Offer letter ✓ Due diligence
Listing remarks
Welcome! This beautifully updated 3-bedroom, 2-bath home offers comfort and style throughout. Enjoy upgraded bathrooms featuring custom tiled showers, LVP flooring in the main living areas, and cozy carpet in the guest bedrooms. The kitchen comes equipped with stainless steel appliances. Bright living spaces filled with natural light from the large windows, and ceiling fans installed provide year round comfort. Step outside to a spacious fenced backyard complete with a pool, gazebo and plenty of outdoor space to enjoy, perfect for relaxing or entertaining. Additional features include a 1-car garage with laundry hookups. Schedule your showing today and see for yourself all the beautiful upgr
Key facts
- Garage
- Pool
- Built 1999
Property features AI
Finance
- Other: Green/energy-efficient appliances
Exterior
- Parking: Attached garage (1 covered space, 1 garage space)
- Security: Smoke detectors
- Utilities: Public water; Public sewer; 220 volt electric service
- Home design: Residential single-family home; Located in the Saddle Ridge subdivision; Zoned R10 (Residential District)
- Construction: Vinyl siding; Crawl space foundation
- Exterior features: Private yard; Patio (covered); Porch; Fenced with privacy fencing; Above-ground outdoor pool; Cleared, level lot; Paved public-maintained road access
Interior
- Kitchen: Refrigerator; Dishwasher; Range; Disposal; Exhaust fan; Energy Star qualified appliances; Water heater
- Bedrooms: Total rooms: 5
- Flooring: Carpet; Vinyl
- Bathrooms: 2 full bathrooms
- Heating & cooling: Heat pump heating; Ceiling fan cooling
- Interior features: Ceiling fans; Eat-in kitchen; Pantry; See remarks; Walk-in closets; Factory-built fireplace in the living room; Unfurnished
- Laundry & utility: Washer hookup in garage
Neighborhood map
What this means for you Summary
Snapshot
- This is a 3-bed/2.0-bath single-family listed at $208k.
Deal economics
- At list price, monthly cash flow is $-6 ($-70/yr) — negative.
- To cash-flow at today's rent, offer at most $207k (0.5% below list).
- To meet the 1% rule (rent ≥ 1% of price), the offer needs to be $166k (20.4% below list).
- Recommended offer: $166k (20.4% below list) — sets the bar for 1% rule.
- Cap rate 6.3% vs local median 4.8% in Hope Mills — meaningfully above typical; check what's discounted (condition, days-on-market, listing class) to confirm the premium yield is real.
Location & tenants
- Location reads 67/100 on livability (#234 in NC) — a middle-class / working-renter tenant base. Strengths: cost of living A+, housing A+, health & safety B+; Watch: crime D-, amenities F, commute F.
- Cumberland County Schools (urban): math 32% / reading 41% proficiency, ranked #126 of 178 in NC (top 71%) — families likely to look elsewhere, expect single-tenant / working-renter base with shorter leases.
- Zoned schools: Douglas Byrd Middle (math 13% / reading 30%, grade F, #422 of 475 statewide, top 89%, 935 students, 100% FRL); Douglas Byrd High (math 22% / reading 42%, grade F, #445 of 535 statewide, top 84%, 940 students, 99% FRL) — zoned schools average 99% FRL vs 55% district-wide (45 pts higher); higher-poverty schools than district average — tighter screening recommended.
- Market conditions: Rents flat; 401 active listings in the ZIP; 17 comparable units currently listed for rent nearby; rentals at typical pace (median 23d on market — plan ~3-4 weeks tenant-placement turnaround); 1,125 units permitted in Cumberland County in 2024 (104 in 5+ unit buildings).
Forward outlook
- Local home prices are declining (-3.0%/yr); year-one equity from $1k of loan paydown is wiped out by about $6k of value loss. Plan a longer hold.
Negotiation context
- Only 6 days on market — expect competitive offers; lowballing is unlikely to land.
- Current owner paid $104k; list at $208k implies a 100% gain — meaningful room to come down on a strong offer.
Risks & watch-outs
- Climate carrying-cost: major wind risk, 78% chance of damaging wind over 30y; major wildfire risk; extreme-heat days projected 7→16/yr by 2055 (HVAC capex compounding) — expect insurance premiums to compound above CPI over the hold.
Questions for the listing agent
- What do current leases actually rent for vs. the listed asking? Can we see a recent rent roll and the last 12 months of T-12 income?
- Is there a deadline driving the sale (1031 exchange, divorce, estate, relocation)? That informs how much negotiation room exists.
- Schools are D-rated, which usually means shorter tenancies and higher turnover. Who's the typical renter profile here, and what's been the actual vacancy rate?
- Crime grade is D in this area — have there been break-ins, vandalism, or insurance claims at this property in the last 3 years? What carrier currently insures it and at what premium?
- The area grade is low — what's the realistic commute time and amenity access for the typical tenant pool here? Any planned neighborhood developments (good or bad) we should know about?
- What's the average days-on-market for RENTAL listings here right now (not sales)? A rising rental-DOM trend means longer vacancies and softer asking-rent achievability than the comps imply.
- What's the recent tenant-quality profile in this submarket — average credit score on applications, eviction rate, late-payment / NSF rate, and stable-employment percentage? A property-management company in the area should have these aggregated.
- How much new for-sale + rental construction is in the pipeline within 1–3 miles? Heavy new supply typically softens prices + rents 12–24 months out; constrained supply supports both.
Investment metrics
- 1% rule
- 0.80% ✗
- Cap rate
- 6.26%
- Cash-on-cash
- -0.12%
- DSCR
- 0.99
- GRM
- 10.5
CMA / ARV
- ARV (on-the-fly)
- $212,563
- Comps found
- 12
Show comp detail 12 sales within ~0.75 mi
| Address | Dist | Beds/Ba | Sqft | Sold | Price | $/sf | Match |
|---|---|---|---|---|---|---|---|
| 3035 Walesby Dr | 0.10mi | 3/2.0 | 1,074 (-0%) | 16mo | $192,500 | $179 | 81 |
| 5235 Thackeray Dr | 0.14mi | 3/2.0 | 1,044 (-3%) | 18mo | $220,000 | $211 | 72 |
| 1415 Oldstead Dr | 0.33mi | 3/2.0 | 1,162 (+8%) | 8mo | $230,000 | $198 | 65 |
| 1424 Middlesbrough Dr | 0.30mi | 3/2.0 | 1,210 (+12%) | 6mo | $245,000 | $202 | 61 |
| 1054 Coalport Rd | 0.70mi | 3/2.0 | 1,134 (+5%) | 0mo | $214,900 | $190 | 59 |
| 3621 Camden rd Ext | 0.61mi | 3/2.0 | 1,090 (+1%) | 14mo | $209,000 | $192 | 58 |
| 2613 Cameron Woods Ln | 0.69mi | 3/2.0 | 1,091 (+1%) | 10mo | $215,000 | $197 | 58 |
| 2228 Cliff Swallow Dr | 0.63mi | 3/2.0 | 1,101 (+2%) | 12mo | $230,000 | $209 | 57 |
| 1454 Mingary Ave | 0.45mi | 3/2.0 | 1,217 (+13%) | 9mo | $225,000 | $185 | 50 |
| 2625 Cameron Woods Ln | 0.72mi | 3/2.0 | 1,195 (+11%) | 2mo | $210,000 | $176 | 47 |
| 2228 Chasewater Rd | 0.61mi | 3/2.0 | 1,230 (+14%) | 6mo | $245,000 | $199 | 43 |
| 3434 Winesap Rd | 0.73mi | 3/2.0 | 1,231 (+14%) | 5mo | $207,000 | $168 | 38 |
Match score weights: distance 35% · size 25% · config 20% · recency 20%. Top-matched comps best support the ARV.
Projected returns pro-forma
-3.0% appreciation · 0.9% rent growth · sell at horizon
- IRR
- -18.7%
- Equity multiple
- 0.36×
- Total profit
- $-37,557
- Equity at exit
- $31,013
- IRR
- -15.6%
- Equity multiple
- 0.20×
- Total profit
- $-46,877
- Equity at exit
- $17,984
Cash invested: $58,240 (down + closing). Projections, not guarantees.
Landlord ↔ Tenant lean methodology
- Overall (STATE)
- 85 Strongly Landlord-Friendly
- State North Carolina
- 85 Strongly Landlord-Friendly · R+3
- County
- — inherits STATE
- City
- — inherits STATE
ZIP-level market 28306
- Home prices YoY
- -17.7%
- Rents YoY
- 0.9%
- Active inventory
- 401
- Price-to-rent
- 10.5×
Monthly cashflow live
- Estimated rent
- $1,657 high interval (Pro) →
- Mortgage (P&I)
- −$1,091
- Tax from tax record
- −$137 /mo · $1,645/yr
- Insurance
- −$87
- HOA
- −$0
- Vacancy / Maint / Mgmt
- −$348
- Net cashflow
- $-6
Break-even live
UW: 25.0% down · 7.5% · 30yr · 1.5% tax · 5.0% vac · 8.0% maint · 8.0% mgmt
Financing live
Cash to close
- Down payment
- $52,000
- Closing costs
- $6,240
- Reserves months
- —
- Total cash needed
- —
Loan-product check · same deal, 3 products live
Conventional
25% down · 7.5% · 30yr
- Down + closing
- —
- Monthly P&I
- —
- Monthly cashflow
- —
- DSCR
- —
- Eligible?
- —
Personal DTI + credit; lowest rate.
DSCR
20% down · 8.5% · 30yr
- Down + closing
- —
- Monthly P&I
- —
- Monthly cashflow
- —
- DSCR
- —
- Eligible?
- —
No personal income docs; deal must DSCR.
Hard money
10% down · 12.0% · 12mo
- Down + closing
- —
- Monthly P&I
- —
- Monthly cashflow
- —
- DSCR
- —
- Eligible?
- —
Short-term bridge; refi at stabilization.
Rent comps 17 comps
| Address | Beds | Baths | Sqft | Rent | $/sqft | DOM | Units | Dist |
|---|---|---|---|---|---|---|---|---|
| 3038 Walesby Dr Fayetteville, NC | 3.0 | 2.0 | 1272 | $1,650 | $1.30 | 23d | 1 | 0.15mi |
| 1055 Winnall LN Hope Mills, NC | 1.0–3.0 | 1.0–2.0 | 1132 | $2,000 | $1.77 | 13d | 20 | 0.65mi |
| 2207 Puffin Pl Fayetteville, NC | 3.0 | 2.0 | 1214 | $1,950 | $1.61 | 13d | 1 | 0.73mi |
| 1209 Snowy Egret Dr Fayetteville, NC | 3.0 | 2.5 | 1470 | $1,800 | $1.22 | 23d | 1 | 0.74mi |
| 2621 Elcone Dr Unit 2621 Fayetteville, NC | 2.0 | 1.5 | 815 | $999 | $1.23 | 13d | 1 | 1.01mi |
| 2524 Penny Dr Fayetteville, NC | 3.0 | 2.0 | 1330 | $1,400 | $1.05 | 23d | 1 | 1.08mi |
| 3100 Winesap Rd Hope Mills, NC | 3.0 | 2.0 | 1082 | $1,495 | $1.38 | 13d | 1 | 1.08mi |
| 5532 Robmont Dr Fayetteville, NC | 2.0 | 2.0 | 1301 | $1,800 | $1.38 | 13d | 1 | 1.18mi |
| 2579 Gotts Ln Fayetteville, NC | 2.0 | 2.0 | 1200 | $1,295 | $1.08 | 21d | 1 | 1.22mi |
| 2690 Belhaven Rd Fayetteville, NC | 3.0 | 1.0 | 1264 | $1,350 | $1.07 | 23d | 1 | 1.25mi |
| 614 Drypoint Ln Apt B Hope Mills, NC | 2.0 | 2.0 | 900 | $1,050 | $1.17 | 23d | 1 | 1.26mi |
| 5032 Shimmer Dr Fayetteville, NC | 4.0 | 2.0 | 1473 | $1,700 | $1.15 | 13d | 1 | 1.30mi |
| 5032 Shimmer Dr Fayetteville, NC | 4.0 | 2.0 | 1473 | $1,750 | $1.19 | 23d | 1 | 1.30mi |
| 4615 Cumberland Rd Fayetteville, NC | 2.0 | 1.0 | 783 | $825 | $1.05 | 23d | 1 | 1.32mi |
| 3918 Donna St Fayetteville, NC | 3.0 | 1.0 | 1000 | $1,350 | $1.35 | 23d | 1 | 1.38mi |
| 575 Countrytown Dr Hope Mills, NC | 2.0 | 2.0 | 800 | $1,325 | $1.66 | 23d | 1 | 1.46mi |
| 1514 Aristo Pl Hope Mills, NC | 2.0 | 2.0 | 1000 | $1,050 | $1.05 | 13d | 1 | 1.49mi |
Listing history 9 events
-
2026-06-03statusdays on market $208,000 Pending 6 DOM
-
2026-06-02days on market $208,000 Active 5 DOM
-
2026-06-01days on market $208,000 Active 4 DOM
-
2026-05-31days on market $208,000 Active 3 DOM
-
2026-05-30days on market $208,000 Active 2 DOM
-
2026-05-29$208,000 Active
-
2026-05-28historical $208,000
-
2008-09-23soldstatus $104,000
-
2006-09-14soldstatus $99,000
ⓘ Source: listings_history table (triggers on properties + properties_extension) + one-shot
backfill from property_details.listing_events for pre-trigger history.
Tax reassessment forecast NC · Resets to sale price
- Current annual tax
- $1,645 · $137/mo
- Projected year-2 tax
- $1,706 · $142/mo
- Expected delta
- +$61/yr (+$5/mo · 3.7%)
ⓘ Screening estimate from a state-policy table — verify with the county assessor before closing.
Climate risk First Street
- Flood 1/10 Low FEMA zone X (unshaded) · 0% chance over 30 yrs
- Wildfire 6/10 Major
- Heat 8/10 Severe 7 d/yr ≥106°F today · 16 d/yr by 30 yrs out
- Wind 7/10 Severe 78% chance of damaging wind over 30 yrs
- Air quality 1/10 Low 0 unhealthy d/yr today · 0 by 30 yrs out
Nearby sold comps map
Loading sold comps map…
Walkable amenities ~0.75 mi
Loading nearby amenities…
Taxation est. · year 1
- Rental income
- $19,878
- − Mortgage interest
- −$11,651
- − Property taxes
- −$1,645
- − Insurance
- −$1,040
- − Repairs & maintenance
- −$1,590
- − Management
- −$1,590
- − Depreciation
- −$6,051
- Taxable loss
- −$3,689
- Est. tax savings @ 24.0%
- +$885
- After-tax cash flow
- $815/yr
For passive investors: Depreciation is non-cash, so a rental often shows a tax loss while cash-flowing — sheltering income. Rental losses are passive: they offset passive income freely, and up to $25,000/yr can offset ordinary (W-2) income if you actively participate and your MAGI is under $100k (phasing out to $0 by $150k); unused losses carry forward. On sale, claimed depreciation is recaptured at up to 25%, and gains may owe capital-gains tax (a 1031 exchange can defer both). Figures are a year-1 estimate at your 24.0% rate — not tax advice; consult a CPA.
Schools (NCES district)
- District
- Cumberland County Schools
- NCES district ID
- 3700011
- Math proficiency
- 32% ▼ -2.00%
- Reading proficiency
- 41% ▼ -1.00%
- Median HH income
- $44,168
- Composite
- 31.0/100
- National rank
- #6096
- State rank
- #126 of 178 in NC
Livability — Hope Mills
- Score
- 67/100
- State rank
- #234
- US rank
- #10761
Category grades
Schools grade is shown separately in the Schools card above.
Census & demographics
- County
- Cumberland County · 265,314 people
- City population
- 39,196
- Metro
- Fayetteville, NC
- Population (ZIP)
- 43,042
- Household income
- $67,544
- Rent vs Own
- Severe rent burden
- 1386.0
Population outlook (Cumberland County) Hauer SSP2
- Today (2025)
- 330,855 people
- By 2030
- 333,523 · +0.8%
- By 2040
- 335,583 · +1.4%
- By 2050
- 335,325 · +1.4%
- By 2075
- 342,853 · +3.6%
- By 2100
- 340,698 · +3.0%
Race, ethnicity, and origin ACS 2023
- Neighborhood character
- Diverse neighborhood (Simpson 0.68)
- Race & ethnicity
- White 44% Black 33% Hispanic / Latino 13% Two or more races 8% Asian 4% Native American 2%
- Hispanic origin (detail)
- Mexican 5% Puerto Rican 5%
- Common ancestry
- Italian 2% Slovak 1% Serbian 1%
- Foreign-born
- 8% · Canada, South Korea, Jamaica
- Languages at home
- 87% English-only · Spanish 9% Other Indo-European 1% French/Haitian/Cajun 1%
Political lean MEDSL · Cumberland
- 2024 margin
- D (+13.4) · D 56.1% · R 42.7% · Other 1.2%
- 2008→2024 swing
- -4.3pp toward R · 2008: 17.7pp · 2024: 13.4pp
- All cycles
- 2024: D+13.4 2020: D+16.6 2016: D+16.0 2012: D+19.7 2008: D+17.7
Not yet ingested
- Civics
- —
Market trends
- HPI YoY
- ▼ -51.69%
- Current HPI
- 239.7281
- Rent YoY
- ▲ 0.90%
- Metro
- Fayetteville, NC
- State GDP YoY
- ▲ 3.28%
- F500 in state
- 26
Industry mix (Fortune 500 HQ in NC)
| Industry | F500 HQs | Revenue |
|---|---|---|
| Financial Services | 2 | $213B |
|
||
| Retail | 2 | $95B |
|
||
| Industrial Conglomerate | 1 | $38B |
|
||
| Metals / Steel | 1 | $35B |
|
||
| Utilities | 1 | $30B |
|
||
| Industrial Machinery | 1 | $19B |
|
||
Price history
+110.1% since first listed4 events — show timeline
- 2026-05-29 Listed $208,000 LPRMLS
- 2026-05-28 Coming Soon $208,000 LPRMLS
- 2008-09-23 Sold (Public Records) $104,000 Public Records
- 2006-09-14 Sold (Public Records) $99,000 Public Records
Property tax history
+4.7%/yrLatest (2025): $1,645 · +41.2% YoY. Source: county tax records.
Cash-flow waterfall
monthlySold comps — $/sqft
last 12 mo · ≤1 miLoading sold comps…