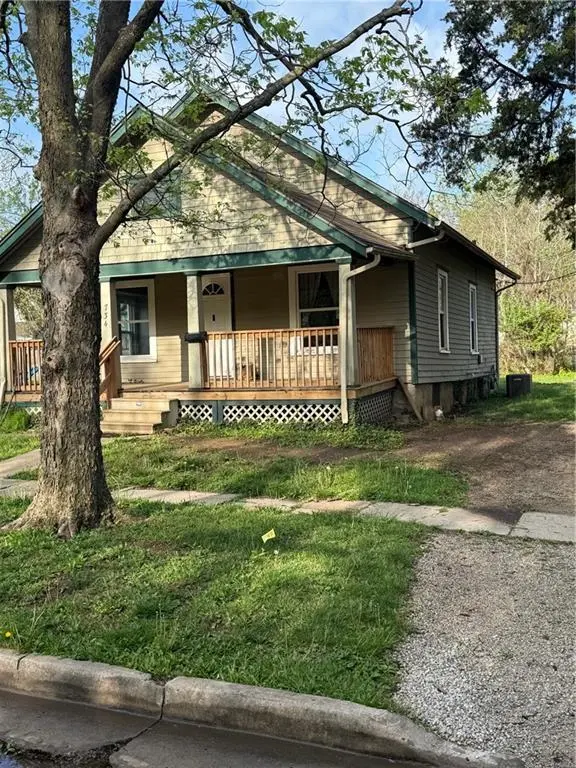
734 S Hickory St S · Ottawa, KS
Flood risk 1/10 · Minimal
- FEMA flood zone
- X (unshaded)
- Chance of flooding over 30 yrs
- 0.0%
- Est. flood insurance / yr
- $473 – $860
Fire risk 2/10 · Minimal
- Est. fire insurance / yr
- $1,154 – $2,142
Heat risk 4/10 · Minor
- Hot days now (above 108°F)
- 7 days/yr
- Hot days in 30 yrs
- 18 days/yr
Wind risk 2/10 · Minimal
- Chance of severe wind over 30 yrs
- —
Air-quality risk 2/10 · Minimal
- Unhealthy air days now
- 1 days/yr
- Unhealthy air days in 30 yrs
- 1 days/yr
Risk factors via First Street. Map © Google.
Why this score? — see what drove the D+ grade
The composite is a weighted blend of 9 inputs, each scored 0–100. Each bar is that input's sub-score; the figure is the points it added to the 100-point composite (weight × sub-score).
- Cash flow +17.1/30.0
- ARV discount +7.5/15.0
- DSCR +5.3/10.0
- 1% rule +4.6/10.0
- Livability +3.6/5.0
- Rent growth +2.5/5.0
- Condition / age +2.5/5.0
- Schools +2.3/10.0
- Appreciation +0.0/10.0
$117,500
🖨 Deal sheet 📄 Offer letter ✓ Due diligence
Listing remarks MLS
2 bedroom 1 bathroom fixer upper on nice street. HVAC is newer (2 years) along with a new sanitary sewer line. Property needs to be cleaned up and ready to go. Property is being sold as-is.
Key facts
- 8,700 sq ft lot
- Built 1920
- Listed 3 days
Neighborhood map
What this means for you Summary
Snapshot
- This is a 2-bed/1.0-bath single-family listed at $118k.
Deal economics
- At list price, monthly cash flow is $82 ($980/yr) — positive.
- The deal already cash-flows at list — no discount required.
- To meet the 1% rule (rent ≥ 1% of price), the offer needs to be $113k (4.2% below list).
- Recommended offer: $113k (4.2% below list) — sets the bar for 1% rule.
Location & tenants
- Location reads 72/100 on livability (#125 in KS) — a middle-class / working-renter tenant base. Strengths: cost of living A+, housing A+, health & safety A+; Watch: employment D+, schools F, amenities F.
- Ottawa (town): math 23% / reading 30% proficiency, ranked #128 of 169 in KS (top 76%) — low school quality limits family demand, transient renter base, plan for 1-2y turnover.
- Market conditions: 106 active listings in the ZIP; 6 comparable units currently listed for rent nearby; rentals at typical pace (median 24d on market — plan ~3-4 weeks tenant-placement turnaround); 85 units permitted in Franklin County in 2024 (0 in 5+ unit buildings).
Forward outlook
- Local home prices are declining (-3.0%/yr); year-one equity from $812 of loan paydown is wiped out by about $4k of value loss. Plan a longer hold.
- Franklin County population projected at -17% by 2050 — secular population decline; favor cash flow + early exit over multi-decade hold.
Negotiation context
- Only 3 days on market — expect competitive offers; lowballing is unlikely to land.
- 3 sale attempts since 16y ago with the ask held roughly flat each time — persistent listings suggest the price (not the market) is what's stuck; bring a comps-based counter.
- Current owner paid $38k; list at $118k implies a 209% gain — meaningful room to come down on a strong offer.
Risks & watch-outs
- Watch-outs: built in 1920 — expect roof / HVAC / electrical / plumbing capex.
Questions for the listing agent
- Built in 1920 — when were the roof, HVAC, electrical panel, plumbing, and water heater last replaced?
- Is there a deadline driving the sale (1031 exchange, divorce, estate, relocation)? That informs how much negotiation room exists.
- Schools are F-rated, which usually means shorter tenancies and higher turnover. Who's the typical renter profile here, and what's been the actual vacancy rate?
- The area grade is low — what's the realistic commute time and amenity access for the typical tenant pool here? Any planned neighborhood developments (good or bad) we should know about?
- What's the average days-on-market for RENTAL listings here right now (not sales)? A rising rental-DOM trend means longer vacancies and softer asking-rent achievability than the comps imply.
- What's the recent tenant-quality profile in this submarket — average credit score on applications, eviction rate, late-payment / NSF rate, and stable-employment percentage? A property-management company in the area should have these aggregated.
- How much new for-sale + rental construction is in the pipeline within 1–3 miles? Heavy new supply typically softens prices + rents 12–24 months out; constrained supply supports both.
Investment metrics
- 1% rule
- 0.96% ✗
- Cap rate
- 7.13%
- Cash-on-cash
- 2.98%
- DSCR
- 1.13
- GRM
- 8.7
CMA / ARV
No comps found within radius.
Projected returns pro-forma
-3.0% appreciation · 3.0% rent growth · sell at horizon
- IRR
- -11.6%
- Equity multiple
- 0.58×
- Total profit
- $-13,826
- Equity at exit
- $17,520
- IRR
- -2.4%
- Equity multiple
- 0.84×
- Total profit
- $-5,286
- Equity at exit
- $10,159
Cash invested: $32,900 (down + closing). Projections, not guarantees.
Landlord ↔ Tenant lean methodology
- Overall (STATE)
- 83 Strongly Landlord-Friendly
- State Kansas
- 83 Strongly Landlord-Friendly · R+10
- County
- — inherits STATE
- City
- — inherits STATE
ZIP-level market 66067
- Home prices YoY
- -33.6%
- Active inventory
- 106
- Price-to-rent
- 8.7×
Monthly cashflow live
- Estimated rent
- $1,125 high interval (Pro) →
- Mortgage (P&I)
- −$616
- Tax from tax record
- −$142 /mo · $1,706/yr
- Insurance
- −$49
- HOA
- −$0
- Vacancy / Maint / Mgmt
- −$236
- Net cashflow
- $82
Break-even live
UW: 25.0% down · 7.5% · 30yr · 1.5% tax · 5.0% vac · 8.0% maint · 8.0% mgmt
Financing live
Cash to close
- Down payment
- $29,375
- Closing costs
- $3,525
- Reserves months
- —
- Total cash needed
- —
Loan-product check · same deal, 3 products live
Conventional
25% down · 7.5% · 30yr
- Down + closing
- —
- Monthly P&I
- —
- Monthly cashflow
- —
- DSCR
- —
- Eligible?
- —
Personal DTI + credit; lowest rate.
DSCR
20% down · 8.5% · 30yr
- Down + closing
- —
- Monthly P&I
- —
- Monthly cashflow
- —
- DSCR
- —
- Eligible?
- —
No personal income docs; deal must DSCR.
Hard money
10% down · 12.0% · 12mo
- Down + closing
- —
- Monthly P&I
- —
- Monthly cashflow
- —
- DSCR
- —
- Eligible?
- —
Short-term bridge; refi at stabilization.
Rent comps 6 comps
| Address | Beds | Baths | Sqft | Rent | $/sqft | DOM | Units | Dist |
|---|---|---|---|---|---|---|---|---|
| 744 S Cedar St Unit 744-012 Ottawa, KS | 1.0 | 1.0 | 845 | $1,000 | $1.18 | 2d | 1 | 0.04mi |
| 744 S Cedar St Unit 745-117 Ottawa, KS | 2.0 | 1.5 | 1100 | $1,200 | $1.09 | 10d | 1 | 0.04mi |
| 4 Canterbury Ct Ottawa, KS | 1.0–4.0 | 1.0–1.5 | 929 | $1,225 | $1.32 | 23d | 4 | 0.74mi |
| 627 N King St Ottawa, KS | 3.0 | 1.5 | 804 | $1,500 | $1.87 | 23d | 1 | 1.28mi |
| 1141 W 17th St Ottawa, KS | 2.0–3.0 | 1.0–2.0 | 1030 | $1,250 | $1.21 | 23d | 2 | 1.40mi |
| 737 N King St Ottawa, KS | 2.0 | 1.0 | 784 | $1,300 | $1.66 | 23d | 1 | 1.40mi |
Listing history 13 events
-
2026-04-18status Pending
-
2026-04-16$117,500 Active
-
2026-04-14historical $117,500
-
2022-10-12soldstatus Closed 189-char remark
Show marketing remark (189 chars)
2 bedroom 1 bathroom fixer upper on nice street. HVAC is newer (2 years) along with a new sanitary sewer line. Property needs to be cleaned up and ready to go. Property is being sold as-is.
-
2022-10-10status Pending 189-char remark
Show marketing remark (189 chars)
2 bedroom 1 bathroom fixer upper on nice street. HVAC is newer (2 years) along with a new sanitary sewer line. Property needs to be cleaned up and ready to go. Property is being sold as-is.
-
2022-10-07soldstatus Closed 189-char remark
Show marketing remark (189 chars)
2 bedroom 1 bathroom fixer upper on nice street. HVAC is newer (2 years) along with a new sanitary sewer line. Property needs to be cleaned up and ready to go. Property is being sold as-is.
-
2022-09-29status Pending 189-char remark
Show marketing remark (189 chars)
2 bedroom 1 bathroom fixer upper on nice street. HVAC is newer (2 years) along with a new sanitary sewer line. Property needs to be cleaned up and ready to go. Property is being sold as-is.
-
2022-09-27$65,000 Active 189-char remark
Show marketing remark (189 chars)
2 bedroom 1 bathroom fixer upper on nice street. HVAC is newer (2 years) along with a new sanitary sewer line. Property needs to be cleaned up and ready to go. Property is being sold as-is.
-
2011-07-18soldstatus 525-char remark
Show marketing remark (525 chars)
REDUCED!! REDUCED!! Move in ready! Cute sunny kitchen with lots of cabinets and refrigerator nook. The living room has a nice window seat. Dining and living area big and open, all wide blinds and carpet. Large bathroom area with lots of storage cabinets and washer/dryer facilities. Inside entrance into full basement. Large trees in front with a porch to enjoy sitting on, on a nice day or evening. Large back yard. This home is affordable, a good buy, makes no sense to rent. Buyers considering a 2 bedroom must go inside.
-
2010-09-24$45,000 525-char remark
Show marketing remark (525 chars)
REDUCED!! REDUCED!! Move in ready! Cute sunny kitchen with lots of cabinets and refrigerator nook. The living room has a nice window seat. Dining and living area big and open, all wide blinds and carpet. Large bathroom area with lots of storage cabinets and washer/dryer facilities. Inside entrance into full basement. Large trees in front with a porch to enjoy sitting on, on a nice day or evening. Large back yard. This home is affordable, a good buy, makes no sense to rent. Buyers considering a 2 bedroom must go inside.
-
2001-05-01soldstatus $38,000
-
1998-07-01soldstatus $25,000
-
1994-10-01soldstatus $35,000
ⓘ Source: listings_history table (triggers on properties + properties_extension) + one-shot
backfill from property_details.listing_events for pre-trigger history.
Tax reassessment forecast KS · Resets to sale price
- Current annual tax
- $1,706 · $142/mo
- Projected year-2 tax
- $1,706 · $142/mo
- Expected delta
- $0/yr ($0/mo · 0.0%)
ⓘ Screening estimate from a state-policy table — verify with the county assessor before closing.
Climate risk First Street
- Flood 1/10 Low FEMA zone X (unshaded) · 0% chance over 30 yrs
- Wildfire 2/10 Low
- Heat 4/10 Moderate 7 d/yr ≥108°F today · 18 d/yr by 30 yrs out
- Wind 2/10 Low
- Air quality 2/10 Low 1 unhealthy d/yr today · 1 by 30 yrs out
Nearby sold comps map
Loading sold comps map…
Walkable amenities ~0.75 mi
Loading nearby amenities…
Taxation est. · year 1
- Rental income
- $13,503
- − Mortgage interest
- −$6,582
- − Property taxes
- −$1,706
- − Insurance
- −$588
- − Repairs & maintenance
- −$1,080
- − Management
- −$1,080
- − Depreciation
- −$3,418
- Taxable loss
- −$951
- Est. tax savings @ 24.0%
- +$228
- After-tax cash flow
- $1,208/yr
For passive investors: Depreciation is non-cash, so a rental often shows a tax loss while cash-flowing — sheltering income. Rental losses are passive: they offset passive income freely, and up to $25,000/yr can offset ordinary (W-2) income if you actively participate and your MAGI is under $100k (phasing out to $0 by $150k); unused losses carry forward. On sale, claimed depreciation is recaptured at up to 25%, and gains may owe capital-gains tax (a 1031 exchange can defer both). Figures are a year-1 estimate at your 24.0% rate — not tax advice; consult a CPA.
Schools (NCES district)
- District
- Ottawa
- NCES district ID
- 2000015
- Math proficiency
- 23% ▲ 2.00%
- Reading proficiency
- 30% ▲ 3.00%
- Median HH income
- $46,080
- Composite
- 22.9/100
- National rank
- #8003
- State rank
- #128 of 169 in KS
Livability — Ottawa
- Score
- 72/100
- State rank
- #125
- US rank
- #6479
Category grades
Schools grade is shown separately in the Schools card above.
Census & demographics
- Census place
- Ottawa, KS
- City population
- 16,146
- Population (ZIP)
- 16,146
Population outlook (Franklin County) Hauer SSP2
- Today (2025)
- 24,777 people
- By 2030
- 24,116 · -2.7%
- By 2040
- 22,426 · -9.5%
- By 2050
- 20,555 · -17.0%
- By 2075
- 17,149 · -30.8%
- By 2100
- 14,526 · -41.4%
Race, ethnicity, and origin ACS 2023
- Neighborhood character
- Predominantly White (89%)
- Race & ethnicity
- White 89% Two or more races 6% Hispanic / Latino 4%
- Common ancestry
- Lithuanian 2% Italian 2% Slovak 1%
- Foreign-born
- 2% · Canada
- Languages at home
- 97% English-only · Spanish 2%
Political lean MEDSL · Franklin
- 2024 margin
- Solid R (+40.1) · D 28.9% · R 69.0% · Other 2.0%
- 2008→2024 swing
- -17.6pp toward R · 2008: -22.5pp · 2024: -40.1pp
- All cycles
- 2024: R+40.1 2020: R+38.4 2016: R+39.4 2012: R+30.4 2008: R+22.5
Not yet ingested
- Civics
- —
Market trends
- HPI YoY
- ▼ -156.97%
- Current HPI
- 309.5576
- Rent YoY
- —
- Metro
- —
- State GDP YoY
- —
- F500 in state
- 0
Price history
+235.7% since first listed13 events — show timeline
- 2026-04-18 Pending — Heartland MLS as Distributed by MLS Grid
- 2026-04-16 Listed $117,500 Heartland MLS as Distributed by MLS Grid
- 2026-04-14 Coming Soon $117,500 Heartland MLS as Distributed by MLS Grid
- 2022-10-12 Sold (MLS) — Heartland MLS as Distributed by MLS Grid
- 2022-10-10 Pending — Heartland MLS as Distributed by MLS Grid
- 2022-10-07 Sold (MLS) — Heartland MLS as Distributed by MLS Grid
- 2022-09-29 Pending — Heartland MLS as Distributed by MLS Grid
- 2022-09-27 Listed $65,000 Heartland MLS as Distributed by MLS Grid
- 2011-07-18 Sold (MLS) — Heartland MLS as Distributed by MLS Grid
- 2010-09-24 Listed $45,000 Heartland MLS as Distributed by MLS Grid
- 2001-05-01 Sold (Public Records) $38,000 Public Records
- 1998-07-01 Sold (Public Records) $25,000 Public Records
- 1994-10-01 Sold (Public Records) $35,000 Public Records
Property tax history
+7.8%/yrLatest (2025): $1,706 · +33.8% YoY. Source: county tax records.
Cash-flow waterfall
monthlySold comps — $/sqft
last 12 mo · ≤1 miLoading sold comps…