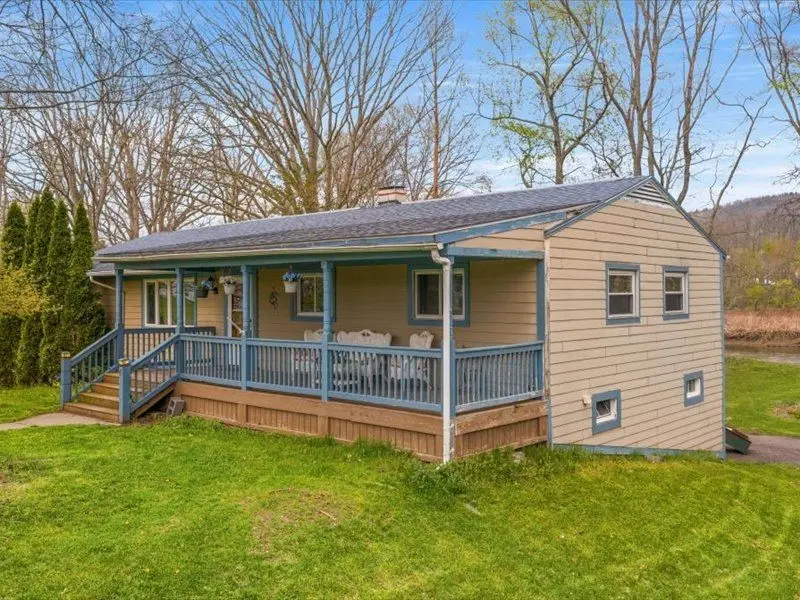
45 Woodcrest Way · Binghamton, NY
Flood risk 9/10 · Severe
- FEMA flood zone
- AE
- Chance of flooding over 30 yrs
- 0.99%
- Est. flood insurance / yr
- $2,026 – $9,024
Fire risk 1/10 · Minimal
- Est. fire insurance / yr
- $691 – $1,283
Heat risk 3/10 · Minor
- Hot days now (above 94°F)
- 7 days/yr
- Hot days in 30 yrs
- 16 days/yr
Wind risk 2/10 · Minimal
- Chance of severe wind over 30 yrs
- 2.0%
Air-quality risk 2/10 · Minimal
- Unhealthy air days now
- 0 days/yr
- Unhealthy air days in 30 yrs
- 1 days/yr
Risk factors via First Street. Map © Google.
Why this score? — see what drove the D grade
The composite is a weighted blend of 9 inputs, each scored 0–100. Each bar is that input's sub-score; the figure is the points it added to the 100-point composite (weight × sub-score).
- ARV discount +15.0/15.0
- Appreciation +10.0/10.0
- Schools +4.6/10.0
- Cash flow +4.4/30.0
- Livability +3.9/5.0
- Rent growth +2.5/5.0
- Condition / age +2.5/5.0
- 1% rule +2.0/10.0
- DSCR +0.0/10.0
$178,000
🖨 Deal sheet 📄 Offer letter ✓ Due diligence
Listing remarks MLS
MAJOR PRICE REDUCTION! Amazing Large Ranch! 3 bd/2.5 Ba. Addition added to create large, open living space with raised ceiling. Newer Stove (2yr) & D/W (2mo). New Furn w/ Humidifier, HWH, & W/ D. Roof (8yr). Majority new windows. Hdwds throughout. Inside painted neutral colors! New kitchen counters. Fabulous deck! Walkout LL. Lots of Privacy. Gazebo area. ALSO INCLUDED NEWER RIDING TRACTOR/LAWNMOWER.
Key facts
- Open-concept home
- Walk-out lower level
- Vaulted ceiling
Tags
Property features AI
Exterior
- Parking: Attached garage; 2-car garage
- Utilities: Public water; Septic tank sewer; Cable available
- Home design: Single family residence; One story; Residential property
- Construction: Wood siding construction; Above-grade finished living area; Finished lower level; Built as a single-story design
- Exterior features: Deck; Waterfront lot; Riverfront location; Has a view
Interior
- Kitchen: Range; Free-standing range; Dishwasher; Refrigerator; Gas water heater
- Flooring: Hardwood; Tile; Vinyl
- Bathrooms: 2 full bathrooms; 1 half bathroom
- Heating & cooling: Forced air heating; Ceiling fans for cooling
- Interior features: Cathedral ceilings; Vaulted ceilings; Insulated windows; Total of 14 rooms
- Laundry & utility: Electric dryer hookup
Neighborhood map
What this means for you Summary
Snapshot
- This is a 3-bed/1.0-bath single-family listed at $178k.
Deal economics
- At list price, monthly cash flow is $-926 ($-11k/yr) — negative.
- To cash-flow at today's rent, offer at most $75k (57.8% below list).
- To meet the 1% rule (rent ≥ 1% of price), the offer needs to be $124k (30.3% below list).
- Recommended offer: $75k (57.8% below list) — sets the bar for cash-flow.
- Cap rate 3.2% vs local median 6.4% in Binghamton — below-typical yield; the buyer is paying a premium for something (appreciation thesis, condition, location) that the cap rate doesn't capture.
Location & tenants
- Location reads 78/100 on livability (#174 in NY, #2,710 nationally) — a middle-class / working-renter tenant base. Strengths: amenities A+, commute A+, cost of living A+; Watch: crime F, employment F.
- Susquehanna Valley Central School District (rural): math 48% / reading 57% proficiency, ranked #330 of 590 in NY (top 56%) — acceptable for families but not a draw, mixed tenant base, ~2y average lease.
- Zoned schools: F P Donnelly School (math 37% / reading 52%, grade F, #1,277 of 2,108 statewide, top 64%, 295 students, 48% FRL).
- Market conditions: 13 active listings in the ZIP; 340 units permitted in Broome County in 2024 (269 in 5+ unit buildings).
Forward outlook
- In year one you build about $19k of equity ($1k loan paydown + $18k appreciation (10.0% local appreciation)).
- Broome County population projected at -13% by 2050 — secular population decline; favor cash flow + early exit over multi-decade hold.
- By year 2, paydown + projected appreciation supports a ~$31k cash-out refi (75% LTV) — recoverable capital for the next deal without selling this one.
Negotiation context
- Only 13 days on market — expect competitive offers; lowballing is unlikely to land.
- 2 sale attempts since 13y ago; this cycle's ask has dropped $10k (5%) from the opening price — seller is motivated, your offer sets the floor, not the list.
Risks & watch-outs
- Watch-outs: property tax is 2.9% of price; flood insurance adds $460/mo; built in 1958 — expect roof / HVAC / electrical / plumbing capex.
- Climate carrying-cost: in FEMA flood zone AE (mandatory federal flood insurance) — expect insurance premiums to compound above CPI over the hold.
Questions for the listing agent
- What do current leases actually rent for vs. the listed asking? Can we see a recent rent roll and the last 12 months of T-12 income?
- Built in 1958 — when were the roof, HVAC, electrical panel, plumbing, and water heater last replaced?
- Property tax is high relative to price — has the assessment been appealed recently, and will the sale trigger a re-assessment?
- What's the actual annual flood-insurance premium (NFIP or private), and is the property in a SFHA with mandatory coverage?
- Is there a deadline driving the sale (1031 exchange, divorce, estate, relocation)? That informs how much negotiation room exists.
- Schools are D-rated, which usually means shorter tenancies and higher turnover. Who's the typical renter profile here, and what's been the actual vacancy rate?
- Crime grade is F in this area — have there been break-ins, vandalism, or insurance claims at this property in the last 3 years? What carrier currently insures it and at what premium?
- The area grade is low — what's the realistic commute time and amenity access for the typical tenant pool here? Any planned neighborhood developments (good or bad) we should know about?
- What's the average days-on-market for RENTAL listings here right now (not sales)? A rising rental-DOM trend means longer vacancies and softer asking-rent achievability than the comps imply.
- What's the recent tenant-quality profile in this submarket — average credit score on applications, eviction rate, late-payment / NSF rate, and stable-employment percentage? A property-management company in the area should have these aggregated.
- How much new for-sale + rental construction is in the pipeline within 1–3 miles? Heavy new supply typically softens prices + rents 12–24 months out; constrained supply supports both.
Investment metrics
- 1% rule
- 0.70% ✗
- Cap rate
- 3.16%
- Cash-on-cash
- -11.20%
- DSCR
- 0.50
- GRM
- 12.0
CMA / ARV
- ARV (median comp)
- $219,516
- List price
- $178,000
- Delta
- -18.91%
- Verdict
- UNDERPRICED
- Comps
- 20 within 1.0 mi
Show comp detail 8 sales within ~0.75 mi
| Address | Dist | Beds/Ba | Sqft | Sold | Price | $/sf | Match |
|---|---|---|---|---|---|---|---|
| 67 Woodcrest Way | 0.18mi | 3/1.5 | 1,512 (-3%) | 2mo | $210,000 | $139 | 82 |
| 7 Grandview Ave | 0.16mi | 4/2.0 (+1) | 1,583 (+2%) | 8mo | $165,000 | $104 | 74 |
| 28 Wilbur Way | 0.36mi | 3/2.0 | 1,586 (+2%) | 7mo | $200,000 | $126 | 70 |
| 61 Leslie Ave | 0.37mi | 3/2.0 | 1,500 (-4%) | 8mo | $191,000 | $127 | 66 |
| 5 Bradley Ave | 0.26mi | 3/2.5 | 1,542 (-1%) | 22mo | $187,000 | $121 | 62 |
| 10 Roxbury St | 0.74mi | 3/2.0 | 1,524 (-2%) | 6mo | $180,200 | $118 | 53 |
| 18 Leslie Ave | 0.29mi | 4/2.0 (+1) | 1,488 (-5%) | 23mo | $175,100 | $118 | 51 |
| 28 Roxbury St | 0.62mi | 2/2.0 (-1) | 1,616 (+4%) | 22mo | $139,750 | $86 | 38 |
Match score weights: distance 35% · size 25% · config 20% · recency 20%. Top-matched comps best support the ARV.
Projected returns pro-forma
10.0% appreciation · 3.0% rent growth · sell at horizon
- IRR
- 9.1%
- Equity multiple
- 1.77×
- Total profit
- $38,419
- Equity at exit
- $160,357
- IRR
- 10.8%
- Equity multiple
- 4.22×
- Total profit
- $160,365
- Equity at exit
- $345,815
Cash invested: $49,840 (down + closing). Projections, not guarantees.
Landlord ↔ Tenant lean methodology
- Overall (STATE)
- 15 Strongly Tenant-Friendly
- State New York
- 15 Strongly Tenant-Friendly · D+10
- County
- — inherits STATE
- City
- — inherits STATE
ZIP-level market 13748
- Home prices YoY
- 30.7%
- Active inventory
- 13
- Price-to-rent
- 12.0×
Monthly cashflow live
- Estimated rent
- $1,240 medium interval (Pro) →
- Mortgage (P&I)
- −$933
- Tax from tax record
- −$438 /mo · $5,250/yr
- Insurance
- −$74
- Flood insurance flood zone
- −$460 /mo · $5,525/yr
- HOA
- −$0
- Vacancy / Maint / Mgmt
- −$260
- Net cashflow
- $-926
Break-even live
UW: 25.0% down · 7.5% · 30yr · 1.5% tax · 5.0% vac · 8.0% maint · 8.0% mgmt
Financing live
Cash to close
- Down payment
- $44,500
- Closing costs
- $5,340
- Reserves months
- —
- Total cash needed
- —
Loan-product check · same deal, 3 products live
Conventional
25% down · 7.5% · 30yr
- Down + closing
- —
- Monthly P&I
- —
- Monthly cashflow
- —
- DSCR
- —
- Eligible?
- —
Personal DTI + credit; lowest rate.
DSCR
20% down · 8.5% · 30yr
- Down + closing
- —
- Monthly P&I
- —
- Monthly cashflow
- —
- DSCR
- —
- Eligible?
- —
No personal income docs; deal must DSCR.
Hard money
10% down · 12.0% · 12mo
- Down + closing
- —
- Monthly P&I
- —
- Monthly cashflow
- —
- DSCR
- —
- Eligible?
- —
Short-term bridge; refi at stabilization.
Listing history 8 events
-
2026-05-06status Pending 975-char remark
-
2026-05-03price $178,000 975-char remark
-
2026-04-23$188,000 Active 975-char remark
-
2013-07-22soldstatus $155,000
-
2013-07-18soldstatus $124,000 413-char remark
Show marketing remark (413 chars)
MAJOR PRICE REDUCTION! Amazing Large Ranch! 3 bd/2.5 Ba. Addition added to create large, open living space with raised ceiling. Newer Stove (2yr) & D/W (2mo). New Furn w/ Humidifier, HWH, & W/ D. Roof (8yr). Majority new windows. Hdwds throughout. Inside painted neutral colors! New kitchen counters. Fabulous deck! Walkout LL. Lots of Privacy. Gazebo area. ALSO INCLUDED NEWER RIDING TRACTOR/LAWNMOWER.
-
2013-01-19$129,000 413-char remark
Show marketing remark (413 chars)
MAJOR PRICE REDUCTION! Amazing Large Ranch! 3 bd/2.5 Ba. Addition added to create large, open living space with raised ceiling. Newer Stove (2yr) & D/W (2mo). New Furn w/ Humidifier, HWH, & W/ D. Roof (8yr). Majority new windows. Hdwds throughout. Inside painted neutral colors! New kitchen counters. Fabulous deck! Walkout LL. Lots of Privacy. Gazebo area. ALSO INCLUDED NEWER RIDING TRACTOR/LAWNMOWER.
-
2004-05-10soldstatus $82,000
-
2000-11-13soldstatus $39,000
ⓘ Source: listings_history table (triggers on properties + properties_extension) + one-shot
backfill from property_details.listing_events for pre-trigger history.
Tax reassessment forecast NY · Partial reset (capped growth)
- Current annual tax
- $5,250 · $438/mo
- Projected year-2 tax
- $5,250 · $438/mo
- Expected delta
- $0/yr ($0/mo · 0.0%)
ⓘ Screening estimate from a state-policy table — verify with the county assessor before closing.
Climate risk First Street
- Flood 9/10 Extreme FEMA zone AE · 99% chance over 30 yrs
- Wildfire 1/10 Low
- Heat 3/10 Moderate 7 d/yr ≥94°F today · 16 d/yr by 30 yrs out
- Wind 2/10 Low 2% chance of damaging wind over 30 yrs
- Air quality 2/10 Low 0 unhealthy d/yr today · 1 by 30 yrs out
Nearby sold comps map
Loading sold comps map…
Walkable amenities ~0.75 mi
Loading nearby amenities…
Taxation est. · year 1
- Rental income
- $14,884
- − Mortgage interest
- −$9,971
- − Property taxes
- −$5,250
- − Insurance
- −$6,415
- − Repairs & maintenance
- −$1,191
- − Management
- −$1,191
- − Depreciation
- −$5,178
- Taxable loss
- −$14,312
- Est. tax savings @ 24.0%
- +$3,435
- After-tax cash flow
- $-7,674/yr
For passive investors: Depreciation is non-cash, so a rental often shows a tax loss while cash-flowing — sheltering income. Rental losses are passive: they offset passive income freely, and up to $25,000/yr can offset ordinary (W-2) income if you actively participate and your MAGI is under $100k (phasing out to $0 by $150k); unused losses carry forward. On sale, claimed depreciation is recaptured at up to 25%, and gains may owe capital-gains tax (a 1031 exchange can defer both). Figures are a year-1 estimate at your 24.0% rate — not tax advice; consult a CPA.
Schools (NCES district)
- District
- Susquehanna Valley Central School District
- NCES district ID
- 3628380
- Math proficiency
- 48% ▼ -9.00%
- Reading proficiency
- 57% ▲ 1.00%
- Median HH income
- $57,681
- Composite
- 45.56/100
- National rank
- #2599
- State rank
- #330 of 590 in NY
Livability — Binghamton
- Score
- 78/100
- State rank
- #174
- US rank
- #2710
Category grades
Schools grade is shown separately in the Schools card above.
Census & demographics
- City population
- 65,170
- Population (ZIP)
- 3,722
Population outlook (Broome County) Hauer SSP2
- Today (2025)
- 187,989 people
- By 2030
- 183,066 · -2.6%
- By 2040
- 172,228 · -8.4%
- By 2050
- 163,161 · -13.2%
- By 2075
- 153,641 · -18.3%
- By 2100
- 140,851 · -25.1%
Race, ethnicity, and origin ACS 2023
- Neighborhood character
- Predominantly White (89%)
- Race & ethnicity
- White 89% Hispanic / Latino 9% Two or more races 3%
- Hispanic origin (detail)
- Mexican 2%
- Common ancestry
- Romanian 11% Iranian 7% Slovak 4%
- Foreign-born
- 9% · Canada
- Languages at home
- 90% English-only · Spanish 8% German/W. Germanic 2%
Political lean MEDSL · Broome
- 2024 margin
- Toss-up / Even · D 50.2% · R 49.8%
- 2008→2024 swing
- -7.6pp toward R · 2008: 8.0pp · 2024: 0.4pp
- All cycles
- 2024: D+0.4 2020: D+3.5 2016: R+3.7 2012: D+4.6 2008: D+8.0
Not yet ingested
- Civics
- —
Market trends
- HPI YoY
- ▲ 71.56%
- Current HPI
- 304.6716
- Rent YoY
- —
- Metro
- —
- State GDP YoY
- ▲ 2.60%
- F500 in state
- 92
Industry mix (Fortune 500 HQ in NY)
| Industry | F500 HQs | Revenue |
|---|---|---|
| Financial Services | 10 | $950B |
|
||
| Consumer Goods | 9 | $162B |
|
||
| Insurance | 4 | $225B |
|
||
| Telecommunications | 2 | $144B |
|
||
| Pharmaceuticals | 2 | $112B |
|
||
| Media / Entertainment | 2 | $69B |
|
||
Price history
+356.4% since first listed8 events — show timeline
- 2026-05-06 Pending — GBAOR
- 2026-05-03 Price Changed $178,000 GBAOR
- 2026-04-23 Listed $188,000 GBAOR
- 2013-07-22 Sold (Public Records) $155,000 Public Records
- 2013-07-18 Sold (MLS) $124,000 GBAOR
- 2013-01-19 Listed $129,000 GBAOR
- 2004-05-10 Sold (Public Records) $82,000 Public Records
- 2000-11-13 Sold (Public Records) $39,000 Public Records
Property tax history
+2.8%/yrLatest (2025): $5,250 · +2.7% YoY. Source: county tax records.
Cash-flow waterfall
monthlySold comps — $/sqft
last 12 mo · ≤1 miLoading sold comps…