 8-Plex
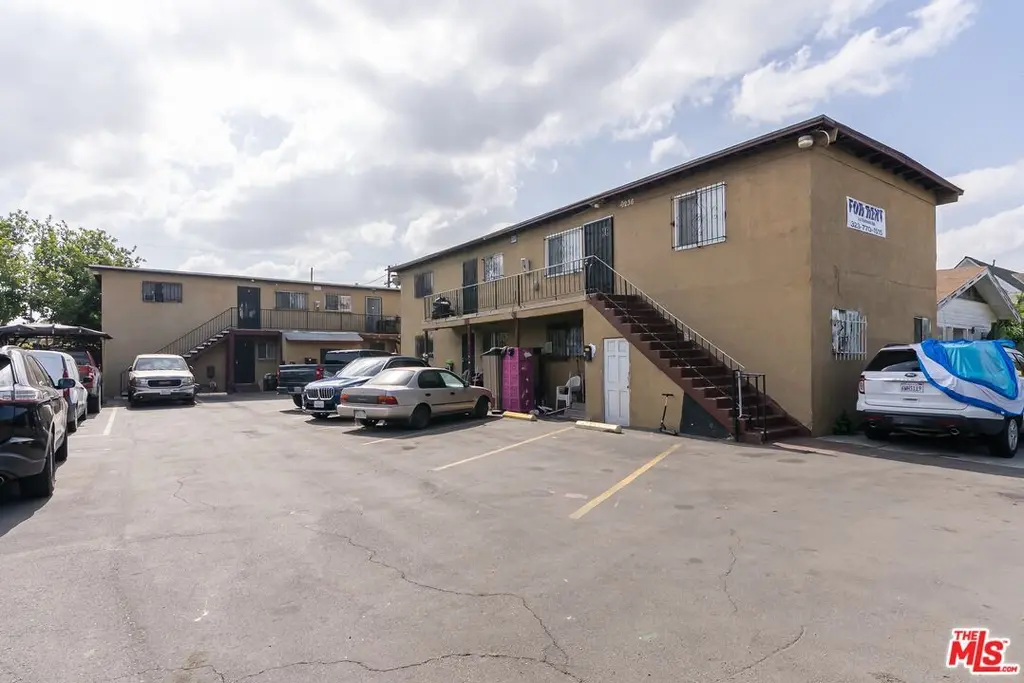
9234 Graham Ave · Los Angeles, CA
Flood risk 1/10 · Minimal
- FEMA flood zone
- X (unshaded)
- Chance of flooding over 30 yrs
- 0.0%
- Est. flood insurance / yr
- $507 – $1,088
Fire risk 1/10 · Minimal
- Est. fire insurance / yr
- $659 – $1,223
Heat risk 5/10 · Moderate
- Hot days now (above 90°F)
- 7 days/yr
- Hot days in 30 yrs
- 21 days/yr
Wind risk 1/10 · Minimal
- Chance of severe wind over 30 yrs
- —
Air-quality risk 5/10 · Moderate
- Unhealthy air days now
- 9 days/yr
- Unhealthy air days in 30 yrs
- 9 days/yr
Risk factors via First Street. Map © Google.
Why this score? — see what drove the C grade
The composite is a weighted blend of 9 inputs, each scored 0–100. Each bar is that input's sub-score; the figure is the points it added to the 100-point composite (weight × sub-score).
- Cash flow +24.5/30.0
- DSCR +7.9/10.0
- ARV discount +7.5/15.0
- 1% rule +6.0/10.0
- Schools +3.6/10.0
- Livability +3.4/5.0
- Rent growth +2.5/5.0
- Condition / age +2.5/5.0
- Appreciation +0.0/10.0
$1,650,000
🖨 Deal sheet 📄 Offer letter ✓ Due diligence
Multi-family units
County records classify this as Multi-Family (5+ Unit). Listing-text estimate: 8 units. confirmed
5+ unit building — per-unit beds/baths from public records are typically unavailable; the breakdown below (if shown) is an estimate from the listing text.
Listing remarks
Excellent multifamily investment opportunity in Los Angeles. This 8-unit property offers strong in-place income with additional upside through lease-up of the current vacancy. The property is currently generating approximately $173,808 in annual gross rental income with one vacant unit, producing an actual GRM of 9.49.Once fully occupied, projected annual gross rental income increases to approximately $199,000, bringing the projected GRM to approximately 8.29. This creates a compelling value-add opportunity for an investor seeking immediate cash flow with clear upside. Nearby transit includes access to the Metro A Line, including the Firestone Station on Graham Avenue and the 103rd Street/W
Key facts
- Metro a line
- 8 unit property
- Nearby transit
Tags
Property features AI
Finance
- Other: Two buildings on the property
- Financial info: Actual annual gross rent of $172,688; Gross operating income $172,688; Net operating income $160,000; Total annual expenses $12,688; Gross rent multiplier 9.55; Vacancy rate 1%; Actual income reported
- HOA & community: Eight units in the complex
Exterior
- Parking: Gated parking; Twelve total parking spaces
- Home design: Residential income property; Building with two levels
- Exterior features: No additional structures on the property; Zoned LAR2
Interior
- Bedrooms: Seven 2-bedroom units; One 2-bedroom unit
- Bathrooms: Seven 1-bath units; One 1-bath unit
- Heating & cooling: Central heating; Window-unit cooling
- Interior features: Attached common walls (multi-unit); Two-level building with two total floors
Neighborhood map
What this means for you Summary
Snapshot
- This is a 8 × 2-bed/1.0-bath units multifamily listed at $1.65M.
Deal economics
- At list price, monthly cash flow is $3k ($41k/yr) — positive. Per door: $423/mo.
- The deal already cash-flows at list — no discount required.
- Meets the 1% rule at list price ($18k rent vs $1.65M).
- Recommended offer: $1.63M (1.5% below list) — sets the bar for market timing.
- Cap rate 8.8% vs local median 2.1% in Los Angeles — top-decile yield for the area; either an underpriced asset or a hidden risk that comps aren't pricing in. Stress-test before assuming the spread holds.
Location & tenants
- Location reads 68/100 on livability (#273 in CA) — a middle-class / working-renter tenant base. Strengths: amenities A+, commute A+, employment B; Watch: health & safety C-, schools D+, crime F.
- Los Angeles Unified (urban): math 29% / reading 54% proficiency, ranked #223 of 517 in CA (top 43%) — families likely to look elsewhere, expect single-tenant / working-renter base with shorter leases; 67% free/reduced lunch — lower-income household profile, screen leases tightly.
- Market conditions: 73 active listings in the ZIP; 19,697 units permitted in Los Angeles County in 2024 (9,426 in 5+ unit buildings).
- At $18,137/mo this rent would consume 369% of the median local household income ($59k/yr) (locally 2997% of renters already pay >50% of income on rent) — very limited rent-growth headroom before tenants either downsize or default.
Forward outlook
- Local home prices are declining (-3.0%/yr); year-one equity from $11k of loan paydown is wiped out by about $50k of value loss. Plan a longer hold.
- Los Angeles County population projected at +9% by 2050 — modest demand growth; plan on rents tracking national, not racing it.
Negotiation context
- It's been on market 29 days — a 2% lower offer ($1.63M) is reasonable based on typical stale-listing flexibility.
- 13 sale attempts since 27y ago with the ask held roughly flat each time — persistent listings suggest the price (not the market) is what's stuck; bring a comps-based counter.
- Current owner paid $1.40M; 18% above their basis — modest negotiation headroom, anchor on the comps not their cost.
Risks & watch-outs
- Watch-outs: built in 1940 — expect roof / HVAC / electrical / plumbing capex.
- Climate carrying-cost: extreme-heat days projected 7→21/yr by 2055 (HVAC capex compounding) — expect insurance premiums to compound above CPI over the hold.
Questions for the listing agent
- Can we see the unit-by-unit rent roll, current vacancy, and any below-market leases? What's the average tenancy length?
- What capital expenditures (roof, boiler, parking lot, exteriors) have been made in the last 5 years, and what's planned in the next 2?
- Built in 1940 — when were the roof, HVAC, electrical panel, plumbing, and water heater last replaced?
- Is there a deadline driving the sale (1031 exchange, divorce, estate, relocation)? That informs how much negotiation room exists.
- Schools are D-rated, which usually means shorter tenancies and higher turnover. Who's the typical renter profile here, and what's been the actual vacancy rate?
- Crime grade is F in this area — have there been break-ins, vandalism, or insurance claims at this property in the last 3 years? What carrier currently insures it and at what premium?
- What's the average days-on-market for RENTAL listings here right now (not sales)? A rising rental-DOM trend means longer vacancies and softer asking-rent achievability than the comps imply.
- What's the recent tenant-quality profile in this submarket — average credit score on applications, eviction rate, late-payment / NSF rate, and stable-employment percentage? A property-management company in the area should have these aggregated.
- How much new apartment / multifamily construction is in the pipeline within 1–3 miles? Heavy new supply (>2% of stock underway) typically softens rents 12–24 months out; light construction supports rent growth.
Investment metrics
- 1% rule
- 1.10% ✓
- Cap rate
- 8.75%
- Cash-on-cash
- 8.79%
- DSCR
- 1.39
- GRM
- 7.6
CMA / ARV
- ARV (on-the-fly)
- $858,480
- Comps found
- 4
Show comp detail 4 sales within ~0.75 mi
| Address | Dist | Beds/Ba | Sqft | Sold | Price | $/sf | Match |
|---|---|---|---|---|---|---|---|
| 9704 Graham Ave | 0.31mi | 7/3.0 (-1) | 2,446 (+4%) | 10mo | $810,000 | $331 | 61 |
| 1615 87th Pl E | 0.45mi | 8/4.0 | 2,237 (-5%) | 18mo | $790,000 | $353 | 56 |
| 9007 Beach St | 0.16mi | 7/5.0 (-1) | 2,486 (+6%) | 23mo | $1,000,000 | $402 | 55 |
| 9802 Graham Ave | 0.35mi | 9/4.0 (+1) | 2,656 (+13%) | 5mo | $970,000 | $365 | 53 |
Match score weights: distance 35% · size 25% · config 20% · recency 20%. Top-matched comps best support the ARV.
Projected returns pro-forma
-3.0% appreciation · 3.0% rent growth · sell at horizon
- IRR
- -3.0%
- Equity multiple
- 0.89×
- Total profit
- $-51,818
- Equity at exit
- $246,020
- IRR
- 6.7%
- Equity multiple
- 1.50×
- Total profit
- $232,414
- Equity at exit
- $142,662
Cash invested: $462,000 (down + closing). Projections, not guarantees.
Landlord ↔ Tenant lean methodology
- Overall (CITY)
- 0 Strongly Tenant-Friendly
- State California
- 18 Strongly Tenant-Friendly · D+13
- County
- — inherits STATE
- City Los Angeles
- 0 Strongly Tenant-Friendly · D+22
ZIP-level market 90002
- Active inventory
- 73
- Price-to-rent
- 60.7×
Monthly cashflow live
- Estimated rent
- $18,137 medium interval (Pro) →
- Mortgage (P&I)
- −$8,653
- Tax from tax record
- −$1,603 /mo · $19,241/yr
- Insurance
- −$688
- HOA
- −$0
- Vacancy / Maint / Mgmt
- −$3,809
- Net cashflow
- $3,385
Break-even live
8-unit breakdown (identical units grouped — click to expand)
| Units | Beds | Baths | Est. rent |
|---|---|---|---|
| 8× units | 2 | 1 | $18,136 |
| #1 | 2 | 1 | $2,267 |
| #2 | 2 | 1 | $2,267 |
| #3 | 2 | 1 | $2,267 |
| #4 | 2 | 1 | $2,267 |
| #5 | 2 | 1 | $2,267 |
| #6 | 2 | 1 | $2,267 |
| #7 | 2 | 1 | $2,267 |
| #8 | 2 | 1 | $2,267 |
| Total (8 units) | $18,137 | ||
UW: 25.0% down · 7.5% · 30yr · 1.5% tax · 5.0% vac · 8.0% maint · 8.0% mgmt
Financing live
Cash to close
- Down payment
- $412,500
- Closing costs
- $49,500
- Reserves months
- —
- Total cash needed
- —
Loan-product check · same deal, 3 products live
Conventional
25% down · 7.5% · 30yr
- Down + closing
- —
- Monthly P&I
- —
- Monthly cashflow
- —
- DSCR
- —
- Eligible?
- —
Personal DTI + credit; lowest rate.
DSCR
20% down · 8.5% · 30yr
- Down + closing
- —
- Monthly P&I
- —
- Monthly cashflow
- —
- DSCR
- —
- Eligible?
- —
No personal income docs; deal must DSCR.
Hard money
10% down · 12.0% · 12mo
- Down + closing
- —
- Monthly P&I
- —
- Monthly cashflow
- —
- DSCR
- —
- Eligible?
- —
Short-term bridge; refi at stabilization.
Listing history 50 events
-
2026-06-18days on market $1,650,000 Active 29 DOM
-
2026-06-17days on market $1,650,000 Active 28 DOM
-
2026-06-16days on market $1,650,000 Active 27 DOM
-
2026-06-15days on market $1,650,000 Active 26 DOM
-
2026-06-13days on market $1,650,000 Active 24 DOM
-
2026-06-09days on market $1,650,000 Active 20 DOM
-
2026-06-08days on market $1,650,000 Active 19 DOM
-
2026-06-07days on market $1,650,000 Active 18 DOM
-
2026-06-04days on market $1,650,000 Active 15 DOM
-
2026-06-03days on market $1,650,000 Active 14 DOM
-
2026-06-02days on market $1,650,000 Active 13 DOM
-
2026-06-01days on market $1,650,000 Active 12 DOM
-
2026-05-31days on market $1,650,000 Active 11 DOM
-
2026-05-20$1,650,000 Active
-
2025-08-13price
-
2025-06-19price
-
2025-04-28price
-
2025-03-04Active
-
2022-12-30soldstatus $1,400,000 Sold
-
2022-12-30soldstatus $1,400,000
-
2022-12-21$1,400,000 Active
-
2022-10-19price
-
2022-08-18price
-
2022-07-07price
-
2022-06-17price
-
2022-05-24Active
-
2018-04-25soldstatus $1,225,000
-
2018-04-25soldstatus $1,225,000 Closed Sale
-
2018-04-20soldstatus $1,225,000
-
2018-01-15$1,249,000
-
2018-01-15$1,249,000 Active
-
2017-10-19soldstatus $950,000
-
2012-12-18price $143,000
-
2012-12-18price $143,000
-
2012-12-18price $143,000
-
2006-02-28soldstatus $825,000
-
2004-08-04soldstatus $500,000
-
2001-09-04soldstatus $265,000
-
2001-09-04soldstatus $265,000
-
2001-09-04soldstatus $265,000
-
2001-07-20historical
-
2001-05-23historical
-
2001-05-22$265,000
-
2001-03-21
-
2001-03-21historical
-
2001-01-24$265,000
-
2000-12-29historical
-
2000-12-29
-
2000-11-16
-
2000-11-16historical
ⓘ Source: listings_history table (triggers on properties + properties_extension) + one-shot
backfill from property_details.listing_events for pre-trigger history.
Tax reassessment forecast CA · Resets to sale price
- Current annual tax
- $19,241 · $1,603/mo
- Projected year-2 tax
- $19,241 · $1,603/mo
- Expected delta
- $0/yr ($0/mo · 0.0%)
ⓘ Screening estimate from a state-policy table — verify with the county assessor before closing.
Climate risk First Street
- Flood 1/10 Low FEMA zone X (unshaded) · 0% chance over 30 yrs
- Wildfire 1/10 Low
- Heat 5/10 Major 7 d/yr ≥90°F today · 21 d/yr by 30 yrs out
- Wind 1/10 Low
- Air quality 5/10 Major 9 unhealthy d/yr today · 9 by 30 yrs out
Nearby sold comps map
Loading sold comps map…
Walkable amenities ~0.75 mi
Loading nearby amenities…
Taxation est. · year 1
- Rental income
- $217,644
- − Mortgage interest
- −$92,426
- − Property taxes
- −$19,241
- − Insurance
- −$8,250
- − Repairs & maintenance
- −$17,412
- − Management
- −$17,412
- − Depreciation
- −$48,000
- Taxable income
- $14,904
- Est. tax owed @ 24.0%
- −$3,577
- After-tax cash flow
- $37,037/yr
For passive investors: Depreciation is non-cash, so a rental often shows a tax loss while cash-flowing — sheltering income. Rental losses are passive: they offset passive income freely, and up to $25,000/yr can offset ordinary (W-2) income if you actively participate and your MAGI is under $100k (phasing out to $0 by $150k); unused losses carry forward. On sale, claimed depreciation is recaptured at up to 25%, and gains may owe capital-gains tax (a 1031 exchange can defer both). Figures are a year-1 estimate at your 24.0% rate — not tax advice; consult a CPA.
Schools (NCES district)
- District
- Los Angeles Unified
- NCES district ID
- 0622710
- Math proficiency
- 29% ▼ -4.00%
- Reading proficiency
- 54% ▲ 10.00%
- Median HH income
- $50,403
- Composite
- 35.67/100
- National rank
- #4875
- State rank
- #223 of 517 in CA
Livability — Los Angeles
- Score
- 68/100
- State rank
- #273
- US rank
- #9237
Category grades
Schools grade is shown separately in the Schools card above.
Census & demographics
- Census place
- Los Angeles, CA
- County
- Los Angeles County · 9,444,647 people
- City population
- 3,838,149
- Metro
- Los Angeles-Long Beach-Anaheim, CA
- Population (ZIP)
- 52,122
- Household income
- $59,021
- Rent vs Own
- Severe rent burden
- 2997.0
Population outlook (Los Angeles County) Hauer SSP2
- Today (2025)
- 10,940,515 people
- By 2030
- 11,256,481 · +2.9%
- By 2040
- 11,729,929 · +7.2%
- By 2050
- 11,948,407 · +9.2%
- By 2075
- 11,818,114 · +8.0%
- By 2100
- 10,842,928 · -0.9%
Race, ethnicity, and origin ACS 2023
- Neighborhood character
- Predominantly Hispanic (82%)
- Race & ethnicity
- Hispanic / Latino 82% Two or more races 23% Black 15% Native American 3% Asian 1%
- Hispanic origin (detail)
- Mexican 61%
- Foreign-born
- 36% · Canada
- Languages at home
- 25% English-only · Spanish 74%
Political lean MEDSL · Los Angeles
- 2024 margin
- Solid D (+32.9) · D 64.8% · R 31.9% · Other 3.3%
- 2008→2024 swing
- -7.4pp toward R · 2008: 40.4pp · 2024: 32.9pp
- All cycles
- 2024: D+32.9 2020: D+44.2 2016: D+48.0 2012: D+40.0 2008: D+40.4
Not yet ingested
- Civics
- —
Market trends
- HPI YoY
- ▼ -698.86%
- Current HPI
- 478.4773
- Rent YoY
- —
- Metro
- Los Angeles-Long Beach-Anaheim, CA
- State GDP YoY
- ▲ 3.21%
- F500 in state
- 116
Industry mix (Fortune 500 HQ in CA)
| Industry | F500 HQs | Revenue |
|---|---|---|
| Technology | 27 | $1,492B |
|
||
| Financial Services | 3 | $174B |
|
||
| Retail | 3 | $44B |
|
||
| Insurance | 3 | $26B |
|
||
| Media / Entertainment | 2 | $115B |
|
||
| Pharmaceuticals / Biotech | 2 | $62B |
|
||
Price history
+371.4% since first listed44 events — show timeline
- 2026-05-20 Listed $1,650,000 TheMLS
- 2025-08-13 Price Changed — TheMLS
- 2025-06-19 Price Changed — TheMLS
- 2025-04-28 Price Changed — TheMLS
- 2025-03-04 Listed — TheMLS
- 2022-12-30 Sold (Public Records) $1,400,000 Public Records
- 2022-12-30 Sold (MLS) $1,400,000 TheMLS
- 2022-12-21 Listed $1,400,000 TheMLS
- 2022-10-19 Price Changed — TheMLS
- 2022-08-18 Price Changed — TheMLS
- 2022-07-07 Price Changed — TheMLS
- 2022-06-17 Price Changed — TheMLS
- 2022-05-24 Listed — TheMLS
- 2018-04-25 Sold (MLS) $1,225,000 CRMLS
- 2018-04-25 Sold (MLS) $1,225,000 SDMLS
- 2018-04-20 Sold (Public Records) $1,225,000 Public Records
- 2018-01-15 Listed $1,249,000 CRMLS
- 2018-01-15 Listed $1,249,000 SDMLS
- 2017-10-19 Sold (Public Records) $950,000 Public Records
- 2012-12-18 Price Changed $143,000 CRMLS
- 2012-12-18 Price Changed $143,000 CRMLS
- 2012-12-18 Price Changed $143,000 CRMLS
- 2006-02-28 Sold (Public Records) $825,000 Public Records
- 2004-08-04 Sold (Public Records) $500,000 Public Records
- 2001-09-04 Sold (Public Records) $265,000 Public Records
- 2001-09-04 Sold (MLS) $265,000 CRMLS
- 2001-09-04 Sold (MLS) $265,000 TheMLS
- 2001-07-20 Delisted — TheMLS
- 2001-05-23 Delisted — TheMLS
- 2001-05-22 Listed $265,000 TheMLS
- 2001-03-21 Delisted — TheMLS
- 2001-03-21 Listed — TheMLS
- 2001-01-24 Listed $265,000 CRMLS
- 2000-12-29 Listed — TheMLS
- 2000-12-29 Delisted — TheMLS
- 2000-11-16 Delisted — TheMLS
- 2000-11-16 Listed — TheMLS
- 2000-10-16 Listed — TheMLS
- 1999-09-02 Price Changed $280,000 CRMLS
- 1999-09-02 Price Changed $280,000 CRMLS
- 1999-09-02 Price Changed $280,000 CRMLS
- 1999-09-02 Price Changed $280,000 CRMLS
- 1999-07-02 Listed $143,000 CRMLS
- 1989-04-17 Sold (Public Records) $350,000 Public Records
Property tax history
+3.3%/yrLatest (2025): $19,241 · +1.2% YoY. Source: county tax records.
Cash-flow waterfall
monthlySold comps — $/sqft
last 12 mo · ≤1 miLoading sold comps…