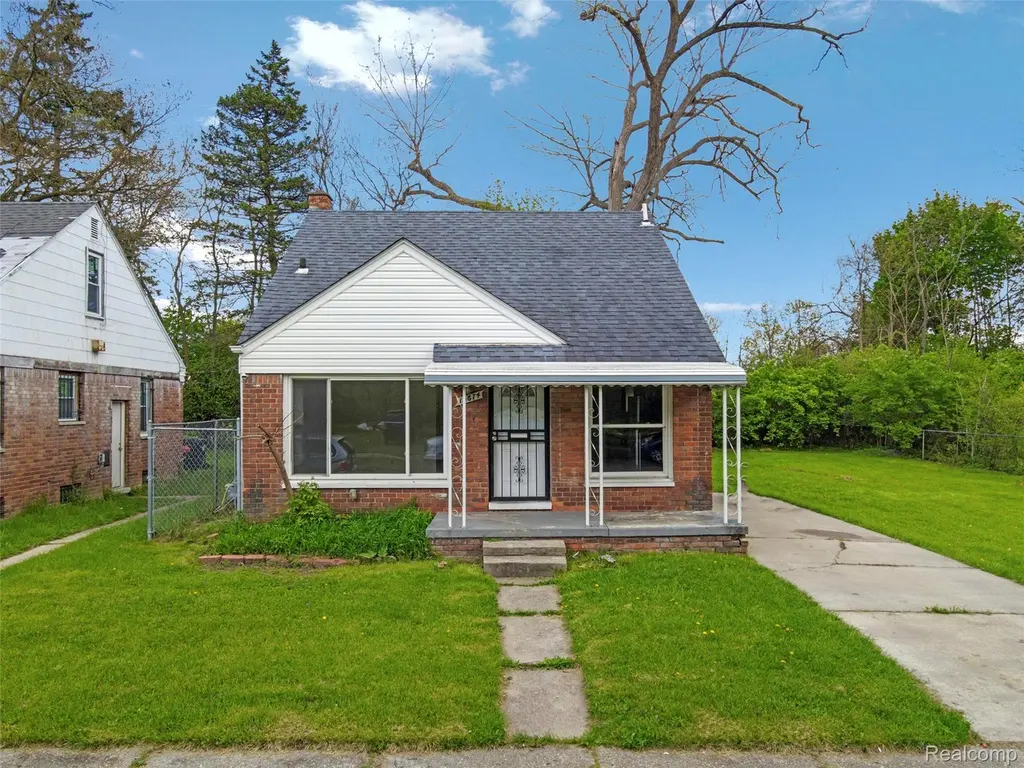
19674 Irvington St · Detroit, MI
Flood risk 1/10 · Minimal
- FEMA flood zone
- X (unshaded)
- Chance of flooding over 30 yrs
- 0.0%
- Est. flood insurance / yr
- $473 – $860
Fire risk 1/10 · Minimal
- Est. fire insurance / yr
- $784 – $1,456
Heat risk 2/10 · Minimal
- Hot days now (above 97°F)
- 7 days/yr
- Hot days in 30 yrs
- 15 days/yr
Wind risk 2/10 · Minimal
- Chance of severe wind over 30 yrs
- —
Air-quality risk 4/10 · Minor
- Unhealthy air days now
- 4 days/yr
- Unhealthy air days in 30 yrs
- 6 days/yr
Risk factors via First Street. Map © Google.
Why this score? — see what drove the B- grade
The composite is a weighted blend of 9 inputs, each scored 0–100. Each bar is that input's sub-score; the figure is the points it added to the 100-point composite (weight × sub-score).
- Cash flow +30.0/30.0
- 1% rule +10.0/10.0
- DSCR +10.0/10.0
- ARV discount +7.5/15.0
- Livability +3.7/5.0
- Rent growth +2.5/5.0
- Condition / age +2.5/5.0
- Schools +1.3/10.0
- Appreciation +0.0/10.0
$74,900
🖨 Deal sheet 📄 Offer letter ✓ Due diligence
Listing remarks MLS
Newly updated 3 bedroom brick bungalow with inviting curb appeal. The main floor includes two bedrooms and an updated full bathroom. Upstairs, you will find a massive primary suite that spans the entire level with abundant closet / storage space - ideal for a peaceful retreat. Enjoy a large backyard (huge double lot) perfect for pets or outdoor gatherings. Conveniently located near Downton, major highways, shopping, restaurants, and local parks.
Key facts
- Near shopping
- Large backyard
- Double lot
Tags
Property features AI
Exterior
- Parking: No garage
- Utilities: Public water; Sewer available
- Home design: Single family residence; One story; Ground-level entry with steps; Brick construction
- Construction: Block foundation; Built with brick exterior
- Exterior features: Covered porch; Porch; Asphalt roof; Paved road access; Lot approximately 0.17 acres (70 x 104.38)
Interior
- Kitchen: Free-standing gas oven; Free-standing refrigerator
- Bathrooms: 1 full bathroom
- Heating & cooling: Forced air heating (natural gas); No cooling
- Interior features: Gas water heater; Free-standing gas oven; Free-standing refrigerator; Unfinished basement
Neighborhood map
What this means for you Summary
Snapshot
- This is a 3-bed/1.0-bath single-family listed at $75k.
Deal economics
- At list price, monthly cash flow is $484 ($6k/yr) — positive.
- The deal already cash-flows at list — no discount required.
- Meets the 1% rule at list price ($1k rent vs $75k).
- Recommended offer: $73k (3.0% below list) — sets the bar for market timing.
- Cap rate 14.0% vs local median 10.2% in Detroit — top-decile yield for the area; either an underpriced asset or a hidden risk that comps aren't pricing in. Stress-test before assuming the spread holds.
Location & tenants
- Location reads 73/100 on livability (#218 in MI) — a middle-class / working-renter tenant base. Strengths: amenities A+, commute A+, cost of living A+; Watch: schools F, crime F, employment F.
- Detroit Public Schools Community District (urban): math 10% / reading 24% proficiency, ranked #499 of 540 in MI (top 92%) — low school quality limits family demand, transient renter base, plan for 1-2y turnover; 90% free/reduced lunch — lower-income household profile, screen leases tightly.
- Market conditions: 216 active listings in the ZIP; 27 comparable units currently listed for rent nearby; rentals at typical pace (median 24d on market — plan ~3-4 weeks tenant-placement turnaround); lower-income renter base — watch delinquency; 2,639 units permitted in Wayne County in 2024 (1,216 in 5+ unit buildings).
- This rent runs 41% of the median local income ($38k/yr) — at the standard rent-burdened threshold; future hikes will face affordability resistance.
Forward outlook
- Local home prices are declining (-3.0%/yr); year-one equity from $518 of loan paydown is wiped out by about $2k of value loss. Plan a longer hold.
- Wayne County population projected at -17% by 2050 — secular population decline; favor cash flow + early exit over multi-decade hold.
- At projected returns (-3.0% appreciation + 3.0% rent growth), your $21k cash investment doubles in ~5 years — after that, you're playing with house money.
Negotiation context
- It's been on market 46 days — a 3% lower offer ($73k) is reasonable based on typical stale-listing flexibility.
- 6 sale attempts since 19y ago; this cycle's ask has dropped $5k (6%) from the opening price — seller is motivated, your offer sets the floor, not the list.
Risks & watch-outs
- Watch-outs: built in 1952 — expect roof / HVAC / electrical / plumbing capex.
Questions for the listing agent
- It's been on market 46 days. Have you received any prior offers? Is the seller open to a 3% concession, seller financing, or rate buy-down credit?
- Built in 1952 — when were the roof, HVAC, electrical panel, plumbing, and water heater last replaced?
- Is there a deadline driving the sale (1031 exchange, divorce, estate, relocation)? That informs how much negotiation room exists.
- Schools are F-rated, which usually means shorter tenancies and higher turnover. Who's the typical renter profile here, and what's been the actual vacancy rate?
- Crime grade is F in this area — have there been break-ins, vandalism, or insurance claims at this property in the last 3 years? What carrier currently insures it and at what premium?
- What's the average days-on-market for RENTAL listings here right now (not sales)? A rising rental-DOM trend means longer vacancies and softer asking-rent achievability than the comps imply.
- What's the recent tenant-quality profile in this submarket — average credit score on applications, eviction rate, late-payment / NSF rate, and stable-employment percentage? A property-management company in the area should have these aggregated.
- How much new for-sale + rental construction is in the pipeline within 1–3 miles? Heavy new supply typically softens prices + rents 12–24 months out; constrained supply supports both.
Investment metrics
- 1% rule
- 1.76% ✓
- Cap rate
- 14.04%
- Cash-on-cash
- 27.67%
- DSCR
- 2.23
- GRM
- 4.7
CMA / ARV
- ARV (median comp)
- $47,182
- List price
- $74,900
- Delta
- 58.75%
- Verdict
- OVERPRICED
- Comps
- 20 within 1.0 mi
Show comp detail 12 sales within ~0.75 mi
| Address | Dist | Beds/Ba | Sqft | Sold | Price | $/sf | Match |
|---|---|---|---|---|---|---|---|
| 19403 Andover St | 0.16mi | 3/1.0 | 1,009 (+2%) | 6mo | $25,000 | $25 | 84 |
| 20529 Irvington St | 0.56mi | 3/1.0 | 946 (-4%) | 3mo | $50,000 | $53 | 64 |
| 20206 Greeley St | 0.64mi | 3/1.0 | 1,016 (+3%) | 5mo | $52,000 | $51 | 61 |
| 20031 Hawthorne St | 0.33mi | 4/2.0 (+1) | 1,040 (+5%) | 8mo | $121,000 | $116 | 60 |
| 20401 Greeley St | 0.67mi | 3/1.0 | 928 (-6%) | 1mo | $55,000 | $59 | 58 |
| 20529 Coventry St | 0.59mi | 2/1.5 (-1) | 1,019 (+3%) | 5mo | $75,900 | $74 | 56 |
| 20739 Caledonia Ave | 0.64mi | 3/1.0 | 925 (-7%) | 4mo | $128,750 | $139 | 56 |
| 20747 Caledonia Ave | 0.65mi | 3/1.0 | 909 (-8%) | 2mo | $144,900 | $159 | 55 |
| 45 E George Ave | 0.75mi | 3/1.0 | 1,015 (+2%) | 12mo | $145,000 | $143 | 51 |
| 19711 Greeley St | 0.50mi | 3/1.0 | 1,125 (+14%) | 4mo | $75,000 | $67 | 51 |
| 1107 E Muir Ave | 0.72mi | 3/1.0 | 1,081 (+9%) | 1mo | $147,900 | $137 | 50 |
| 19163 Orleans St | 0.71mi | 2/1.0 (-1) | 1,080 (+9%) | 2mo | $32,500 | $30 | 45 |
Match score weights: distance 35% · size 25% · config 20% · recency 20%. Top-matched comps best support the ARV.
Projected returns pro-forma
-3.0% appreciation · 3.0% rent growth · sell at horizon
- IRR
- 21.8%
- Equity multiple
- 1.89×
- Total profit
- $18,711
- Equity at exit
- $11,168
- IRR
- 29.9%
- Equity multiple
- 3.68×
- Total profit
- $56,136
- Equity at exit
- $6,476
Cash invested: $20,972 (down + closing). Projections, not guarantees.
Landlord ↔ Tenant lean methodology
- Overall (STATE)
- 62 Landlord-Friendly
- State Michigan
- 62 Landlord-Friendly · EVEN
- County
- — inherits STATE
- City
- — inherits STATE
ZIP-level market 48203
- Home prices YoY
- -23.3%
- Active inventory
- 216
- Price-to-rent
- 4.7×
Monthly cashflow live
- Estimated rent
- $1,316 high interval (Pro) →
- Mortgage (P&I)
- −$393
- Tax from tax record
- −$132 /mo · $1,585/yr
- Insurance
- −$31
- HOA
- −$0
- Vacancy / Maint / Mgmt
- −$276
- Net cashflow
- $484
Break-even live
UW: 25.0% down · 7.5% · 30yr · 1.5% tax · 5.0% vac · 8.0% maint · 8.0% mgmt
Financing live
Cash to close
- Down payment
- $18,725
- Closing costs
- $2,247
- Reserves months
- —
- Total cash needed
- —
Loan-product check · same deal, 3 products live
Conventional
25% down · 7.5% · 30yr
- Down + closing
- —
- Monthly P&I
- —
- Monthly cashflow
- —
- DSCR
- —
- Eligible?
- —
Personal DTI + credit; lowest rate.
DSCR
20% down · 8.5% · 30yr
- Down + closing
- —
- Monthly P&I
- —
- Monthly cashflow
- —
- DSCR
- —
- Eligible?
- —
No personal income docs; deal must DSCR.
Hard money
10% down · 12.0% · 12mo
- Down + closing
- —
- Monthly P&I
- —
- Monthly cashflow
- —
- DSCR
- —
- Eligible?
- —
Short-term bridge; refi at stabilization.
Rent comps 27 comps
| Address | Beds | Baths | Sqft | Rent | $/sqft | DOM | Units | Dist |
|---|---|---|---|---|---|---|---|---|
| 19703 Keating St Highland Park, MI | 3.0 | 1.0 | 1000 | $1,200 | $1.20 | 16d | 1 | 0.15mi |
| 404 W Golden Gate Highland Park, MI | 2.0 | 1.0 | 1050 | $1,100 | $1.05 | 43d | 1 | 0.78mi |
| 406 W Goldengate St Detroit, MI | 2.0 | 1.0 | 1050 | $1,100 | $1.05 | 43d | 1 | 0.78mi |
| 407 E Hayes Ave Hazel Park, MI | 3.0 | 1.0 | 1000 | $1,750 | $1.75 | 24d | 1 | 0.81mi |
| 155 W George Ave Hazel Park, MI | 2.0 | 1.0 | 725 | $1,000 | $1.38 | 24d | 1 | 0.82mi |
| 1019 E Hayes Ave Unit 1032331P Hazel Park, MI | 3.0 | 1.0 | 1033 | $5,301 | $5.13 | 1d | 1 | 0.84mi |
| 18882 Marx St Highland Park, MI | 2.0 | 1.0 | 1000 | $1,300 | $1.30 | 43d | 1 | 0.85mi |
| 1211 E Bernhard Ave Hazel Park, MI | 2.0 | 1.0 | 721 | $1,500 | $2.08 | 24d | 1 | 0.96mi |
| 18551 Saint Aubin St Detroit, MI | 3.0 | 1.0 | 962 | $1,200 | $1.25 | 16d | 1 | 1.03mi |
| 1561 E Webster St Ferndale, MI | 2.0 | 1.0 | 939 | $1,600 | $1.70 | 24d | 1 | 1.06mi |
| 1291 W State Fair Ave Detroit, MI | 1.0–2.0 | 1.0 | 700 | $950 | $1.36 | 12d | 2 | 1.07mi |
| 18629 Fleming St Detroit, MI | 3.0 | 1.5 | 900 | $1,150 | $1.28 | 24d | 1 | 1.09mi |
| 1326 E Evelyn Ave Unit 1032332P Hazel Park, MI | 3.0 | 2.0 | 1097 | $6,448 | $5.88 | 1d | 1 | 1.10mi |
| 2034 John B Ave Warren, MI | 3.0 | 1.0 | 920 | $1,261 | $1.37 | 43d | 1 | 1.13mi |
| 1621 E Evelyn Ave Hazel Park, MI | 2.0 | 1.0 | 749 | $1,295 | $1.73 | 17d | 1 | 1.21mi |
| 90 W Meyers Ave Hazel Park, MI | 2.0 | 1.0 | 831 | $1,800 | $2.17 | 24d | 1 | 1.22mi |
| 18084 Goddard St Detroit, MI | 2.0 | 1.5 | 790 | $1,050 | $1.33 | 16d | 1 | 1.28mi |
| 20255 Harned St Detroit, MI | 3.0 | 1.0 | 1000 | $1,374 | $1.37 | 16d | 1 | 1.30mi |
| 21516 Dequindre Rd Warren, MI | 1.0–2.0 | 1.0 | 837 | $1,375 | $1.64 | 21d | 1 | 1.32mi |
| 790 Jewell St Ferndale, MI | 2.0 | 1.0 | 800 | $1,445 | $1.81 | 24d | 1 | 1.38mi |
| 18666 Joseph Campau St Detroit, MI | 3.0 | 1.0 | 1000 | $1,400 | $1.40 | 16d | 1 | 1.40mi |
| 21155 Warner Ave Warren, MI | 2.0 | 1.0 | 756 | $1,029 | $1.36 | 24d | 1 | 1.41mi |
| 19694 Gallagher St Detroit, MI | 3.0 | 1.0 | 1000 | $1,150 | $1.15 | 14d | 1 | 1.42mi |
| 730 Whitmore Rd Detroit, MI | 1.0–2.0 | 1.0 | 850 | $850 | $1.00 | 43d | 3 | 1.46mi |
| 931 Covington Dr Unit 202 Highland Park, MI | 2.0 | 2.0 | 550 | $1,400 | $2.55 | 43d | 1 | 1.49mi |
| 17765 Manderson Rd Unit 8 Highland Park, MI | 2.0 | 1.0 | 1000 | $1,215 | $1.22 | 1d | 1 | 1.50mi |
| 17765 Manderson Rd Unit 14 Highland Park, MI | 2.0 | 1.0 | 1000 | $1,175 | $1.18 | 43d | 1 | 1.50mi |
Listing history 30 events
-
2026-06-18price $74,900 Active 46 DOM
Show marketing remark (449 chars)
Newly updated 3 bedroom brick bungalow with inviting curb appeal. The main floor includes two bedrooms and an updated full bathroom. Upstairs, you will find a massive primary suite that spans the entire level with abundant closet / storage space - ideal for a peaceful retreat. Enjoy a large backyard (huge double lot) perfect for pets or outdoor gatherings. Conveniently located near Downton, major highways, shopping, restaurants, and local parks.
-
2026-06-18days on market $79,999 Active 46 DOM
Show marketing remark (449 chars)
Newly updated 3 bedroom brick bungalow with inviting curb appeal. The main floor includes two bedrooms and an updated full bathroom. Upstairs, you will find a massive primary suite that spans the entire level with abundant closet / storage space - ideal for a peaceful retreat. Enjoy a large backyard (huge double lot) perfect for pets or outdoor gatherings. Conveniently located near Downton, major highways, shopping, restaurants, and local parks.
-
2026-06-17days on market $79,999 Active 45 DOM
-
2026-06-15days on market $79,999 Active 43 DOM
-
2026-06-13days on market $79,999 Active 41 DOM
-
2026-06-13days on market $79,999 Active 40 DOM
-
2026-06-09days on market $79,999 Active 37 DOM
-
2026-06-08days on market $79,999 Active 36 DOM
-
2026-06-07days on market $79,999 Active 35 DOM
-
2026-06-04days on market $79,999 Active 32 DOM
-
2026-06-03days on market $79,999 Active 31 DOM
-
2026-06-02days on market $79,999 Active 30 DOM
-
2026-06-01days on market $79,999 Active 29 DOM
-
2026-05-31days on market $79,999 Active 28 DOM
-
2026-05-03$79,999 Active 453-char remark
Show marketing remark (449 chars)
Newly updated 3 bedroom brick bungalow with inviting curb appeal. The main floor includes two bedrooms and an updated full bathroom. Upstairs, you will find a massive primary suite that spans the entire level with abundant closet / storage space - ideal for a peaceful retreat. Enjoy a large backyard (huge double lot) perfect for pets or outdoor gatherings. Conveniently located near Downton, major highways, shopping, restaurants, and local parks.
-
2026-05-03$79,999 Active 449-char remark
Show marketing remark (449 chars)
Newly updated 3 bedroom brick bungalow with inviting curb appeal. The main floor includes two bedrooms and an updated full bathroom. Upstairs, you will find a massive primary suite that spans the entire level with abundant closet / storage space - ideal for a peaceful retreat. Enjoy a large backyard (huge double lot) perfect for pets or outdoor gatherings. Conveniently located near Downton, major highways, shopping, restaurants, and local parks.
-
2025-04-25historical $1,200
-
2025-04-22$1,200
-
2025-04-21historical $1,200
-
2025-03-28$1,200
-
2021-10-25soldstatus $242,000
-
2021-08-20soldstatus $58,000
-
2007-08-17soldstatus $7,500
Show marketing remark (266 chars)
BRICK BUNGALOW WITH LOADS OF POTENTIAL! HUGE DOUBLE LOT! DONT BE SHY, SELLER WANTS TO SEE AN OFFER ON THIS ONE! ALL INFO ESTIMATED TO BE VERIFIED BY PURCHASER. /BUYER'S AGENT. PURCHASER TO ASSUME ANY REQUIREMENTS. CALL FOR REO INSTRUCTIONS PRIOR TO SUBMITTING OFFER.
-
2007-07-11historical
-
2007-06-29$10,500
Show marketing remark (266 chars)
BRICK BUNGALOW WITH LOADS OF POTENTIAL! HUGE DOUBLE LOT! DONT BE SHY, SELLER WANTS TO SEE AN OFFER ON THIS ONE! ALL INFO ESTIMATED TO BE VERIFIED BY PURCHASER. /BUYER'S AGENT. PURCHASER TO ASSUME ANY REQUIREMENTS. CALL FOR REO INSTRUCTIONS PRIOR TO SUBMITTING OFFER.
-
2005-01-12soldstatus $70,000
-
1999-08-02soldstatus $18,394
-
1991-06-11soldstatus $16,932
ⓘ Source: listings_history table (triggers on properties + properties_extension) + one-shot
backfill from property_details.listing_events for pre-trigger history.
Tax reassessment forecast MI · Partial reset (capped growth)
- Current annual tax
- $1,585 · $132/mo
- Projected year-2 tax
- $1,585 · $132/mo
- Expected delta
- $0/yr ($0/mo · 0.0%)
ⓘ Screening estimate from a state-policy table — verify with the county assessor before closing.
Climate risk First Street
- Flood 1/10 Low FEMA zone X (unshaded) · 0% chance over 30 yrs
- Wildfire 1/10 Low
- Heat 2/10 Low 7 d/yr ≥97°F today · 15 d/yr by 30 yrs out
- Wind 2/10 Low
- Air quality 4/10 Moderate 4 unhealthy d/yr today · 6 by 30 yrs out
Nearby sold comps map
Loading sold comps map…
Walkable amenities ~0.75 mi
Loading nearby amenities…
Taxation est. · year 1
- Rental income
- $15,794
- − Mortgage interest
- −$4,196
- − Property taxes
- −$1,585
- − Insurance
- −$374
- − Repairs & maintenance
- −$1,263
- − Management
- −$1,263
- − Depreciation
- −$2,179
- Taxable income
- $4,933
- Est. tax owed @ 24.0%
- −$1,184
- After-tax cash flow
- $4,620/yr
For passive investors: Depreciation is non-cash, so a rental often shows a tax loss while cash-flowing — sheltering income. Rental losses are passive: they offset passive income freely, and up to $25,000/yr can offset ordinary (W-2) income if you actively participate and your MAGI is under $100k (phasing out to $0 by $150k); unused losses carry forward. On sale, claimed depreciation is recaptured at up to 25%, and gains may owe capital-gains tax (a 1031 exchange can defer both). Figures are a year-1 estimate at your 24.0% rate — not tax advice; consult a CPA.
Schools (NCES district)
- District
- Detroit Public Schools Community District
- NCES district ID
- 2601103
- Math proficiency
- 10% ▼ -2.00%
- Reading proficiency
- 24% ▲ 6.00%
- Median HH income
- $25,815
- Composite
- 13.06/100
- National rank
- #9564
- State rank
- #499 of 540 in MI
Livability — Detroit
- Score
- 73/100
- State rank
- #218
- US rank
- #5427
Category grades
Schools grade is shown separately in the Schools card above.
Census & demographics
- Census place
- Detroit, MI
- County
- Wayne County · 1,562,939 people
- City population
- 572,865
- Metro
- Detroit-Warren-Dearborn, MI
- Population (ZIP)
- 20,049
- Household income
- $38,404
- Rent vs Own
- Severe rent burden
- 1192.0
Population outlook (Wayne County) Hauer SSP2
- Today (2025)
- 1,675,273 people
- By 2030
- 1,620,300 · -3.3%
- By 2040
- 1,502,341 · -10.3%
- By 2050
- 1,384,039 · -17.4%
- By 2075
- 1,124,592 · -32.9%
- By 2100
- 881,193 · -47.4%
Race, ethnicity, and origin ACS 2023
- Neighborhood character
- Predominantly Black (85%)
- Race & ethnicity
- Black 85% White 8% Two or more races 5% Hispanic / Latino 2%
- Common ancestry
- Lithuanian 1%
- Foreign-born
- 2% · Canada
- Languages at home
- 95% English-only · Spanish 3% French/Haitian/Cajun 1%
Political lean MEDSL · Wayne
- 2024 margin
- Strong D (+29.0) · D 62.7% · R 33.7% · Other 3.6%
- 2008→2024 swing
- -20.5pp toward R · 2008: 49.5pp · 2024: 29.0pp
- All cycles
- 2024: D+29.0 2020: D+38.1 2016: D+37.3 2012: D+46.9 2008: D+49.5
Not yet ingested
- Civics
- —
Market trends
- HPI YoY
- ▼ -90.13%
- Current HPI
- 297.0176
- Rent YoY
- —
- Metro
- Detroit-Warren-Dearborn, MI
- State GDP YoY
- ▲ 1.37%
- F500 in state
- 28
Industry mix (Fortune 500 HQ in MI)
| Industry | F500 HQs | Revenue |
|---|---|---|
| Automotive Parts | 3 | $48B |
|
||
| Automotive | 2 | $372B |
|
||
| Chemicals | 1 | $45B |
|
||
| Automotive Retail | 1 | $29B |
|
||
| Healthcare / Medical Devices | 1 | $23B |
|
||
| Automotive Technology | 1 | $20B |
|
||
Price history
+342.4% since first listed18 events — show timeline
- 2026-06-18 Price Changed $74,900 MiRealSource-MiMLS
- 2026-06-18 Price Changed $74,900 REALCOMP
- 2026-05-03 Listed $79,999 REALCOMP
- 2026-05-03 Listed $79,999 MiRealSource-MiMLS
- 2025-04-25 Rental Removed $1,200 BUILDIUM
- 2025-04-22 Listed for Rent $1,200 BUILDIUM
- 2025-04-21 Rental Removed $1,200 REALSOURCE
- 2025-03-28 Listed for Rent $1,200 REALSOURCE
- 2021-10-25 Sold (Public Records) $242,000 Public Records
- 2021-08-20 Sold (Public Records) $58,000 Public Records
- 2007-08-17 Sold (MLS) $7,500 MiRealSource-MiMLS
- 2007-08-17 Sold (MLS) $7,500 REALCOMP
- 2007-07-11 Listing Removed — MiRealSource-MiMLS
- 2007-06-29 Listed $10,500 MiRealSource-MiMLS
- 2007-06-29 Listed $10,500 REALCOMP
- 2005-01-12 Sold (Public Records) $70,000 Public Records
- 1999-08-02 Sold (Public Records) $18,394 Public Records
- 1991-06-11 Sold (Public Records) $16,932 Public Records
Property tax history
+4.1%/yrLatest (2025): $1,585 · +0.8% YoY. Source: county tax records.
Cash-flow waterfall
monthlySold comps — $/sqft
last 12 mo · ≤1 miLoading sold comps…