907 Ross Ave · Stratford, IA
Flood risk 1/10 · Minimal
- FEMA flood zone
- X (unshaded)
- Chance of flooding over 30 yrs
- 0.0%
- Est. flood insurance / yr
- $473 – $860
Fire risk 3/10 · Minor
- Est. fire insurance / yr
- $902 – $1,676
Heat risk 2/10 · Minimal
- Hot days now (above 102°F)
- 7 days/yr
- Hot days in 30 yrs
- 16 days/yr
Wind risk 2/10 · Minimal
- Chance of severe wind over 30 yrs
- —
Air-quality risk 1/10 · Minimal
- Unhealthy air days now
- 0 days/yr
- Unhealthy air days in 30 yrs
- 0 days/yr
Risk factors via First Street. Map © Google.
Why this score? — see what drove the B grade
The composite is a weighted blend of 9 inputs, each scored 0–100. Each bar is that input's sub-score; the figure is the points it added to the 100-point composite (weight × sub-score).
- Cash flow +27.1/30.0
- DSCR +9.4/10.0
- Appreciation +7.9/10.0
- 1% rule +7.8/10.0
- ARV discount +7.5/15.0
- Schools +5.2/10.0
- Livability +3.5/5.0
- Rent growth +2.5/5.0
- Condition / age +2.5/5.0
$69,900
🖨 Deal sheet 📄 Offer letter ✓ Due diligence
Listing remarks MLS
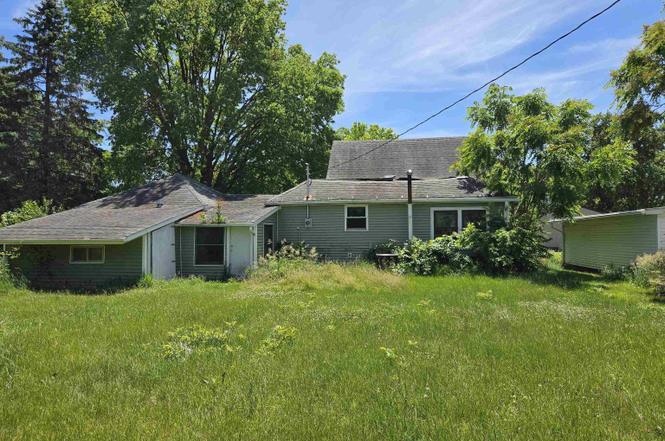
Investor Special! Bring this home back to life and unlock its incredible potential. Situated on a spacious 0.40-acre lot in Stratford, this property offers plenty of room for renovation, expansion, or outdoor living improvements. Whether you're looking for your next investment project, a flip opportunity, or a property to customize to your vision, this home is ready for a fresh start. With its generous lot size and endless possibilities, this is a chance to create something special. Property is being sold as-is.
Key facts
- Investment project
- 0.40-acre lot
- Flip opportunity
Tags
Property features AI
Exterior
- Parking: Detached one-car garage
- Utilities: Public water; Public sewer
- Home design: Residential zoning (R)
- Construction: Vinyl siding; Stone foundation
- Exterior features: Rectangular lot; Asphalt road frontage; Lot dimensions approximately 132 x 132
Interior
- Bedrooms: One main-level bedroom
- Flooring: Carpet; Laminate
- Bathrooms: One three-quarter bathroom
- Heating & cooling: Forced air gas heating; Central air conditioning
- Interior features: Dining area; Carpet and laminate flooring
- Laundry & utility: Laundry on the main level
Neighborhood map
What this means for you Summary
Snapshot
- This is a 3-bed/1.0-bath single-family listed at $70k.
Deal economics
- At list price, monthly cash flow is $199 ($2k/yr) — positive.
- The deal already cash-flows at list — no discount required.
- Meets the 1% rule at list price ($898 rent vs $70k).
Location & tenants
- Location reads 69/100 on livability (#393 in IA) — a middle-class / working-renter tenant base. Strengths: cost of living A+, housing A+, health & safety A+; Watch: employment D+, amenities F, commute F.
- Stratford Community School District (rural): math 60% / reading 60% proficiency, ranked #283 of 330 in IA (top 86%) — acceptable for families but not a draw, mixed tenant base, ~2y average lease.
- Market conditions: 7 active listings in the ZIP; 29 units permitted in Hamilton County in 2024 (5 in 5+ unit buildings).
Forward outlook
- In year one you build about $5k of equity ($483 loan paydown + $4k appreciation (5.8% local appreciation)).
- Hamilton County population projected at -15% by 2050 — secular population decline; favor cash flow + early exit over multi-decade hold.
- At projected returns (5.8% appreciation + 3.0% rent growth), your $20k cash investment doubles in ~3 years — after that, you're playing with house money.
- By year 8, paydown + projected appreciation supports a ~$35k cash-out refi (75% LTV) — recoverable capital for the next deal without selling this one.
Negotiation context
- Only 2 days on market — expect competitive offers; lowballing is unlikely to land.
- 3 sale attempts with the ask held roughly flat each time — persistent listings suggest the price (not the market) is what's stuck; bring a comps-based counter.
Risks & watch-outs
- Watch-outs: built in 1880 — expect roof / HVAC / electrical / plumbing capex.
Questions for the listing agent
- Built in 1880 — when were the roof, HVAC, electrical panel, plumbing, and water heater last replaced?
- Is there a deadline driving the sale (1031 exchange, divorce, estate, relocation)? That informs how much negotiation room exists.
- Schools are B-rated — typically a magnet for longer-tenancy family renters. What's the average tenant stay here, and is there a school-zone premium baked into asking?
- What's the average days-on-market for RENTAL listings here right now (not sales)? A rising rental-DOM trend means longer vacancies and softer asking-rent achievability than the comps imply.
- What's the recent tenant-quality profile in this submarket — average credit score on applications, eviction rate, late-payment / NSF rate, and stable-employment percentage? A property-management company in the area should have these aggregated.
- How much new for-sale + rental construction is in the pipeline within 1–3 miles? Heavy new supply typically softens prices + rents 12–24 months out; constrained supply supports both.
Investment metrics
- 1% rule
- 1.28% ✓
- Cap rate
- 9.71%
- Cash-on-cash
- 12.19%
- DSCR
- 1.54
- GRM
- 6.5
CMA / ARV
No comps found within radius.
Projected returns pro-forma
5.78% appreciation · 3.0% rent growth · sell at horizon
- IRR
- 25.0%
- Equity multiple
- 2.63×
- Total profit
- $31,959
- Equity at exit
- $42,964
- IRR
- 23.7%
- Equity multiple
- 5.31×
- Total profit
- $84,402
- Equity at exit
- $77,082
Cash invested: $19,572 (down + closing). Projections, not guarantees.
Landlord ↔ Tenant lean methodology
- Overall (STATE)
- 83 Strongly Landlord-Friendly
- State Iowa
- 83 Strongly Landlord-Friendly · R+6
- County
- — inherits STATE
- City
- — inherits STATE
ZIP-level market 50249
- Home prices YoY
- 3.2%
- Active inventory
- 7
- Price-to-rent
- 6.5×
Monthly cashflow live
- Estimated rent
- $898 medium interval (Pro) →
- Mortgage (P&I)
- −$367
- Tax from tax record
- −$115 /mo · $1,378/yr
- Insurance
- −$29
- HOA
- −$0
- Vacancy / Maint / Mgmt
- −$189
- Net cashflow
- $199
Break-even live
UW: 25.0% down · 7.5% · 30yr · 1.5% tax · 5.0% vac · 8.0% maint · 8.0% mgmt
Financing live
Cash to close
- Down payment
- $17,475
- Closing costs
- $2,097
- Reserves months
- —
- Total cash needed
- —
Loan-product check · same deal, 3 products live
Conventional
25% down · 7.5% · 30yr
- Down + closing
- —
- Monthly P&I
- —
- Monthly cashflow
- —
- DSCR
- —
- Eligible?
- —
Personal DTI + credit; lowest rate.
DSCR
20% down · 8.5% · 30yr
- Down + closing
- —
- Monthly P&I
- —
- Monthly cashflow
- —
- DSCR
- —
- Eligible?
- —
No personal income docs; deal must DSCR.
Hard money
10% down · 12.0% · 12mo
- Down + closing
- —
- Monthly P&I
- —
- Monthly cashflow
- —
- DSCR
- —
- Eligible?
- —
Short-term bridge; refi at stabilization.
Listing history 3 events
-
2026-06-18days on market $69,900 Active 2 DOM
-
2026-06-17remarks 517-char remark
-
2026-06-17$69,900 Active 1 DOM
ⓘ Source: listings_history table (triggers on properties + properties_extension) + one-shot
backfill from property_details.listing_events for pre-trigger history.
Tax reassessment forecast IA · Partial reset (capped growth)
- Current annual tax
- $1,378 · $115/mo
- Projected year-2 tax
- $1,378 · $115/mo
- Expected delta
- $0/yr ($0/mo · 0.0%)
ⓘ Screening estimate from a state-policy table — verify with the county assessor before closing.
Climate risk First Street
- Flood 1/10 Low FEMA zone X (unshaded) · 0% chance over 30 yrs
- Wildfire 3/10 Moderate
- Heat 2/10 Low 7 d/yr ≥102°F today · 16 d/yr by 30 yrs out
- Wind 2/10 Low
- Air quality 1/10 Low 0 unhealthy d/yr today · 0 by 30 yrs out
Nearby sold comps map
Loading sold comps map…
Walkable amenities ~0.75 mi
Loading nearby amenities…
Taxation est. · year 1
- Rental income
- $10,776
- − Mortgage interest
- −$3,915
- − Property taxes
- −$1,378
- − Insurance
- −$350
- − Repairs & maintenance
- −$862
- − Management
- −$862
- − Depreciation
- −$2,033
- Taxable income
- $1,375
- Est. tax owed @ 24.0%
- −$330
- After-tax cash flow
- $2,056/yr
For passive investors: Depreciation is non-cash, so a rental often shows a tax loss while cash-flowing — sheltering income. Rental losses are passive: they offset passive income freely, and up to $25,000/yr can offset ordinary (W-2) income if you actively participate and your MAGI is under $100k (phasing out to $0 by $150k); unused losses carry forward. On sale, claimed depreciation is recaptured at up to 25%, and gains may owe capital-gains tax (a 1031 exchange can defer both). Figures are a year-1 estimate at your 24.0% rate — not tax advice; consult a CPA.
Schools (NCES district)
- District
- Stratford Community School District
- NCES district ID
- 1927480
- Math proficiency
- 60% ▼ -10.00%
- Reading proficiency
- 60% ▼ -10.00%
- Median HH income
- $47,548
- Composite
- 52.45/100
- National rank
- #3407
- State rank
- #283 of 330 in IA
Livability — Stratford
- Score
- 69/100
- State rank
- #393
- US rank
- #8311
Category grades
Schools grade is shown separately in the Schools card above.
Census & demographics
- Census place
- Stratford, IA
- Population (ZIP)
- 1,256
Population outlook (Hamilton County) Hauer SSP2
- Today (2025)
- 14,602 people
- By 2030
- 14,210 · -2.7%
- By 2040
- 13,312 · -8.8%
- By 2050
- 12,469 · -14.6%
- By 2075
- 11,449 · -21.6%
- By 2100
- 10,806 · -26.0%
Race, ethnicity, and origin ACS 2023
- Neighborhood character
- Predominantly White (92%)
- Race & ethnicity
- White 92% Black 4% Hispanic / Latino 1% Two or more races 1%
- Common ancestry
- Portuguese 3% Slovak 3% Lithuanian 2%
- Foreign-born
- 1% · Canada
- Languages at home
- 99% English-only · Spanish 0%
Political lean MEDSL · Hamilton
- 2024 margin
- Solid R (+33.3) · D 32.8% · R 66.1% · Other 1.1%
- 2008→2024 swing
- -34.6pp toward R · 2008: 1.3pp · 2024: -33.3pp
- All cycles
- 2024: R+33.3 2020: R+26.6 2016: R+22.9 2012: R+2.7 2008: D+1.3
Not yet ingested
- Civics
- —
Market trends
- HPI YoY
- ▲ 5.78%
- Current HPI
- 187.1688
- Rent YoY
- —
- Metro
- —
- State GDP YoY
- ▲ 2.48%
- F500 in state
- 4
Industry mix (Fortune 500 HQ in IA)
| Industry | F500 HQs | Revenue |
|---|---|---|
| Financial Services | 1 | $16B |
|
||
| Retail / Convenience | 1 | $15B |
|
||
Price history
+0.0% since first listed3 events — show timeline
- 2026-06-16 Listed $69,900 IAR
- 2026-06-16 Listed $69,900 CIBOR
- 2026-06-16 Listed $69,900 DMMLS
Property tax history
+24.1%/yrLatest (2025): $1,378 · +4.2% YoY. Source: county tax records.
Cash-flow waterfall
monthlySold comps — $/sqft
last 12 mo · ≤1 miLoading sold comps…