206 S 2nd St · Cedar Bluffs, NE
Flood risk 1/10 · Minimal
- FEMA flood zone
- X (unshaded)
- Chance of flooding over 30 yrs
- 0.0%
- Est. flood insurance / yr
- $507 – $1,088
Fire risk 1/10 · Minimal
- Est. fire insurance / yr
- $1,161 – $2,155
Heat risk 3/10 · Minor
- Hot days now (above 103°F)
- 7 days/yr
- Hot days in 30 yrs
- 16 days/yr
Wind risk 2/10 · Minimal
- Chance of severe wind over 30 yrs
- —
Air-quality risk 1/10 · Minimal
- Unhealthy air days now
- 0 days/yr
- Unhealthy air days in 30 yrs
- 0 days/yr
Risk factors via First Street. Map © Google.
Why this score? — see what drove the D grade
The composite is a weighted blend of 9 inputs, each scored 0–100. Each bar is that input's sub-score; the figure is the points it added to the 100-point composite (weight × sub-score).
- Appreciation +10.0/10.0
- Cash flow +9.0/30.0
- ARV discount +7.5/15.0
- Schools +3.8/10.0
- Livability +3.2/5.0
- DSCR +2.5/10.0
- Rent growth +2.5/5.0
- Condition / age +2.5/5.0
- 1% rule +2.1/10.0
$149,900
🖨 Deal sheet 📄 Offer letter ✓ Due diligence
Listing remarks
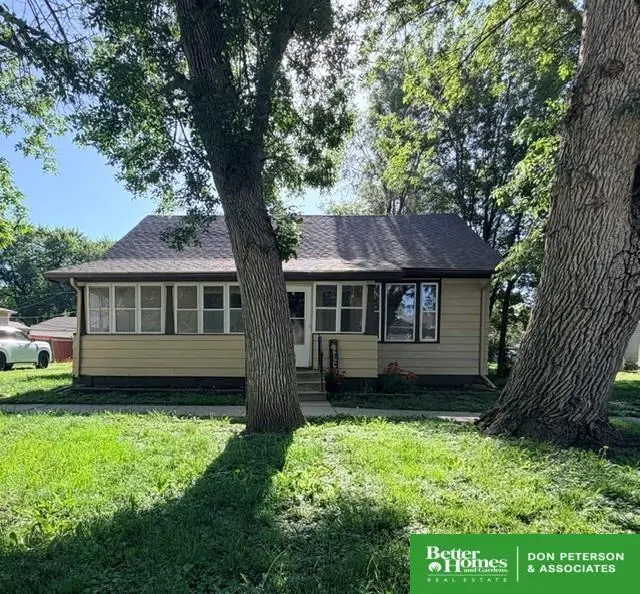
Charming and updated 2-bedroom home full of character in the welcoming community of Cedar Bluffs! You'll love the blend of classic charm and modern updates, featuring beautiful French doors, a butler's pantry, and two updated bathrooms. The spacious enclosed front porch offers a cozy spot to relax year-round, while the covered back deck overlooks the fenced backyard—perfect for entertaining, pets, or gardening. Whether you're looking for your first home, downsizing, or seeking small-town living, this well-maintained property is ready to welcome you home. Agent holds equity and seller holds a NE real estate license.
Key facts
- French doors
- Covered back deck
- Butler's pantry
Tags
Property features AI
Exterior
- Parking: Detached covered parking; One garage space (detached)
- Utilities: Electricity available; Public water; Public sewer
- Home design: Single-family residence; Residential property; Not new / not a model; Living area above grade: 1068 square feet; Lot up to 1/4 acre
- Construction: Aluminum siding; Composition roof; Block foundation; Built in 1908
- Exterior features: Covered porch; Covered deck; Chain link fencing; City lot
Interior
- Kitchen: Kitchen located on the main floor
- Bedrooms: Master bedroom on the main floor; Additional bedroom(s) on the main floor
- Flooring: Carpet; Laminate
- Bathrooms: Two bathrooms total, one full bathroom on the main floor
- Heating & cooling: Natural gas and electric forced-air heating; Central air conditioning
- Interior features: Unfinished basement; No fireplaces
- Laundry & utility: Utilities available: electricity, public water, public sewer
Neighborhood map
What this means for you Summary
Snapshot
- This is a 2-bed/1.0-bath single-family listed at $150k.
Deal economics
- At list price, monthly cash flow is $-118 ($-1k/yr) — negative.
- To cash-flow at today's rent, offer at most $129k (13.9% below list).
- To meet the 1% rule (rent ≥ 1% of price), the offer needs to be $107k (28.9% below list).
- Recommended offer: $107k (28.9% below list) — sets the bar for 1% rule.
Location & tenants
- Location reads 64/100 on livability (#386 in NE) — a middle-class / working-renter tenant base. Strengths: cost of living A+, housing A+, employment B; Watch: amenities F, commute F, health & safety F.
- Cedar Bluffs Public Schools (rural): math 42% / reading 46% proficiency, ranked #85 of 111 in NE (top 77%) — families likely to look elsewhere, expect single-tenant / working-renter base with shorter leases.
- Zoned schools: Cedar Bluffs Elementary School (math 52% / reading 52%, grade C-, #200 of 502 statewide, top 46%, 298 students, 45% FRL); Cedar Bluffs Secondary School (math 27% / reading 42%, grade F, #208 of 261 statewide, top 86%, 171 students, 44% FRL).
- Market conditions: 7 active listings in the ZIP; 138 units permitted in Saunders County in 2024 (0 in 5+ unit buildings).
Forward outlook
- In year one you build about $16k of equity ($1k loan paydown + $15k appreciation (10.0% local appreciation)).
- Saunders County population projected to shrink 6% by 2050 — rents likely to lag national; underwrite the cash flow, not the appreciation.
- By year 3, paydown + projected appreciation supports a ~$41k cash-out refi (75% LTV) — recoverable capital for the next deal without selling this one.
Negotiation context
- It's been on market 15 days — a 2% lower offer ($148k) is reasonable based on typical stale-listing flexibility.
Risks & watch-outs
- Watch-outs: built in 1908 — expect roof / HVAC / electrical / plumbing capex.
Questions for the listing agent
- What do current leases actually rent for vs. the listed asking? Can we see a recent rent roll and the last 12 months of T-12 income?
- Built in 1908 — when were the roof, HVAC, electrical panel, plumbing, and water heater last replaced?
- Is there a deadline driving the sale (1031 exchange, divorce, estate, relocation)? That informs how much negotiation room exists.
- Schools are B-rated — typically a magnet for longer-tenancy family renters. What's the average tenant stay here, and is there a school-zone premium baked into asking?
- The area grade is low — what's the realistic commute time and amenity access for the typical tenant pool here? Any planned neighborhood developments (good or bad) we should know about?
- What's the average days-on-market for RENTAL listings here right now (not sales)? A rising rental-DOM trend means longer vacancies and softer asking-rent achievability than the comps imply.
- What's the recent tenant-quality profile in this submarket — average credit score on applications, eviction rate, late-payment / NSF rate, and stable-employment percentage? A property-management company in the area should have these aggregated.
- How much new for-sale + rental construction is in the pipeline within 1–3 miles? Heavy new supply typically softens prices + rents 12–24 months out; constrained supply supports both.
Investment metrics
- 1% rule
- 0.71% ✗
- Cap rate
- 5.35%
- Cash-on-cash
- -3.38%
- DSCR
- 0.85
- GRM
- 11.7
CMA / ARV
- ARV (on-the-fly)
- $69,420
- Comps found
- 3
Show comp detail 3 sales within ~0.75 mi
| Address | Dist | Beds/Ba | Sqft | Sold | Price | $/sf | Match |
|---|---|---|---|---|---|---|---|
| 103 W Elm St | 0.18mi | 2/1.0 | 1,225 (+15%) | 3mo | $79,500 | $65 | 64 |
| 317 W Elm St | 0.27mi | 3/1.0 (+1) | 1,056 (-1%) | 20mo | $55,000 | $52 | 63 |
| 302 West Main St | 0.19mi | 2/1.0 | 920 (-14%) | 19mo | $80,000 | $87 | 53 |
Match score weights: distance 35% · size 25% · config 20% · recency 20%. Top-matched comps best support the ARV.
Projected returns pro-forma
10.0% appreciation · 3.0% rent growth · sell at horizon
- IRR
- 21.9%
- Equity multiple
- 2.76×
- Total profit
- $74,073
- Equity at exit
- $135,042
- IRR
- 19.7%
- Equity multiple
- 6.34×
- Total profit
- $223,998
- Equity at exit
- $291,223
Cash invested: $41,972 (down + closing). Projections, not guarantees.
Landlord ↔ Tenant lean methodology
- Overall (STATE)
- 83 Strongly Landlord-Friendly
- State Nebraska
- 83 Strongly Landlord-Friendly · R+13
- County
- — inherits STATE
- City
- — inherits STATE
ZIP-level market 68015
- Home prices YoY
- 5.2%
- Active inventory
- 7
- Price-to-rent
- 11.7×
Monthly cashflow live
- Estimated rent
- $1,066 medium interval (Pro) →
- Mortgage (P&I)
- −$786
- Tax from tax record
- −$112 /mo · $1,341/yr
- Insurance
- −$62
- HOA
- −$0
- Vacancy / Maint / Mgmt
- −$224
- Net cashflow
- $-118
Break-even live
UW: 25.0% down · 7.5% · 30yr · 1.5% tax · 5.0% vac · 8.0% maint · 8.0% mgmt
Financing live
Cash to close
- Down payment
- $37,475
- Closing costs
- $4,497
- Reserves months
- —
- Total cash needed
- —
Loan-product check · same deal, 3 products live
Conventional
25% down · 7.5% · 30yr
- Down + closing
- —
- Monthly P&I
- —
- Monthly cashflow
- —
- DSCR
- —
- Eligible?
- —
Personal DTI + credit; lowest rate.
DSCR
20% down · 8.5% · 30yr
- Down + closing
- —
- Monthly P&I
- —
- Monthly cashflow
- —
- DSCR
- —
- Eligible?
- —
No personal income docs; deal must DSCR.
Hard money
10% down · 12.0% · 12mo
- Down + closing
- —
- Monthly P&I
- —
- Monthly cashflow
- —
- DSCR
- —
- Eligible?
- —
Short-term bridge; refi at stabilization.
Listing history 10 events
-
2026-06-16days on market $149,900 Active 15 DOM
-
2026-06-15days on market $149,900 Active 14 DOM
-
2026-06-14days on market $149,900 Active 12 DOM
-
2026-06-12days on market $149,900 Active 11 DOM
-
2026-06-09days on market $149,900 Active 8 DOM
-
2026-06-08days on market $149,900 Active 7 DOM
-
2026-06-07statusdays on market $149,900 Active 6 DOM
-
2026-06-05days on market $149,900 New 3 DOM
-
2026-06-01remarks 622-char remark
-
2026-06-01$149,900 New 1 DOM
ⓘ Source: listings_history table (triggers on properties + properties_extension) + one-shot
backfill from property_details.listing_events for pre-trigger history.
Tax reassessment forecast NE · Resets to sale price
- Current annual tax
- $1,341 · $112/mo
- Projected year-2 tax
- $2,593 · $216/mo
- Expected delta
- +$1,253/yr (+$104/mo · 93.4%)
ⓘ Screening estimate from a state-policy table — verify with the county assessor before closing.
Climate risk First Street
- Flood 1/10 Low FEMA zone X (unshaded) · 0% chance over 30 yrs
- Wildfire 1/10 Low
- Heat 3/10 Moderate 7 d/yr ≥103°F today · 16 d/yr by 30 yrs out
- Wind 2/10 Low
- Air quality 1/10 Low 0 unhealthy d/yr today · 0 by 30 yrs out
Nearby sold comps map
Loading sold comps map…
Walkable amenities ~0.75 mi
Loading nearby amenities…
Taxation est. · year 1
- Rental income
- $12,789
- − Mortgage interest
- −$8,397
- − Property taxes
- −$1,341
- − Insurance
- −$750
- − Repairs & maintenance
- −$1,023
- − Management
- −$1,023
- − Depreciation
- −$4,361
- Taxable loss
- −$4,105
- Est. tax savings @ 24.0%
- +$985
- After-tax cash flow
- $-435/yr
For passive investors: Depreciation is non-cash, so a rental often shows a tax loss while cash-flowing — sheltering income. Rental losses are passive: they offset passive income freely, and up to $25,000/yr can offset ordinary (W-2) income if you actively participate and your MAGI is under $100k (phasing out to $0 by $150k); unused losses carry forward. On sale, claimed depreciation is recaptured at up to 25%, and gains may owe capital-gains tax (a 1031 exchange can defer both). Figures are a year-1 estimate at your 24.0% rate — not tax advice; consult a CPA.
Schools (NCES district)
- District
- Cedar Bluffs Public Schools
- NCES district ID
- 3104870
- Math proficiency
- 42% ▼ -8.00%
- Reading proficiency
- 46% ▲ 1.00%
- Median HH income
- $52,878
- Composite
- 38.07/100
- National rank
- #4282
- State rank
- #85 of 111 in NE
Livability — Cedar Bluffs
- Score
- 64/100
- State rank
- #386
- US rank
- #14372
Category grades
Schools grade is shown separately in the Schools card above.
Census & demographics
- Census place
- Cedar Bluffs, NE
- Population (ZIP)
- 1,232
Population outlook (Saunders County) Hauer SSP2
- Today (2025)
- 21,261 people
- By 2030
- 21,249 · -0.1%
- By 2040
- 20,927 · -1.6%
- By 2050
- 20,041 · -5.7%
- By 2075
- 18,386 · -13.5%
- By 2100
- 15,066 · -29.1%
Race, ethnicity, and origin ACS 2023
- Neighborhood character
- Predominantly White (93%)
- Race & ethnicity
- White 93% Black 3% Two or more races 2%
- Common ancestry
- Romanian 3% Lithuanian 2% Scottish 1%
- Foreign-born
- 1%
- Languages at home
- 97% English-only · Other Asian/Pacific 1% Spanish 1% German/W. Germanic 1%
Political lean MEDSL · Saunders
- 2024 margin
- Solid R (+46.4) · D 26.2% · R 72.6% · Other 1.1%
- 2008→2024 swing
- -22.7pp toward R · 2008: -23.7pp · 2024: -46.4pp
- All cycles
- 2024: R+46.4 2020: R+45.2 2016: R+47.0 2012: R+33.8 2008: R+23.7
Not yet ingested
- Civics
- —
Market trends
- HPI YoY
- ▲ 14.77%
- Current HPI
- 297.8995
- Rent YoY
- —
- Metro
- —
- State GDP YoY
- ▲ 0.68%
- F500 in state
- 2
Industry mix (Fortune 500 HQ in NE)
| Industry | F500 HQs | Revenue |
|---|---|---|
| Conglomerate | 1 | $371B |
|
||
Price history
1 event — show timeline
- 2026-06-01 Listed $149,900 GPRMLS
Property tax history
+8.0%/yrLatest (2025): $1,341 · +12.9% YoY. Source: county tax records.
Cash-flow waterfall
monthlySold comps — $/sqft
last 12 mo · ≤1 miLoading sold comps…