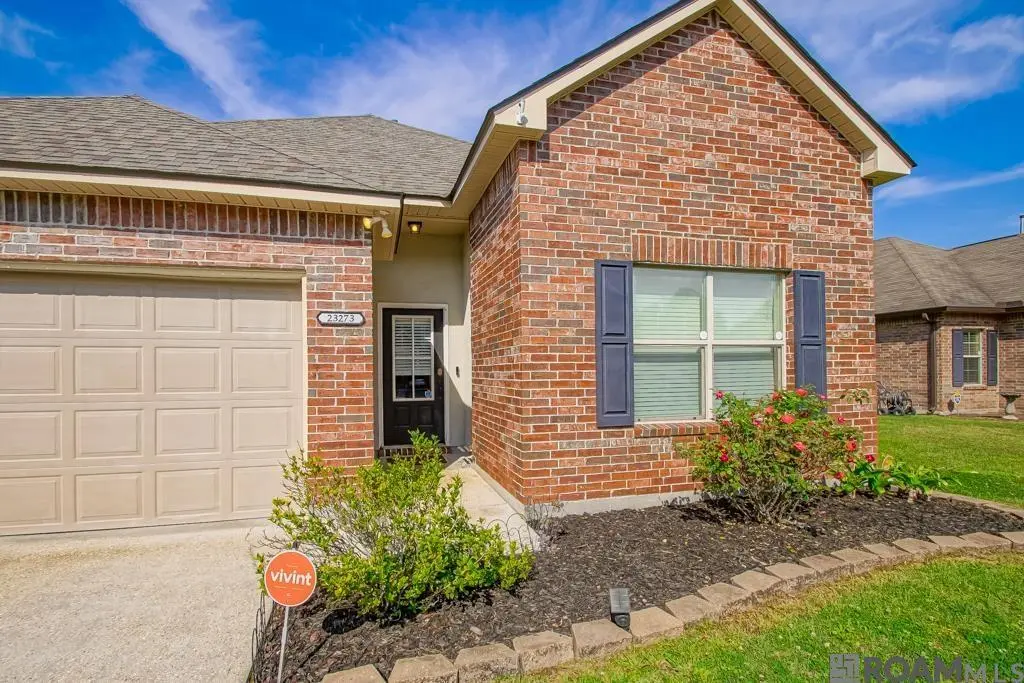
23273 Conifer Dr · Walker, LA
Flood risk 1/10 · Minimal
- FEMA flood zone
- X (unshaded)
- Chance of flooding over 30 yrs
- 0.0%
- Est. flood insurance / yr
- $507 – $1,088
Fire risk 3/10 · Minor
- Est. fire insurance / yr
- $1,269 – $2,357
Heat risk 8/10 · Major
- Hot days now (above 108°F)
- 7 days/yr
- Hot days in 30 yrs
- 22 days/yr
Wind risk 9/10 · Severe
- Chance of severe wind over 30 yrs
- 99.0%
Air-quality risk 3/10 · Minor
- Unhealthy air days now
- 2 days/yr
- Unhealthy air days in 30 yrs
- 3 days/yr
Risk factors via First Street. Map © Google.
Why this score? — see what drove the D- grade
The composite is a weighted blend of 9 inputs, each scored 0–100. Each bar is that input's sub-score; the figure is the points it added to the 100-point composite (weight × sub-score).
- Cash flow +12.5/30.0
- ARV discount +7.0/15.0
- Schools +4.0/10.0
- Livability +3.8/5.0
- DSCR +3.7/10.0
- Rent growth +3.5/5.0
- 1% rule +3.0/10.0
- Condition / age +2.5/5.0
- Appreciation +0.0/10.0
$220,000
🖨 Deal sheet (PDF) 📄 Offer letter ✓ Due diligence
Listing remarks MLS
This one just feels like home. From the moment you walk in, you'll notice the high ceilings and natural flow of the split floor plan. The kitchen opens effortlessly into the living room, making it easy to host gatherings. A fireplace adds the perfect touch of comfort, while the oversized primary suite creates a private escape with a spacious bathroom and walk in closet. Out back, you'll find a large fenced in yard ready for everything from quiet mornings to weekend get togethers. No flood insurance required and the roof was replaced in 2021!
Key facts
- Split floor plan
- Large fenced in yard
- Fireplace
Tags
Neighborhood map
What this means for you Summary
Snapshot
- This is a 3-bed/2.0-bath single-family listed at $220k.
Deal economics
- At list price, monthly cash flow is $-32 ($-380/yr) — negative.
- To cash-flow at today's rent, offer at most $214k (2.5% below list).
- To meet the 1% rule (rent ≥ 1% of price), the offer needs to be $176k (20.1% below list).
- Recommended offer: $176k (20.1% below list) — sets the bar for 1% rule.
- Cap rate 6.1% vs local median 4.8% in Walker — meaningfully above typical; check what's discounted (condition, days-on-market, listing class) to confirm the premium yield is real.
Location & tenants
- Location reads 75/100 on livability (#19 in LA, #3,999 nationally) — a middle-class / working-renter tenant base. Strengths: cost of living A+, housing A+, health & safety A+; Watch: crime F, amenities D-, commute F.
- Livingston Parish (suburban): math 40% / reading 52% proficiency, ranked #13 of 98 in LA (top 13%) — families likely to look elsewhere, expect single-tenant / working-renter base with shorter leases.
- Market conditions: Rents rising (+3.8%/yr); 985 active listings in the ZIP; 6 comparable units currently listed for rent nearby; rentals at typical pace (median 25d on market — plan ~3-4 weeks tenant-placement turnaround); solid renter incomes; 794 units permitted in Livingston Parish in 2024 (99 in 5+ unit buildings).
Forward outlook
- Local home prices are declining (-3.0%/yr); year-one equity from $2k of loan paydown is wiped out by about $7k of value loss. Plan a longer hold.
- Livingston County population projected at +27% by 2050 — long-run rental-demand tailwind backs the buy-and-hold thesis.
Negotiation context
- It's been on market 15 days — a 2% lower offer ($217k) is reasonable based on typical stale-listing flexibility.
- 5 sale attempts since 14y ago with the ask held roughly flat each time — persistent listings suggest the price (not the market) is what's stuck; bring a comps-based counter.
- Current owner paid $167k; 32% above their basis — modest negotiation headroom, anchor on the comps not their cost.
Risks & watch-outs
- Climate carrying-cost: severe wind risk, 99% chance of damaging wind over 30y; extreme-heat days projected 7→22/yr by 2055 (HVAC capex compounding) — expect insurance premiums to compound above CPI over the hold.
Questions for the listing agent
- What do current leases actually rent for vs. the listed asking? Can we see a recent rent roll and the last 12 months of T-12 income?
- Is there a deadline driving the sale (1031 exchange, divorce, estate, relocation)? That informs how much negotiation room exists.
- Schools are A-rated — typically a magnet for longer-tenancy family renters. What's the average tenant stay here, and is there a school-zone premium baked into asking?
- Crime grade is F in this area — have there been break-ins, vandalism, or insurance claims at this property in the last 3 years? What carrier currently insures it and at what premium?
- The area grade is low — what's the realistic commute time and amenity access for the typical tenant pool here? Any planned neighborhood developments (good or bad) we should know about?
- What's the average days-on-market for RENTAL listings here right now (not sales)? A rising rental-DOM trend means longer vacancies and softer asking-rent achievability than the comps imply.
- What's the recent tenant-quality profile in this submarket — average credit score on applications, eviction rate, late-payment / NSF rate, and stable-employment percentage? A property-management company in the area should have these aggregated.
- How much new for-sale + rental construction is in the pipeline within 1–3 miles? Heavy new supply typically softens prices + rents 12–24 months out; constrained supply supports both.
Investment metrics
- 1% rule
- 0.80% ✗
- Cap rate
- 6.12%
- Cash-on-cash
- -0.62%
- DSCR
- 0.97
- GRM
- 10.4
CMA / ARV
- ARV (on-the-fly)
- $217,500
- Comps found
- 12
Show comp detail 12 sales within ~0.75 mi
| Address | Dist | Beds/Ba | Sqft | Sold | Price | $/sf | Match |
|---|---|---|---|---|---|---|---|
| 23273 Conifer Dr | 0.00mi | 3/2.0 | 1,450 (0%) | 1mo | $220,000 | $152 | 99 |
| 23324 Conifer Rd | 0.09mi | 3/2.0 | 1,517 (+5%) | 2mo | $215,000 | $142 | 86 |
| 23288 Conifer Dr | 0.04mi | 3/2.0 | 1,557 (+7%) | 1mo | $220,000 | $141 | 86 |
| 23204 Mango Dr | 0.13mi | 3/2.0 | 1,545 (+7%) | 3mo | $225,000 | $146 | 80 |
| 23101 Arcwood Dr | 0.34mi | 3/2.0 | 1,478 (+2%) | 2mo | $203,500 | $138 | 79 |
| 23261 Conifer Dr | 0.02mi | 4/2.0 (+1) | 1,652 (+14%) | 1mo | $239,000 | $145 | 70 |
| 23516 Ryder Dr | 0.66mi | 3/2.0 | 1,424 (-2%) | 1mo | $223,279 | $157 | 66 |
| 14200 Stones Throw Ct | 0.73mi | 3/2.0 | 1,463 (+1%) | 2mo | $220,000 | $150 | 63 |
| 23419 Ruger Dr | 0.63mi | 3/2.0 | 1,551 (+7%) | 2mo | $234,900 | $151 | 57 |
| 13505 Raghorn Ave | 0.73mi | 3/2.0 | 1,394 (-4%) | 4mo | $225,000 | $161 | 56 |
| 23498 Ryder Dr | 0.65mi | 4/2.0 (+1) | 1,532 (+6%) | 1mo | $233,560 | $152 | 54 |
| 23436 Encore Dr | 0.58mi | 3/2.0 | 1,649 (+14%) | 4mo | $245,000 | $149 | 47 |
Match score weights: distance 35% · size 25% · config 20% · recency 20%. Top-matched comps best support the ARV.
Projected returns pro-forma
-3.0% appreciation · 3.83% rent growth · sell at horizon
- IRR
- -16.5%
- Equity multiple
- 0.41×
- Total profit
- $-36,223
- Equity at exit
- $32,803
- IRR
- -6.9%
- Equity multiple
- 0.54×
- Total profit
- $-28,109
- Equity at exit
- $19,022
Cash invested: $61,600 (down + closing). Projections, not guarantees.
Landlord ↔ Tenant lean methodology
- Overall (STATE)
- 90 Strongly Landlord-Friendly
- State Louisiana
- 90 Strongly Landlord-Friendly · R+12
- County
- — inherits STATE
- City
- — inherits STATE
ZIP-level market 70726
- Rents YoY
- 3.8%
- Active inventory
- 985
- Price-to-rent
- 10.4×
Monthly cashflow live
- Estimated rent
- $1,757 high interval (Pro) →
- Mortgage (P&I)
- −$1,154
- Tax from tax record
- −$175 /mo · $2,095/yr
- Insurance
- −$92
- HOA
- −$0
- Vacancy / Maint / Mgmt
- −$369
- Net cashflow
- $-32
Break-even live
Sensitivity live
| Price | -10% $93 | -5% $31 | +0% $-32 | +5% $-94 | +10% $-156 |
|---|---|---|---|---|---|
| Rent | -10% $-171 | -5% $-101 | +0% $-32 | +5% $38 | +10% $107 |
| Rate | -1.0pp $79 | -0.5pp $24 | base $-32 | +0.5pp $-89 | +1.0pp $-147 |
UW: 25.0% down · 7.5% · 30yr · 1.5% tax · 5.0% vac · 8.0% maint · 8.0% mgmt
Financing live
Cash to close
- Down payment
- $55,000
- Closing costs
- $6,600
- Reserves months
- —
- Total cash needed
- —
Loan-product check · same deal, 3 products live
Conventional
25% down · 7.5% · 30yr
- Down + closing
- —
- Monthly P&I
- —
- Monthly cashflow
- —
- DSCR
- —
- Eligible?
- —
Personal DTI + credit; lowest rate.
DSCR
20% down · 8.5% · 30yr
- Down + closing
- —
- Monthly P&I
- —
- Monthly cashflow
- —
- DSCR
- —
- Eligible?
- —
No personal income docs; deal must DSCR.
Hard money
10% down · 12.0% · 12mo
- Down + closing
- —
- Monthly P&I
- —
- Monthly cashflow
- —
- DSCR
- —
- Eligible?
- —
Short-term bridge; refi at stabilization.
Rent comps 6 comps
| Address | Beds | Baths | Sqft | Rent | $/sqft | DOM | Units | Dist |
|---|---|---|---|---|---|---|---|---|
| 13783 Fig Dr Denham Springs, LA | 3.0 | 2.0 | 1613 | $1,900 | $1.18 | 25d | 1 | 0.32mi |
| 23744 Walker South Rd Denham Springs, LA | 3.0 | 2.0 | 1100 | $1,300 | $1.18 | 16d | 1 | 0.46mi |
| 22862 Monterey Ave Dennis Mills, LA | 3.0 | 2.0 | 1618 | $1,875 | $1.16 | 45d | 1 | 0.50mi |
| 22871 Balsam Dr Denham Springs, LA | 4.0 | 2.0 | 1814 | $1,975 | $1.09 | 25d | 1 | 0.60mi |
| 23340 Ruger Dr Denham Springs, LA | 4.0 | 2.0 | 1826 | $1,800 | $0.99 | 25d | 1 | 0.70mi |
| 13419 Hammack Rd Unit A Denham Springs, LA | 2.0 | 2.0 | 1375 | $1,350 | $0.98 | 25d | 1 | 1.10mi |
Listing history 12 events
-
2026-04-15status Pending 547-char remark
Show marketing remark (547 chars)
This one just feels like home. From the moment you walk in, you'll notice the high ceilings and natural flow of the split floor plan. The kitchen opens effortlessly into the living room, making it easy to host gatherings. A fireplace adds the perfect touch of comfort, while the oversized primary suite creates a private escape with a spacious bathroom and walk in closet. Out back, you'll find a large fenced in yard ready for everything from quiet mornings to weekend get togethers. No flood insurance required and the roof was replaced in 2021!
-
2026-04-15status Pending
Show marketing remark (547 chars)
This one just feels like home. From the moment you walk in, you'll notice the high ceilings and natural flow of the split floor plan. The kitchen opens effortlessly into the living room, making it easy to host gatherings. A fireplace adds the perfect touch of comfort, while the oversized primary suite creates a private escape with a spacious bathroom and walk in closet. Out back, you'll find a large fenced in yard ready for everything from quiet mornings to weekend get togethers. No flood insurance required and the roof was replaced in 2021!
-
2026-03-31$220,000 Active 547-char remark
Show marketing remark (547 chars)
This one just feels like home. From the moment you walk in, you'll notice the high ceilings and natural flow of the split floor plan. The kitchen opens effortlessly into the living room, making it easy to host gatherings. A fireplace adds the perfect touch of comfort, while the oversized primary suite creates a private escape with a spacious bathroom and walk in closet. Out back, you'll find a large fenced in yard ready for everything from quiet mornings to weekend get togethers. No flood insurance required and the roof was replaced in 2021!
-
2026-03-31$220,000 Active
Show marketing remark (547 chars)
This one just feels like home. From the moment you walk in, you'll notice the high ceilings and natural flow of the split floor plan. The kitchen opens effortlessly into the living room, making it easy to host gatherings. A fireplace adds the perfect touch of comfort, while the oversized primary suite creates a private escape with a spacious bathroom and walk in closet. Out back, you'll find a large fenced in yard ready for everything from quiet mornings to weekend get togethers. No flood insurance required and the roof was replaced in 2021!
-
2016-12-02soldstatus $167,000
-
2016-11-29soldstatus Sold 120-char remark
Show marketing remark (120 chars)
Home did not flood!! Precious home in Arbor Walk is priced to sell and is move in ready. Call today for an appointment.
-
2016-10-01status Pending 120-char remark
Show marketing remark (120 chars)
Home did not flood!! Precious home in Arbor Walk is priced to sell and is move in ready. Call today for an appointment.
-
2016-09-26price $167,500 120-char remark
Show marketing remark (120 chars)
Home did not flood!! Precious home in Arbor Walk is priced to sell and is move in ready. Call today for an appointment.
-
2016-09-09price $169,900 120-char remark
Show marketing remark (120 chars)
Home did not flood!! Precious home in Arbor Walk is priced to sell and is move in ready. Call today for an appointment.
-
2016-09-02$174,900 Active 120-char remark
Show marketing remark (120 chars)
Home did not flood!! Precious home in Arbor Walk is priced to sell and is move in ready. Call today for an appointment.
-
2016-09-02$167,500
Show marketing remark (120 chars)
Home did not flood!! Precious home in Arbor Walk is priced to sell and is move in ready. Call today for an appointment.
-
2012-06-20$151,900
ⓘ Source: listings_history table (triggers on properties + properties_extension) + one-shot
backfill from property_details.listing_events for pre-trigger history.
Tax reassessment forecast LA · Resets to sale price
- Current annual tax
- $2,095 · $175/mo
- Projected year-2 tax
- $2,095 · $175/mo
- Expected delta
- $0/yr ($0/mo · 0.0%)
ⓘ Screening estimate from a state-policy table — verify with the county assessor before closing.
Climate risk First Street
- Flood 1/10 Low FEMA zone X (unshaded) · 0% chance over 30 yrs
- Wildfire 3/10 Moderate
- Heat 8/10 Severe 7 d/yr ≥108°F today · 22 d/yr by 30 yrs out
- Wind 9/10 Extreme 99% chance of damaging wind over 30 yrs
- Air quality 3/10 Moderate 2 unhealthy d/yr today · 3 by 30 yrs out
Nearby sold comps map
Loading sold comps map…
Walkable amenities ~0.75 mi
Loading nearby amenities…
Taxation est. · year 1
- Rental income
- $21,088
- − Mortgage interest
- −$12,323
- − Property taxes
- −$2,095
- − Insurance
- −$1,100
- − Repairs & maintenance
- −$1,687
- − Management
- −$1,687
- − Depreciation
- −$6,400
- Taxable loss
- −$4,205
- Est. tax savings @ 24.0%
- +$1,009
- After-tax cash flow
- $629/yr
For passive investors: Depreciation is non-cash, so a rental often shows a tax loss while cash-flowing — sheltering income. Rental losses are passive: they offset passive income freely, and up to $25,000/yr can offset ordinary (W-2) income if you actively participate and your MAGI is under $100k (phasing out to $0 by $150k); unused losses carry forward. On sale, claimed depreciation is recaptured at up to 25%, and gains may owe capital-gains tax (a 1031 exchange can defer both). Figures are a year-1 estimate at your 24.0% rate — not tax advice; consult a CPA.
Schools (NCES district)
- District
- Livingston Parish
- NCES district ID
- 2201020
- Math proficiency
- 40% ▼ -38.00%
- Reading proficiency
- 52% ▼ -32.00%
- Median HH income
- $56,755
- Composite
- 40.07/100
- National rank
- #3811
- State rank
- #13 of 98 in LA
Livability — Walker
- Score
- 75/100
- State rank
- #19
- US rank
- #3999
Category grades
Schools grade is shown separately in the Schools card above.
Census & demographics
- County
- Livingston Parish · 87,496 people
- City population
- 23,921
- Metro
- Baton Rouge, LA
- Population (ZIP)
- 63,575
- Household income
- $78,621
- Rent vs Own
- Severe rent burden
- 1211.0
Population outlook (Livingston County) Hauer SSP2
- Today (2025)
- 158,511 people
- By 2030
- 168,241 · +6.1%
- By 2040
- 186,252 · +17.5%
- By 2050
- 201,516 · +27.1%
- By 2075
- 231,217 · +45.9%
- By 2100
- 241,697 · +52.5%
Race, ethnicity, and origin ACS 2023
- Neighborhood character
- Predominantly White (74%)
- Race & ethnicity
- White 74% Black 13% Hispanic / Latino 9% Two or more races 6%
- Hispanic origin (detail)
- Mexican 3%
- Common ancestry
- Lithuanian 9% Serbian 1% Italian 1%
- Foreign-born
- 6% · Canada
- Languages at home
- 91% English-only · Spanish 6% Other Indo-European 1%
Political lean MEDSL · Livingston
- 2024 margin
- Solid R (+68.5) · D 15.1% · R 83.6% · Other 1.3%
- 2008→2024 swing
- +3.4pp toward D · 2008: -71.9pp · 2024: -68.5pp
- All cycles
- 2024: R+68.5 2020: R+70.0 2016: R+72.5 2012: R+70.4 2008: R+71.9
Not yet ingested
- Civics
- —
Market trends
- HPI YoY
- ▼ -104.37%
- Current HPI
- 170.2207
- Rent YoY
- ▲ 3.83%
- Metro
- Baton Rouge, LA
- State GDP YoY
- ▲ 3.29%
- F500 in state
- 10
Industry mix (Fortune 500 HQ in LA)
| Industry | F500 HQs | Revenue |
|---|---|---|
| Telecommunications | 2 | $23B |
|
||
| Utilities | 1 | $12B |
|
||
| Wholesale / Distribution | 1 | $5B |
|
||
| Advertising | 1 | $2B |
|
||
Price history
+44.8% since first listed12 events — show timeline
- 2026-04-15 Pending — AcadianaMLS
- 2026-04-15 Pending — GBRMLS
- 2026-03-31 Listed $220,000 GBRMLS
- 2026-03-31 Listed $220,000 AcadianaMLS
- 2016-12-02 Sold (Public Records) $167,000 Public Records
- 2016-11-29 Sold (MLS) — GBRMLS
- 2016-10-01 Pending — GBRMLS
- 2016-09-26 Price Changed $167,500 GBRMLS
- 2016-09-09 Price Changed $169,900 GBRMLS
- 2016-09-02 Listed $174,900 GBRMLS
- 2016-09-02 Listed $167,500 AcadianaMLS
- 2012-06-20 Listed $151,900 AcadianaMLS
Property tax history
+3.7%/yrLatest (2024): $2,095 · +13.6% YoY. Source: county tax records.
Cash-flow waterfall
monthlySold comps — $/sqft
last 12 mo · ≤1 miLoading sold comps…