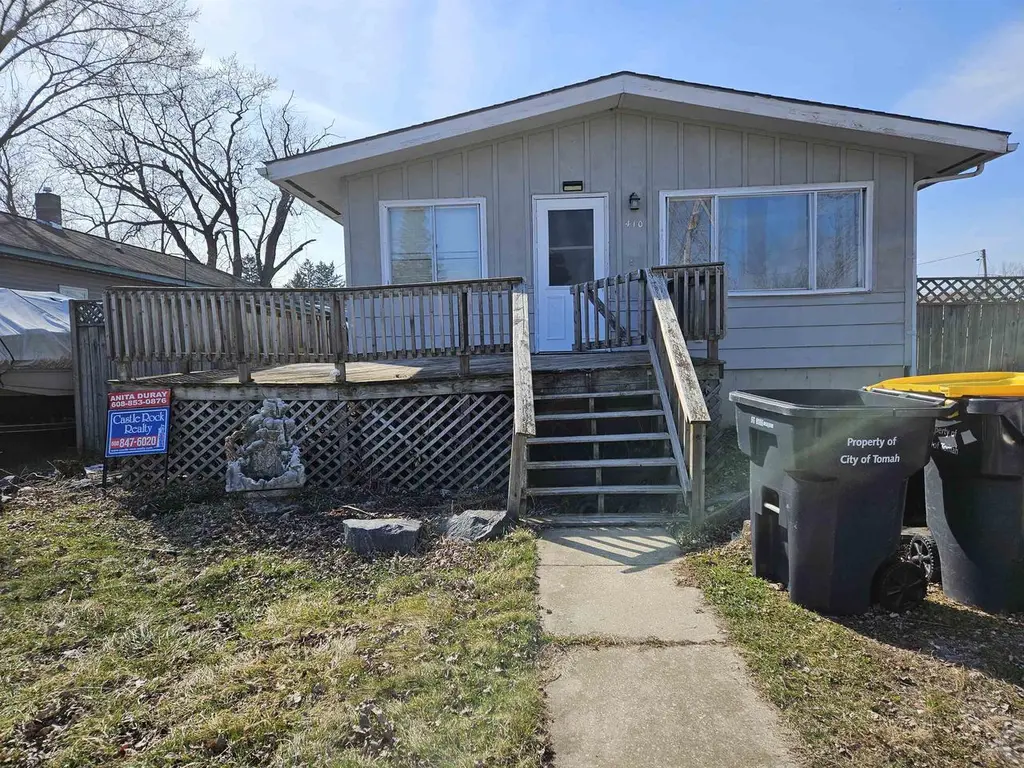
410 N Kilbourn Ave · Tomah, WI
Flood risk 4/10 · Minor
- FEMA flood zone
- X (unshaded)
- Chance of flooding over 30 yrs
- 0.24%
- Est. flood insurance / yr
- $473 – $860
Fire risk 3/10 · Minor
- Est. fire insurance / yr
- $636 – $1,182
Heat risk 2/10 · Minimal
- Hot days now (above 97°F)
- 7 days/yr
- Hot days in 30 yrs
- 14 days/yr
Wind risk 2/10 · Minimal
- Chance of severe wind over 30 yrs
- —
Air-quality risk 1/10 · Minimal
- Unhealthy air days now
- 0 days/yr
- Unhealthy air days in 30 yrs
- 0 days/yr
Risk factors via First Street. Map © Google.
Why this score? — see what drove the C- grade
The composite is a weighted blend of 9 inputs, each scored 0–100. Each bar is that input's sub-score; the figure is the points it added to the 100-point composite (weight × sub-score).
- Cash flow +16.6/30.0
- ARV discount +15.0/15.0
- 1% rule +5.6/10.0
- DSCR +5.2/10.0
- Livability +4.0/5.0
- Rent growth +2.5/5.0
- Condition / age +2.5/5.0
- Schools +2.4/10.0
- Appreciation +0.0/10.0
$129,900
🖨 Deal sheet 📄 Offer letter ✓ Due diligence
Listing remarks MLS
Three-bedroom, 1-bathroom home centrally located in the City of Tomah. Two-car detached garage with alley access and a private fenced-in back yard. Wrap-around deck on half of the house giving access to the front and back yard. Main level bathroom and second bath stubbed-in on the lower level. Potential for lower-level living area to be brought back to its once "splendid" condition.
Key facts
- Wrap-around deck
- Detached garage
- 7,405 sq ft lot
Tags
Neighborhood map
What this means for you Summary
Snapshot
- This is a 3-bed/1.0-bath single-family listed at $130k.
Deal economics
- At list price, monthly cash flow is $79 ($947/yr) — positive.
- The deal already cash-flows at list — no discount required.
- Meets the 1% rule at list price ($1k rent vs $130k).
- Recommended offer: $114k (12.0% below list) — sets the bar for market timing.
- Cap rate 7.0% vs local median 3.6% in Tomah — top-decile yield for the area; either an underpriced asset or a hidden risk that comps aren't pricing in. Stress-test before assuming the spread holds.
Location & tenants
- Location reads 79/100 on livability (#83 in WI, #2,189 nationally) — a middle-class / working-renter tenant base. Strengths: cost of living A+, housing A+, health & safety A+; Watch: schools C-, crime C-, amenities F.
- Tomah Area School District (town): math 27% / reading 28% proficiency, ranked #293 of 342 in WI (top 86%) — low school quality limits family demand, transient renter base, plan for 1-2y turnover.
- Market conditions: 86 active listings in the ZIP; 8 comparable units currently listed for rent nearby; rentals at typical pace (median 15d on market — plan ~3-4 weeks tenant-placement turnaround); 93 units permitted in Monroe County in 2024 (0 in 5+ unit buildings).
Forward outlook
- Local home prices are declining (-3.0%/yr); year-one equity from $898 of loan paydown is wiped out by about $4k of value loss. Plan a longer hold.
- Monroe County population projected to shrink 9% by 2050 — rents likely to lag national; underwrite the cash flow, not the appreciation.
Negotiation context
- It's been on market 149 days — a 12% lower offer ($114k) is reasonable based on typical stale-listing flexibility.
Risks & watch-outs
- Watch-outs: property tax is 2.5% of price.
Questions for the listing agent
- It's been on market 149 days. Have you received any prior offers? Is the seller open to a 12% concession, seller financing, or rate buy-down credit?
- Built in 1973 — when were the roof, HVAC, electrical panel, plumbing, and water heater last replaced?
- Property tax is high relative to price — has the assessment been appealed recently, and will the sale trigger a re-assessment?
- Why hasn't it sold? Are there any deal-killer items the seller is aware of (foundation, flood, title, zoning, code violations)?
- Is there a deadline driving the sale (1031 exchange, divorce, estate, relocation)? That informs how much negotiation room exists.
- What's the average days-on-market for RENTAL listings here right now (not sales)? A rising rental-DOM trend means longer vacancies and softer asking-rent achievability than the comps imply.
- What's the recent tenant-quality profile in this submarket — average credit score on applications, eviction rate, late-payment / NSF rate, and stable-employment percentage? A property-management company in the area should have these aggregated.
- How much new for-sale + rental construction is in the pipeline within 1–3 miles? Heavy new supply typically softens prices + rents 12–24 months out; constrained supply supports both.
Investment metrics
- 1% rule
- 1.06% ✓
- Cap rate
- 7.02%
- Cash-on-cash
- 2.60%
- DSCR
- 1.12
- GRM
- 7.9
CMA / ARV
- ARV (median comp)
- $178,823
- List price
- $129,900
- Delta
- -27.36%
- Verdict
- UNDERPRICED
- Comps
- 20 within 1.0 mi
Show comp detail 12 sales within ~0.75 mi
| Address | Dist | Beds/Ba | Sqft | Sold | Price | $/sf | Match |
|---|---|---|---|---|---|---|---|
| 304 Cady Ave | 0.58mi | 3/1.5 | 1,300 (0%) | 2mo | $239,500 | $184 | 70 |
| 429 Pine St | 0.31mi | 3/1.0 | 1,200 (-8%) | 6mo | $165,000 | $138 | 68 |
| 217 N Glendale Ave | 0.36mi | 3/1.5 | 1,350 (+4%) | 10mo | $215,000 | $159 | 67 |
| 301 N Superior Ave | 0.06mi | 2/1.0 (-1) | 1,130 (-13%) | 6mo | $145,000 | $128 | 65 |
| 425 Pine St | 0.30mi | 3/2.0 | 1,404 (+8%) | 8mo | $210,000 | $150 | 62 |
| 929 Lemonweir Pkwy | 0.55mi | 4/1.0 (+1) | 1,350 (+4%) | 5mo | $179,000 | $133 | 59 |
| 500 Superior Ave | 0.60mi | 3/1.0 | 1,250 (-4%) | 8mo | $162,000 | $130 | 59 |
| 312 Clark St | 0.51mi | 3/2.0 | 1,400 (+8%) | 8mo | $172,000 | $123 | 53 |
| 109 E Saratoga St | 0.74mi | 3/1.5 | 1,300 (0%) | 16mo | $172,000 | $132 | 50 |
| 308 Mclean Ave | 0.50mi | 4/1.5 (+1) | 1,460 (+12%) | 1mo | $230,000 | $158 | 48 |
| 607 W Jackson St | 0.58mi | 3/1.0 | 1,200 (-8%) | 18mo | $225,000 | $188 | 45 |
| 417 W Nott St | 0.58mi | 4/1.5 (+1) | 1,250 (-4%) | 18mo | $200,000 | $160 | 44 |
Match score weights: distance 35% · size 25% · config 20% · recency 20%. Top-matched comps best support the ARV.
Projected returns pro-forma
-3.0% appreciation · 3.0% rent growth · sell at horizon
- IRR
- -12.1%
- Equity multiple
- 0.56×
- Total profit
- $-15,933
- Equity at exit
- $19,369
- IRR
- -2.9%
- Equity multiple
- 0.81×
- Total profit
- $-7,038
- Equity at exit
- $11,231
Cash invested: $36,372 (down + closing). Projections, not guarantees.
Landlord ↔ Tenant lean methodology
- Overall (STATE)
- 73 Landlord-Friendly
- State Wisconsin
- 73 Landlord-Friendly · R+2
- County
- — inherits STATE
- City
- — inherits STATE
ZIP-level market 54660
- Home prices YoY
- -23.5%
- Active inventory
- 86
- Price-to-rent
- 7.9×
Monthly cashflow live
- Estimated rent
- $1,377 high interval (Pro) →
- Mortgage (P&I)
- −$681
- Tax from tax record
- −$274 /mo · $3,285/yr
- Insurance
- −$54
- HOA
- −$0
- Vacancy / Maint / Mgmt
- −$289
- Net cashflow
- $79
Break-even live
UW: 25.0% down · 7.5% · 30yr · 1.5% tax · 5.0% vac · 8.0% maint · 8.0% mgmt
Financing live
Cash to close
- Down payment
- $32,475
- Closing costs
- $3,897
- Reserves months
- —
- Total cash needed
- —
Loan-product check · same deal, 3 products live
Conventional
25% down · 7.5% · 30yr
- Down + closing
- —
- Monthly P&I
- —
- Monthly cashflow
- —
- DSCR
- —
- Eligible?
- —
Personal DTI + credit; lowest rate.
DSCR
20% down · 8.5% · 30yr
- Down + closing
- —
- Monthly P&I
- —
- Monthly cashflow
- —
- DSCR
- —
- Eligible?
- —
No personal income docs; deal must DSCR.
Hard money
10% down · 12.0% · 12mo
- Down + closing
- —
- Monthly P&I
- —
- Monthly cashflow
- —
- DSCR
- —
- Eligible?
- —
Short-term bridge; refi at stabilization.
Rent comps 8 comps
| Address | Beds | Baths | Sqft | Rent | $/sqft | DOM | Units | Dist |
|---|---|---|---|---|---|---|---|---|
| 202 Murdock St Tomah, WI | 2.0–3.0 | 1.0 | 1131 | $1,450 | $1.28 | 14d | 3 | 0.59mi |
| 260 Murdock St Tomah, WI | 3.0 | 1.0 | 1114 | $1,450 | $1.30 | 23d | 1 | 0.60mi |
| 220 Murdock St Tomah, WI | 2.0 | 1.0 | 1096 | $1,200 | $1.09 | 44d | 1 | 0.61mi |
| 1010 Berry Ave Unit 1010 Berry Pointe-112 Tomah, WI | 2.0 | 1.5 | 1044 | $1,400 | $1.34 | 14d | 1 | 0.63mi |
| 1028 Berry Ave Tomah, WI | 2.0 | 1.5 | 1044 | $1,400 | $1.34 | 14d | 2 | 0.64mi |
| 205 E Veterans St Tomah, WI | 2.0 | 1.0 | 950 | $1,300 | $1.37 | 23d | 1 | 0.66mi |
| 209 E Veterans St Tomah, WI | 1.0–2.0 | 1.0 | 825 | $1,300 | $1.58 | 14d | 2 | 0.66mi |
| 834 Evergreen Pass Tomah, WI | 4.0 | 2.5 | 1418 | $1,729 | $1.22 | 14d | 1 | 1.25mi |
Listing history 22 events
-
2026-06-18days on market $129,900 Active 149 DOM
-
2026-06-17days on market $129,900 Active 148 DOM
-
2026-06-16days on market $129,900 Active 147 DOM
-
2026-06-15days on market $129,900 Active 146 DOM
-
2026-06-14days on market $129,900 Active 144 DOM
-
2026-06-10days on market $129,900 Active 141 DOM
-
2026-06-09days on market $129,900 Active 140 DOM
-
2026-06-08days on market $129,900 Active 139 DOM
-
2026-06-07days on market $129,900 Active 138 DOM
-
2026-06-05days on market $129,900 Active 135 DOM
-
2026-06-03days on market $129,900 Active 134 DOM
-
2026-06-02days on market $129,900 Active 133 DOM
-
2026-06-01days on market $129,900 Active 132 DOM
-
2026-05-31days on market $129,900 Active 131 DOM
-
2026-05-31days on market $129,900 Active 130 DOM
-
2026-05-17price $129,900 395-char remark
Show marketing remark (395 chars)
Three-bedroom, 1-bathroom home centrally located in the City of Tomah. Two-car detached garage with alley access and a private fenced-in back yard. Wrap-around deck on half of the house giving access to the front and back yard. Main level bathroom and second bath stubbed-in on the lower level. Potential for lower-level living area to be brought back to its once "splendid" condition.
-
2026-04-12price $139,900 395-char remark
Show marketing remark (395 chars)
Three-bedroom, 1-bathroom home centrally located in the City of Tomah. Two-car detached garage with alley access and a private fenced-in back yard. Wrap-around deck on half of the house giving access to the front and back yard. Main level bathroom and second bath stubbed-in on the lower level. Potential for lower-level living area to be brought back to its once "splendid" condition.
-
2026-01-16$154,900 Active 395-char remark
Show marketing remark (395 chars)
Three-bedroom, 1-bathroom home centrally located in the City of Tomah. Two-car detached garage with alley access and a private fenced-in back yard. Wrap-around deck on half of the house giving access to the front and back yard. Main level bathroom and second bath stubbed-in on the lower level. Potential for lower-level living area to be brought back to its once "splendid" condition.
-
2022-05-18soldstatus $148,000
-
2020-03-02soldstatus $124,500
-
2005-10-05soldstatus $85,000
-
2002-04-29soldstatus $58,000
ⓘ Source: listings_history table (triggers on properties + properties_extension) + one-shot
backfill from property_details.listing_events for pre-trigger history.
Tax reassessment forecast WI · Partial reset (capped growth)
- Current annual tax
- $3,285 · $274/mo
- Projected year-2 tax
- $3,285 · $274/mo
- Expected delta
- $0/yr ($0/mo · 0.0%)
ⓘ Screening estimate from a state-policy table — verify with the county assessor before closing.
Climate risk First Street
- Flood 4/10 Moderate FEMA zone X (unshaded) · 24% chance over 30 yrs
- Wildfire 3/10 Moderate
- Heat 2/10 Low 7 d/yr ≥97°F today · 14 d/yr by 30 yrs out
- Wind 2/10 Low
- Air quality 1/10 Low 0 unhealthy d/yr today · 0 by 30 yrs out
Nearby sold comps map
Loading sold comps map…
Walkable amenities ~0.75 mi
Loading nearby amenities…
Taxation est. · year 1
- Rental income
- $16,527
- − Mortgage interest
- −$7,276
- − Property taxes
- −$3,285
- − Insurance
- −$650
- − Repairs & maintenance
- −$1,322
- − Management
- −$1,322
- − Depreciation
- −$3,779
- Taxable loss
- −$1,107
- Est. tax savings @ 24.0%
- +$266
- After-tax cash flow
- $1,213/yr
For passive investors: Depreciation is non-cash, so a rental often shows a tax loss while cash-flowing — sheltering income. Rental losses are passive: they offset passive income freely, and up to $25,000/yr can offset ordinary (W-2) income if you actively participate and your MAGI is under $100k (phasing out to $0 by $150k); unused losses carry forward. On sale, claimed depreciation is recaptured at up to 25%, and gains may owe capital-gains tax (a 1031 exchange can defer both). Figures are a year-1 estimate at your 24.0% rate — not tax advice; consult a CPA.
Schools (NCES district)
- District
- Tomah Area School District
- NCES district ID
- 5514910
- Math proficiency
- 27% ▼ -4.00%
- Reading proficiency
- 28% ▼ -5.00%
- Median HH income
- $50,063
- Composite
- 24.14/100
- National rank
- #7747
- State rank
- #293 of 342 in WI
Livability — Tomah
- Score
- 79/100
- State rank
- #83
- US rank
- #2189
Category grades
Schools grade is shown separately in the Schools card above.
Census & demographics
- Census place
- Tomah, WI
- County
- Monroe County · 16,124 people
- City population
- 16,124
- Metro
- nan
- Population (ZIP)
- 16,124
- Household income
- $61,186
- Rent vs Own
- Severe rent burden
- 427.0
Population outlook (Monroe County) Hauer SSP2
- Today (2025)
- 45,682 people
- By 2030
- 45,187 · -1.1%
- By 2040
- 43,768 · -4.2%
- By 2050
- 41,596 · -8.9%
- By 2075
- 35,555 · -22.2%
- By 2100
- 28,278 · -38.1%
Race, ethnicity, and origin ACS 2023
- Neighborhood character
- Predominantly White (89%)
- Race & ethnicity
- White 89% Two or more races 5% Hispanic / Latino 4% Black 1% Native American 1%
- Common ancestry
- Portuguese 12% Romanian 3% Lithuanian 2%
- Foreign-born
- 2% · Canada
- Languages at home
- 96% English-only · German/W. Germanic 1% Spanish 1%
Political lean MEDSL · Monroe
- 2024 margin
- Strong R (+26.1) · D 36.3% · R 62.5% · Other 1.2%
- 2008→2024 swing
- -34.1pp toward R · 2008: 8.0pp · 2024: -26.1pp
- All cycles
- 2024: R+26.1 2020: R+23.6 2016: R+22.5 2012: R+0.7 2008: D+8.0
Not yet ingested
- Civics
- —
Market trends
- HPI YoY
- ▼ -64.36%
- Current HPI
- 209.1207
- Rent YoY
- —
- Metro
- nan
- State GDP YoY
- ▲ 2.10%
- F500 in state
- 20
Industry mix (Fortune 500 HQ in WI)
| Industry | F500 HQs | Revenue |
|---|---|---|
| Industrial Machinery | 4 | $23B |
|
||
| Industrial Technology | 2 | $36B |
|
||
| Insurance | 1 | $36B |
|
||
| Professional Services | 1 | $19B |
|
||
| Utilities | 1 | $9B |
|
||
| Consumer Goods | 1 | $3B |
|
||
Price history
+124.0% since first listed7 events — show timeline
- 2026-05-17 Price Changed $129,900 SCWMLS
- 2026-04-12 Price Changed $139,900 SCWMLS
- 2026-01-16 Listed $154,900 SCWMLS
- 2022-05-18 Sold (Public Records) $148,000 Public Records
- 2020-03-02 Sold (Public Records) $124,500 Public Records
- 2005-10-05 Sold (Public Records) $85,000 Public Records
- 2002-04-29 Sold (Public Records) $58,000 Public Records
Property tax history
+3.6%/yrLatest (2025): $3,285 · +16.0% YoY. Source: county tax records.
Cash-flow waterfall
monthlySold comps — $/sqft
last 12 mo · ≤1 miLoading sold comps…