 Fourplex
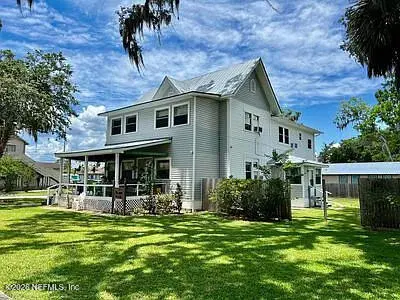
720 Walnut St · Green Cove Springs, FL
Flood risk 1/10 · Minimal
- FEMA flood zone
- X (unshaded)
- Chance of flooding over 30 yrs
- 0.0%
- Est. flood insurance / yr
- $507 – $1,088
Fire risk 5/10 · Moderate
- Est. fire insurance / yr
- $947 – $1,759
Heat risk 9/10 · Severe
- Hot days now (above 107°F)
- 7 days/yr
- Hot days in 30 yrs
- 21 days/yr
Wind risk 10/10 · Severe
- Chance of severe wind over 30 yrs
- 99.0%
Air-quality risk 3/10 · Minor
- Unhealthy air days now
- 3 days/yr
- Unhealthy air days in 30 yrs
- 3 days/yr
Risk factors via First Street. Map © Google.
Why this score? — see what drove the B grade
The composite is a weighted blend of 9 inputs, each scored 0–100. Each bar is that input's sub-score; the figure is the points it added to the 100-point composite (weight × sub-score).
- Cash flow +30.0/30.0
- 1% rule +10.0/10.0
- DSCR +10.0/10.0
- ARV discount +7.5/15.0
- Schools +5.1/10.0
- Livability +3.8/5.0
- Rent growth +2.6/5.0
- Condition / age +2.5/5.0
- Appreciation +0.0/10.0
$429,500
🖨 Deal sheet (PDF) 📄 Offer letter ✓ Due diligence
Multi-family units
County records classify this as Multi-Family (2-4 Unit). Listing-text estimate: 4 units. confirmed
Listing remarks
Historic Quadruplex + CBD Zoning. This is not just a multi-family investment -- it's a platform. CBD zoning unlocks multiple exit and value-add strategies: • Keep as residential multi-family: Stable cash-flowing quadruplex in a high-demand rental corridor , near Spring Park and the St. Johns River. • Convert to professional office or retail: CBD zoning permits commercial pivots -- law, medical, boutique retail, and more. • Mixed-use redevelopment: Ground-floor commercial with residential above -- a true ''missing middle'' asset in the Historic District. • Residential-style financing still available: 4-unit status qualifies for conventional mortgage terms despite commerci
Key facts
- Picnic area
- Cbd zoning
- Off-street parking
Tags
Property features AI
Exterior
- Parking: Off-street parking
- Utilities: Public sewer; Cable available
- Home design: Quadruplex (multi-family); Faces south
- Construction: Vinyl siding; Metal roof
- Exterior features: Historic area; Paved road access
Interior
- Bedrooms: 8 bedrooms
- Flooring: Carpet
- Bathrooms: 4 full bathrooms
- Heating & cooling: Heating provided; Wall/window air conditioning units
- Interior features: Carpet flooring
- Laundry & utility: Washer hookup; Electric dryer hookup
Neighborhood map
What this means for you Summary
Snapshot
- This is a 4 × 2-bed/1.0-bath units multifamily listed at $430k.
Deal economics
- At list price, monthly cash flow is $2k ($27k/yr) — positive. Per door: $563/mo.
- The deal already cash-flows at list — no discount required.
- Meets the 1% rule at list price ($7k rent vs $430k).
- Cap rate 12.6% vs local median 4.2% in Green Cove Springs — top-decile yield for the area; either an underpriced asset or a hidden risk that comps aren't pricing in. Stress-test before assuming the spread holds.
Location & tenants
- Location reads 75/100 on livability (#245 in FL, #3,868 nationally) — a middle-class / working-renter tenant base. Strengths: cost of living A+, housing A+, health & safety A+; Watch: amenities F, commute F.
- Clay (suburban): math 58% / reading 59% proficiency, ranked #14 of 73 in FL (top 19%) — acceptable for families but not a draw, mixed tenant base, ~2y average lease.
- Zoned schools: Charles E. Bennett Elementary School (math 41% / reading 39%, grade F, #1,491 of 2,144 statewide, top 70%, 624 students, 100% FRL); Green Cove Springs Junior High School (math 63% / reading 60%, grade B+, #124 of 571 statewide, top 22%, 799 students, 38% FRL); Clay High School (math 37% / reading 53%, grade D-, #228 of 667 statewide, top 35%, 1,666 students, 43% FRL) — zoned schools average 60% FRL vs 35% district-wide (25 pts higher); higher-poverty schools than district average — tighter screening recommended.
- Market conditions: Rents flat; 885 active listings in the ZIP; solid renter incomes; 1,876 units permitted in Clay County in 2024 (14 in 5+ unit buildings).
- At $6,753/mo this rent would consume 96% of the median local household income ($84k/yr) (locally 449% of renters already pay >50% of income on rent) — very limited rent-growth headroom before tenants either downsize or default.
Forward outlook
- Local home prices are declining (-3.0%/yr); year-one equity from $3k of loan paydown is wiped out by about $13k of value loss. Plan a longer hold.
- Clay County population projected at +19% by 2050 — long-run rental-demand tailwind backs the buy-and-hold thesis.
- At projected returns (-3.0% appreciation + 0.5% rent growth), your $120k cash investment doubles in ~7 years — after that, you're playing with house money.
Negotiation context
- Only 13 days on market — expect competitive offers; lowballing is unlikely to land.
- Current owner paid $330k; 30% above their basis — modest negotiation headroom, anchor on the comps not their cost.
Risks & watch-outs
- Watch-outs: built in 1939 — expect roof / HVAC / electrical / plumbing capex.
- Climate carrying-cost: severe wind risk, 99% chance of damaging wind over 30y; moderate wildfire risk; extreme-heat days projected 7→21/yr by 2055 (HVAC capex compounding) — expect insurance premiums to compound above CPI over the hold.
Questions for the listing agent
- Can we see the unit-by-unit rent roll, current vacancy, and any below-market leases? What's the average tenancy length?
- What capital expenditures (roof, boiler, parking lot, exteriors) have been made in the last 5 years, and what's planned in the next 2?
- Built in 1939 — when were the roof, HVAC, electrical panel, plumbing, and water heater last replaced?
- Is there a deadline driving the sale (1031 exchange, divorce, estate, relocation)? That informs how much negotiation room exists.
- What's the average days-on-market for RENTAL listings here right now (not sales)? A rising rental-DOM trend means longer vacancies and softer asking-rent achievability than the comps imply.
- What's the recent tenant-quality profile in this submarket — average credit score on applications, eviction rate, late-payment / NSF rate, and stable-employment percentage? A property-management company in the area should have these aggregated.
- How much new apartment / multifamily construction is in the pipeline within 1–3 miles? Heavy new supply (>2% of stock underway) typically softens rents 12–24 months out; light construction supports rent growth.
Investment metrics
- 1% rule
- 1.57% ✓
- Cap rate
- 12.58%
- Cash-on-cash
- 22.46%
- DSCR
- 2.00
- GRM
- 5.3
CMA / ARV
No comps found within radius.
Projected returns pro-forma
-3.0% appreciation · 0.46% rent growth · sell at horizon
- IRR
- 12.3%
- Equity multiple
- 1.47×
- Total profit
- $57,083
- Equity at exit
- $64,040
- IRR
- 19.1%
- Equity multiple
- 2.41×
- Total profit
- $169,339
- Equity at exit
- $37,135
Cash invested: $120,260 (down + closing). Projections, not guarantees.
Landlord ↔ Tenant lean methodology
- Overall (STATE)
- 87 Strongly Landlord-Friendly
- State Florida
- 87 Strongly Landlord-Friendly · R+3
- County
- — inherits STATE
- City
- — inherits STATE
ZIP-level market 32043
- Home prices YoY
- -26.3%
- Rents YoY
- 0.5%
- Active inventory
- 885
- Price-to-rent
- 21.2×
Monthly cashflow live
- Estimated rent
- $6,753 high interval (Pro) →
- Mortgage (P&I)
- −$2,252
- Tax from tax record
- −$653 /mo · $7,836/yr
- Insurance
- −$179
- HOA
- −$0
- Vacancy / Maint / Mgmt
- −$1,418
- Net cashflow
- $2,251
Break-even live
Sensitivity live
| Price | -10% $2,494 | -5% $2,372 | +0% $2,251 | +5% $2,129 | +10% $2,007 |
|---|---|---|---|---|---|
| Rent | -10% $1,717 | -5% $1,984 | +0% $2,251 | +5% $2,517 | +10% $2,784 |
| Rate | -1.0pp $2,467 | -0.5pp $2,360 | base $2,251 | +0.5pp $2,139 | +1.0pp $2,026 |
4-unit breakdown (identical units grouped — click to expand)
| Units | Beds | Baths | Est. rent |
|---|---|---|---|
| 4× units | 2 | 1 | $6,752 |
| #1 | 2 | 1 | $1,688 |
| #2 | 2 | 1 | $1,688 |
| #3 | 2 | 1 | $1,688 |
| #4 | 2 | 1 | $1,688 |
| Total (4 units) | $6,753 | ||
UW: 25.0% down · 7.5% · 30yr · 1.5% tax · 5.0% vac · 8.0% maint · 8.0% mgmt
Financing live
Cash to close
- Down payment
- $107,375
- Closing costs
- $12,885
- Reserves months
- —
- Total cash needed
- —
Loan-product check · same deal, 3 products live
Conventional
25% down · 7.5% · 30yr
- Down + closing
- —
- Monthly P&I
- —
- Monthly cashflow
- —
- DSCR
- —
- Eligible?
- —
Personal DTI + credit; lowest rate.
DSCR
20% down · 8.5% · 30yr
- Down + closing
- —
- Monthly P&I
- —
- Monthly cashflow
- —
- DSCR
- —
- Eligible?
- —
No personal income docs; deal must DSCR.
Hard money
10% down · 12.0% · 12mo
- Down + closing
- —
- Monthly P&I
- —
- Monthly cashflow
- —
- DSCR
- —
- Eligible?
- —
Short-term bridge; refi at stabilization.
Listing history 10 events
-
2026-06-18days on market $429,500 Active 13 DOM
-
2026-06-17days on market $429,500 Active 12 DOM
-
2026-06-16days on market $429,500 Active 11 DOM
-
2026-06-15days on market $429,500 Active 10 DOM
-
2026-06-13days on market $429,500 Active 8 DOM
-
2026-06-13days on market $429,500 Active 7 DOM
-
2026-06-09days on market $429,500 Active 4 DOM
-
2026-06-08days on market $429,500 Active 3 DOM
-
2026-06-07remarks 679-char remark
-
2026-06-07$429,500 Active 2 DOM
ⓘ Source: listings_history table (triggers on properties + properties_extension) + one-shot
backfill from property_details.listing_events for pre-trigger history.
Tax reassessment forecast FL · Resets to sale price
- Current annual tax
- $7,836 · $653/mo
- Projected year-2 tax
- $7,836 · $653/mo
- Expected delta
- $0/yr ($0/mo · 0.0%)
ⓘ Screening estimate from a state-policy table — verify with the county assessor before closing.
Climate risk First Street
- Flood 1/10 Low FEMA zone X (unshaded) · 0% chance over 30 yrs
- Wildfire 5/10 Major
- Heat 9/10 Extreme 7 d/yr ≥107°F today · 21 d/yr by 30 yrs out
- Wind 10/10 Extreme 99% chance of damaging wind over 30 yrs
- Air quality 3/10 Moderate 3 unhealthy d/yr today · 3 by 30 yrs out
Nearby sold comps map
Loading sold comps map…
Walkable amenities ~0.75 mi
Loading nearby amenities…
Taxation est. · year 1
- Rental income
- $81,036
- − Mortgage interest
- −$24,059
- − Property taxes
- −$7,836
- − Insurance
- −$2,148
- − Repairs & maintenance
- −$6,483
- − Management
- −$6,483
- − Depreciation
- −$12,495
- Taxable income
- $21,533
- Est. tax owed @ 24.0%
- −$5,168
- After-tax cash flow
- $21,839/yr
For passive investors: Depreciation is non-cash, so a rental often shows a tax loss while cash-flowing — sheltering income. Rental losses are passive: they offset passive income freely, and up to $25,000/yr can offset ordinary (W-2) income if you actively participate and your MAGI is under $100k (phasing out to $0 by $150k); unused losses carry forward. On sale, claimed depreciation is recaptured at up to 25%, and gains may owe capital-gains tax (a 1031 exchange can defer both). Figures are a year-1 estimate at your 24.0% rate — not tax advice; consult a CPA.
Schools (NCES district)
- District
- Clay
- NCES district ID
- 1200300
- Math proficiency
- 58% ▼ -8.00%
- Reading proficiency
- 59% ▼ -3.00%
- Median HH income
- $59,379
- Composite
- 50.73/100
- National rank
- #1815
- State rank
- #14 of 73 in FL
Livability — Green Cove Springs
- Score
- 75/100
- State rank
- #245
- US rank
- #3868
Category grades
Schools grade is shown separately in the Schools card above.
Census & demographics
- Census place
- Green Cove Springs, FL
- County
- Clay County · 208,450 people
- City population
- 34,562
- Metro
- Jacksonville, FL
- Population (ZIP)
- 34,562
- Household income
- $84,145
- Rent vs Own
- Severe rent burden
- 449.0
Population outlook (Clay County) Hauer SSP2
- Today (2025)
- 230,495 people
- By 2030
- 242,427 · +5.2%
- By 2040
- 262,244 · +13.8%
- By 2050
- 275,148 · +19.4%
- By 2075
- 295,397 · +28.2%
- By 2100
- 287,592 · +24.8%
Race, ethnicity, and origin ACS 2023
- Neighborhood character
- Predominantly White (77%)
- Race & ethnicity
- White 77% Black 10% Two or more races 7% Hispanic / Latino 6% Asian 2%
- Hispanic origin (detail)
- Mexican 2% Puerto Rican 1%
- Common ancestry
- Slovak 3% Romanian 2% Lithuanian 2%
- Foreign-born
- 5% · Canada
- Languages at home
- 92% English-only · Spanish 5% French/Haitian/Cajun 1% Other Indo-European 1%
Political lean MEDSL · Clay
- 2024 margin
- Solid R (+39.3) · D 29.9% · R 69.2%
- 2008→2024 swing
- +3.6pp toward D · 2008: -42.8pp · 2024: -39.3pp
- All cycles
- 2024: R+39.3 2020: R+37.1 2016: R+44.3 2012: R+45.8 2008: R+42.8
Not yet ingested
- Civics
- —
Market trends
- HPI YoY
- ▼ -107.34%
- Current HPI
- 301.3212
- Rent YoY
- ▲ 0.46%
- Metro
- Jacksonville, FL
- State GDP YoY
- ▲ 3.28%
- F500 in state
- 36
Industry mix (Fortune 500 HQ in FL)
| Industry | F500 HQs | Revenue |
|---|---|---|
| Industrial Technology | 2 | $29B |
|
||
| Insurance | 2 | $17B |
|
||
| Retail | 1 | $60B |
|
||
| Technology Distribution | 1 | $58B |
|
||
| Homebuilding | 1 | $35B |
|
||
| Technology Manufacturing | 1 | $35B |
|
||
Price history
+529.8% since first listed5 events — show timeline
- 2026-06-05 Listed $429,500 realMLS
- 2022-02-03 Price Changed $1,000 RENT.
- 2022-01-11 Sold (Public Records) $330,000 Public Records
- 1991-07-05 Sold (Public Records) $65,000 Public Records
- 1990-05-24 Sold (Public Records) $68,200 Public Records
Property tax history
+16.3%/yrLatest (2025): $7,836 · -6.7% YoY. Source: county tax records.
Cash-flow waterfall
monthlySold comps — $/sqft
last 12 mo · ≤1 miLoading sold comps…