 Triplex
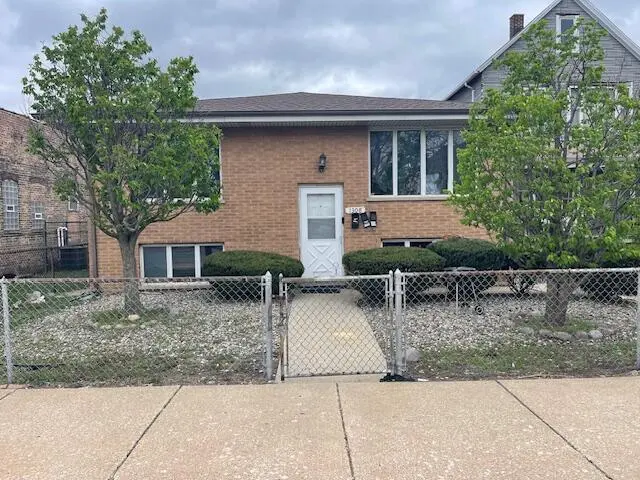
1308 W 150th St · East Chicago, IN
Flood risk 4/10 · Minor
- FEMA flood zone
- X (unshaded)
- Chance of flooding over 30 yrs
- 0.22%
- Est. flood insurance / yr
- $473 – $860
Fire risk 1/10 · Minimal
- Est. fire insurance / yr
- $717 – $1,331
Heat risk 3/10 · Minor
- Hot days now (above 101°F)
- 7 days/yr
- Hot days in 30 yrs
- 15 days/yr
Wind risk 2/10 · Minimal
- Chance of severe wind over 30 yrs
- 1.0%
Air-quality risk 4/10 · Minor
- Unhealthy air days now
- 5 days/yr
- Unhealthy air days in 30 yrs
- 6 days/yr
Risk factors via First Street. Map © Google.
Why this score? — see what drove the B grade
The composite is a weighted blend of 9 inputs, each scored 0–100. Each bar is that input's sub-score; the figure is the points it added to the 100-point composite (weight × sub-score).
- Cash flow +29.5/30.0
- DSCR +10.0/10.0
- 1% rule +8.1/10.0
- ARV discount +7.5/15.0
- Appreciation +4.8/10.0
- Rent growth +4.5/5.0
- Livability +3.2/5.0
- Condition / age +2.5/5.0
- Schools +0.8/10.0
$239,000
🖨 Deal sheet 📄 Offer letter ✓ Due diligence
Multi-family units
County records classify this as Multi-Family (5+ Unit). Listing-text estimate: 3 units. estimate disagrees with records
5+ unit building — per-unit beds/baths from public records are typically unavailable; the breakdown below (if shown) is an estimate from the listing text.
Listing remarks
Calling all investors. Well kept and updated, all brick 3 unit apartment building. Each unit has it's own forced air furnace and water heater. Upper units also have central air. Separate gas and electric, owner pays water. Large laundry and storage on lower level. Tenants are on yearly leases. Come see your new investment today.
Key facts
- Large laundry
- Water heater
- Forced air furnace
Tags
Neighborhood map
What this means for you Summary
Snapshot
- This is a 3 × 2-bed/1.0-bath units multifamily listed at $239k.
Deal economics
- At list price, monthly cash flow is $854 ($10k/yr) — positive. Per door: $285/mo.
- The deal already cash-flows at list — no discount required.
- Meets the 1% rule at list price ($3k rent vs $239k).
- Cap rate 10.6% vs local median 8.2% in East Chicago — meaningfully above typical; check what's discounted (condition, days-on-market, listing class) to confirm the premium yield is real.
Location & tenants
- Location reads 64/100 on livability (#371 in IN) — a middle-class / working-renter tenant base. Strengths: commute A+, cost of living A+, housing A; Watch: health & safety D+, schools F, crime F.
- School City Of East Chicago (suburban): math 7% / reading 15% proficiency, ranked #293 of 301 in IN (top 97%) — low school quality limits family demand, transient renter base, plan for 1-2y turnover; 89% free/reduced lunch — lower-income household profile, screen leases tightly.
- Market conditions: Rents rising fast (+8.1%/yr); 79 active listings in the ZIP; lower-income renter base — watch delinquency; 1,642 units permitted in Lake County in 2024 (14 in 5+ unit buildings).
- At $3,119/mo this rent would consume 89% of the median local household income ($42k/yr) (locally 1227% of renters already pay >50% of income on rent) — very limited rent-growth headroom before tenants either downsize or default.
Forward outlook
- In year one you build about $927 of equity ($2k loan paydown + $-725 appreciation (-0.3% local appreciation)).
- Lake County population projected to shrink 7% by 2050 — rents likely to lag national; underwrite the cash flow, not the appreciation.
- At projected returns (-0.3% appreciation + 8.0% rent growth), your $67k cash investment doubles in ~5 years — after that, you're playing with house money.
Negotiation context
- Only 4 days on market — expect competitive offers; lowballing is unlikely to land.
Questions for the listing agent
- Can we see the unit-by-unit rent roll, current vacancy, and any below-market leases? What's the average tenancy length?
- What capital expenditures (roof, boiler, parking lot, exteriors) have been made in the last 5 years, and what's planned in the next 2?
- Built in 1975 — when were the roof, HVAC, electrical panel, plumbing, and water heater last replaced?
- Is there a deadline driving the sale (1031 exchange, divorce, estate, relocation)? That informs how much negotiation room exists.
- Schools are F-rated, which usually means shorter tenancies and higher turnover. Who's the typical renter profile here, and what's been the actual vacancy rate?
- Crime grade is F in this area — have there been break-ins, vandalism, or insurance claims at this property in the last 3 years? What carrier currently insures it and at what premium?
- What's the average days-on-market for RENTAL listings here right now (not sales)? A rising rental-DOM trend means longer vacancies and softer asking-rent achievability than the comps imply.
- What's the recent tenant-quality profile in this submarket — average credit score on applications, eviction rate, late-payment / NSF rate, and stable-employment percentage? A property-management company in the area should have these aggregated.
- How much new apartment / multifamily construction is in the pipeline within 1–3 miles? Heavy new supply (>2% of stock underway) typically softens rents 12–24 months out; light construction supports rent growth.
Investment metrics
- 1% rule
- 1.31% ✓
- Cap rate
- 10.58%
- Cash-on-cash
- 15.31%
- DSCR
- 1.68
- GRM
- 6.4
CMA / ARV
No comps found within radius.
Projected returns pro-forma
-0.3% appreciation · 8.0% rent growth · sell at horizon
- IRR
- 18.2%
- Equity multiple
- 1.90×
- Total profit
- $60,490
- Equity at exit
- $65,793
- IRR
- 26.1%
- Equity multiple
- 4.37×
- Total profit
- $225,367
- Equity at exit
- $76,265
Cash invested: $66,920 (down + closing). Projections, not guarantees.
Landlord ↔ Tenant lean methodology
- Overall (STATE)
- 90 Strongly Landlord-Friendly
- State Indiana
- 90 Strongly Landlord-Friendly · R+11
- County
- — inherits STATE
- City
- — inherits STATE
ZIP-level market 46312
- Home prices YoY
- -0.1%
- Rents YoY
- 8.1%
- Active inventory
- 79
- Price-to-rent
- 19.2×
Monthly cashflow live
- Estimated rent
- $3,119 medium interval (Pro) →
- Mortgage (P&I)
- −$1,253
- Tax from tax record
- −$258 /mo · $3,090/yr
- Insurance
- −$100
- HOA
- −$0
- Vacancy / Maint / Mgmt
- −$655
- Net cashflow
- $854
Break-even live
3-unit breakdown (identical units grouped — click to expand)
| Units | Beds | Baths | Est. rent |
|---|---|---|---|
| 3× units | 2 | 1 | $3,120 |
| #1 | 2 | 1 | $1,040 |
| #2 | 2 | 1 | $1,040 |
| #3 | 2 | 1 | $1,040 |
| Total (3 units) | $3,119 | ||
UW: 25.0% down · 7.5% · 30yr · 1.5% tax · 5.0% vac · 8.0% maint · 8.0% mgmt
Financing live
Cash to close
- Down payment
- $59,750
- Closing costs
- $7,170
- Reserves months
- —
- Total cash needed
- —
Loan-product check · same deal, 3 products live
Conventional
25% down · 7.5% · 30yr
- Down + closing
- —
- Monthly P&I
- —
- Monthly cashflow
- —
- DSCR
- —
- Eligible?
- —
Personal DTI + credit; lowest rate.
DSCR
20% down · 8.5% · 30yr
- Down + closing
- —
- Monthly P&I
- —
- Monthly cashflow
- —
- DSCR
- —
- Eligible?
- —
No personal income docs; deal must DSCR.
Hard money
10% down · 12.0% · 12mo
- Down + closing
- —
- Monthly P&I
- —
- Monthly cashflow
- —
- DSCR
- —
- Eligible?
- —
Short-term bridge; refi at stabilization.
Listing history 2 events
-
2026-04-17status Pending
-
2026-04-11$239,000 Active
ⓘ Source: listings_history table (triggers on properties + properties_extension) + one-shot
backfill from property_details.listing_events for pre-trigger history.
Tax reassessment forecast IN · Partial reset (capped growth)
- Current annual tax
- $3,090 · $258/mo
- Projected year-2 tax
- $3,090 · $258/mo
- Expected delta
- $0/yr ($0/mo · 0.0%)
ⓘ Screening estimate from a state-policy table — verify with the county assessor before closing.
Climate risk First Street
- Flood 4/10 Moderate FEMA zone X (unshaded) · 22% chance over 30 yrs
- Wildfire 1/10 Low
- Heat 3/10 Moderate 7 d/yr ≥101°F today · 15 d/yr by 30 yrs out
- Wind 2/10 Low 100% chance of damaging wind over 30 yrs
- Air quality 4/10 Moderate 5 unhealthy d/yr today · 6 by 30 yrs out
Nearby sold comps map
Loading sold comps map…
Walkable amenities ~0.75 mi
Loading nearby amenities…
Taxation est. · year 1
- Rental income
- $37,428
- − Mortgage interest
- −$13,388
- − Property taxes
- −$3,090
- − Insurance
- −$1,195
- − Repairs & maintenance
- −$2,994
- − Management
- −$2,994
- − Depreciation
- −$6,953
- Taxable income
- $6,814
- Est. tax owed @ 24.0%
- −$1,635
- After-tax cash flow
- $8,608/yr
For passive investors: Depreciation is non-cash, so a rental often shows a tax loss while cash-flowing — sheltering income. Rental losses are passive: they offset passive income freely, and up to $25,000/yr can offset ordinary (W-2) income if you actively participate and your MAGI is under $100k (phasing out to $0 by $150k); unused losses carry forward. On sale, claimed depreciation is recaptured at up to 25%, and gains may owe capital-gains tax (a 1031 exchange can defer both). Figures are a year-1 estimate at your 24.0% rate — not tax advice; consult a CPA.
Schools (NCES district)
- District
- School City Of East Chicago
- NCES district ID
- 1802880
- Math proficiency
- 7% ▼ -10.00%
- Reading proficiency
- 15% ▼ -7.00%
- Median HH income
- $28,423
- Composite
- 8.36/100
- National rank
- #9909
- State rank
- #293 of 301 in IN
Livability — East Chicago
- Score
- 64/100
- State rank
- #371
- US rank
- #13869
Category grades
Schools grade is shown separately in the Schools card above.
Census & demographics
- Census place
- East Chicago, IN
- County
- Lake County · 422,878 people
- City population
- 26,022
- Metro
- Chicago-Naperville-Elgin, IL-IN-WI
- Population (ZIP)
- 26,022
- Household income
- $42,125
- Rent vs Own
- Severe rent burden
- 1227.0
Population outlook (Lake County) Hauer SSP2
- Today (2025)
- 484,026 people
- By 2030
- 478,091 · -1.2%
- By 2040
- 462,974 · -4.3%
- By 2050
- 449,894 · -7.1%
- By 2075
- 436,169 · -9.9%
- By 2100
- 426,607 · -11.9%
Race, ethnicity, and origin ACS 2023
- Neighborhood character
- Majority Hispanic (56%)
- Race & ethnicity
- Hispanic / Latino 56% Black 36% Two or more races 11% White 7%
- Hispanic origin (detail)
- Mexican 45% Puerto Rican 6%
- Common ancestry
- Romanian 2%
- Foreign-born
- 16% · Canada
- Languages at home
- 59% English-only · Spanish 40%
Political lean MEDSL · Lake
- 2024 margin
- Lean D (+5.6) · D 52.1% · R 46.5% · Other 1.5%
- 2008→2024 swing
- -28.6pp toward R · 2008: 34.3pp · 2024: 5.6pp
- All cycles
- 2024: D+5.6 2020: D+15.1 2016: D+20.6 2012: D+31.0 2008: D+34.3
Not yet ingested
- Civics
- —
Market trends
- HPI YoY
- ▼ -0.30%
- Current HPI
- 267.9232
- Rent YoY
- ▲ 8.06%
- Metro
- Chicago-Naperville-Elgin, IL-IN-WI
- State GDP YoY
- ▲ 2.90%
- F500 in state
- 18
Industry mix (Fortune 500 HQ in IN)
| Industry | F500 HQs | Revenue |
|---|---|---|
| Industrial Machinery | 2 | $37B |
|
||
| Healthcare | 1 | $177B |
|
||
| Pharmaceuticals | 1 | $45B |
|
||
| Metals / Steel | 1 | $18B |
|
||
| Agriculture | 1 | $17B |
|
||
| Packaging | 1 | $12B |
|
||
Price history
2 events — show timeline
- 2026-04-17 Pending — NIRA MLS as Distributed by MLS Grid
- 2026-04-11 Listed $239,000 NIRA MLS as Distributed by MLS Grid
Property tax history
-3.5%/yrLatest (2024): $3,090 · +10.4% YoY. Source: county tax records.
Cash-flow waterfall
monthlySold comps — $/sqft
last 12 mo · ≤1 miLoading sold comps…