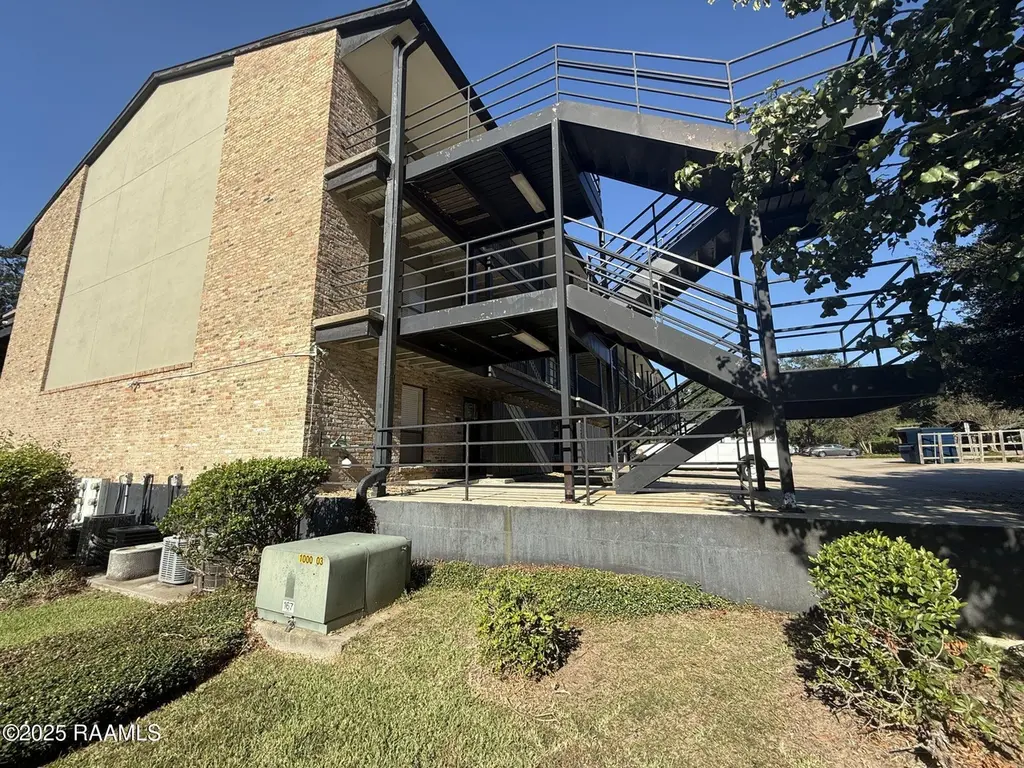
701 S College Rd #109 · Lafayette, LA
Flood risk No data
- FEMA flood zone
- —
- Chance of flooding over 30 yrs
- —
- Est. flood insurance / yr
- —
Fire risk No data
- Est. fire insurance / yr
- —
Heat risk No data
- Hot days now (above threshold)
- —
- Hot days in 30 yrs
- —
Wind risk No data
- Chance of severe wind over 30 yrs
- —
Air-quality risk No data
- Unhealthy air days now
- —
- Unhealthy air days in 30 yrs
- —
Risk factors via First Street. Map © Google.
Why this score? — see what drove the D grade
The composite is a weighted blend of 9 inputs, each scored 0–100. Each bar is that input's sub-score; the figure is the points it added to the 100-point composite (weight × sub-score).
- Cash flow +12.1/30.0
- ARV discount +10.5/15.0
- 1% rule +6.1/10.0
- DSCR +3.6/10.0
- Schools +3.6/10.0
- Livability +3.5/5.0
- Rent growth +2.6/5.0
- Condition / age +2.5/5.0
- Appreciation +0.0/10.0
$82,500
🖨 Deal sheet (PDF) 📄 Offer letter ✓ Due diligence
Listing remarks MLS
Check out this fantastic One Bed / One Bath ground floor corner unit. It offers quick access to hospitals, schools, shopping and more. The unit has had some updates over the last few years, like flooring, electrical, cabinetry, appliances, HVAC, and more. AND, is being sold with all of the appliances. Just move in your furniture and you're set. The unit also has a strong rental history if you're looking for an investment opportunity. Schedule your showing today before it's gone. Some photos have been AI staged for illustration purposes only. Furnishings not provided as part of sale.
Key facts
- Parking
- Built 1982
- Listed 233 days
Tags
Neighborhood map
What this means for you Summary
Snapshot
- This is a 1-bed/1.0-bath townhouse listed at $82k.
Deal economics
- At list price, monthly cash flow is $-19 ($-226/yr) — negative.
- To cash-flow at today's rent, offer at most $79k (4.0% below list).
- Meets the 1% rule at list price ($917 rent vs $82k).
- Recommended offer: $73k (12.0% below list) — sets the bar for market timing.
- Cap rate 6.0% vs local median 4.7% in Lafayette — meaningfully above typical; check what's discounted (condition, days-on-market, listing class) to confirm the premium yield is real.
Location & tenants
- Location reads 70/100 on livability (#63 in LA) — a middle-class / working-renter tenant base. Strengths: cost of living A+, housing A+, health & safety A+; Watch: amenities C-, employment C-, crime F.
- Lafayette Parish (urban): math 38% / reading 46% proficiency, ranked #19 of 98 in LA (top 19%) — families likely to look elsewhere, expect single-tenant / working-renter base with shorter leases.
- Zoned schools: J. Wallace James Elementary School (math 46% / reading 49%, grade D, #147 of 646 statewide, top 23%, 939 students, 64% FRL); L.J. Alleman Middle School (math 48% / reading 56%, grade C+, #23 of 218 statewide, top 10%, 952 students, 54% FRL); Lafayette High School (math 57% / reading 51%, grade C-, #28 of 265 statewide, top 11%, 1,852 students, 52% FRL) — zoned schools at 57% FRL track the district average.
- Market conditions: Rents flat; 237 active listings in the ZIP; 14 comparable units currently listed for rent nearby; rentals at typical pace (median 23d on market — plan ~3-4 weeks tenant-placement turnaround); solid renter incomes; 1,585 units permitted in Lafayette Parish in 2024 (10 in 5+ unit buildings).
- This rent is only 12% of the median local income ($95k/yr) — well below the 30% rent-burden line; pricing power to push rent on renewal without tenant pushback.
Forward outlook
- Local home prices are declining (-3.0%/yr); year-one equity from $570 of loan paydown is wiped out by about $2k of value loss. Plan a longer hold.
- Lafayette County population projected at +34% by 2050 — long-run rental-demand tailwind backs the buy-and-hold thesis.
Negotiation context
- It's been on market 233 days — a 12% lower offer ($73k) is reasonable based on typical stale-listing flexibility.
- 6 sale attempts since 26y ago with the ask held roughly flat each time — persistent listings suggest the price (not the market) is what's stuck; bring a comps-based counter.
- Current owner paid $54k; list at $82k implies a 54% gain — meaningful room to come down on a strong offer.
Risks & watch-outs
- Watch-outs: HOA is 24% of rent.
Questions for the listing agent
- What do current leases actually rent for vs. the listed asking? Can we see a recent rent roll and the last 12 months of T-12 income?
- It's been on market 233 days. Have you received any prior offers? Is the seller open to a 12% concession, seller financing, or rate buy-down credit?
- What does the HOA fee cover, when was the last increase, and are there any pending special assessments or reserve-fund shortfalls?
- Why hasn't it sold? Are there any deal-killer items the seller is aware of (foundation, flood, title, zoning, code violations)?
- Is there a deadline driving the sale (1031 exchange, divorce, estate, relocation)? That informs how much negotiation room exists.
- Schools are B-rated — typically a magnet for longer-tenancy family renters. What's the average tenant stay here, and is there a school-zone premium baked into asking?
- Crime grade is F in this area — have there been break-ins, vandalism, or insurance claims at this property in the last 3 years? What carrier currently insures it and at what premium?
- The area grade is low — what's the realistic commute time and amenity access for the typical tenant pool here? Any planned neighborhood developments (good or bad) we should know about?
- What's the average days-on-market for RENTAL listings here right now (not sales)? A rising rental-DOM trend means longer vacancies and softer asking-rent achievability than the comps imply.
- What's the recent tenant-quality profile in this submarket — average credit score on applications, eviction rate, late-payment / NSF rate, and stable-employment percentage? A property-management company in the area should have these aggregated.
- How much new for-sale + rental construction is in the pipeline within 1–3 miles? Heavy new supply typically softens prices + rents 12–24 months out; constrained supply supports both.
Investment metrics
- 1% rule
- 1.11% ✓
- Cap rate
- 6.02%
- Cash-on-cash
- -0.98%
- DSCR
- 0.96
- GRM
- 7.5
CMA / ARV
- ARV (median comp)
- $88,406
- List price
- $82,500
- Delta
- -6.68%
- Verdict
- FAIR
- Comps
- 20 within 1.0 mi
Show comp detail 1 sale within ~0.75 mi
| Address | Dist | Beds/Ba | Sqft | Sold | Price | $/sf | Match |
|---|---|---|---|---|---|---|---|
| 3121 Johnston St #238 | 0.75mi | 1/1.0 | 618 (-5%) | 11mo | $85,000 | $138 | 48 |
Match score weights: distance 35% · size 25% · config 20% · recency 20%. Top-matched comps best support the ARV.
Projected returns pro-forma
-3.0% appreciation · 0.36% rent growth · sell at horizon
- IRR
- -21.7%
- Equity multiple
- 0.27×
- Total profit
- $-16,820
- Equity at exit
- $12,301
- IRR
- -26.9%
- Equity multiple
- -0.08×
- Total profit
- $-24,939
- Equity at exit
- $7,133
Cash invested: $23,100 (down + closing). Projections, not guarantees.
Landlord ↔ Tenant lean methodology
- Overall (STATE)
- 90 Strongly Landlord-Friendly
- State Louisiana
- 90 Strongly Landlord-Friendly · R+12
- County
- — inherits STATE
- City
- — inherits STATE
ZIP-level market 70503
- Home prices YoY
- -34.0%
- Rents YoY
- 0.4%
- Active inventory
- 237
- Price-to-rent
- 7.5×
Monthly cashflow live
- Estimated rent
- $917 high interval (Pro) →
- Mortgage (P&I)
- −$433
- Tax from tax record
- −$52 /mo · $627/yr
- Insurance
- −$34
- HOA
- −$224
- Vacancy / Maint / Mgmt
- −$193
- Net cashflow
- $-19
Break-even live
Sensitivity live
| Price | -10% $28 | -5% $5 | +0% $-19 | +5% $-42 | +10% $-66 |
|---|---|---|---|---|---|
| Rent | -10% $-91 | -5% $-55 | +0% $-19 | +5% $17 | +10% $54 |
| Rate | -1.0pp $23 | -0.5pp $2 | base $-19 | +0.5pp $-40 | +1.0pp $-62 |
UW: 25.0% down · 7.5% · 30yr · 1.5% tax · 5.0% vac · 8.0% maint · 8.0% mgmt
Financing live
Cash to close
- Down payment
- $20,625
- Closing costs
- $2,475
- Reserves months
- —
- Total cash needed
- —
Loan-product check · same deal, 3 products live
Conventional
25% down · 7.5% · 30yr
- Down + closing
- —
- Monthly P&I
- —
- Monthly cashflow
- —
- DSCR
- —
- Eligible?
- —
Personal DTI + credit; lowest rate.
DSCR
20% down · 8.5% · 30yr
- Down + closing
- —
- Monthly P&I
- —
- Monthly cashflow
- —
- DSCR
- —
- Eligible?
- —
No personal income docs; deal must DSCR.
Hard money
10% down · 12.0% · 12mo
- Down + closing
- —
- Monthly P&I
- —
- Monthly cashflow
- —
- DSCR
- —
- Eligible?
- —
Short-term bridge; refi at stabilization.
Rent comps 14 comps
| Address | Beds | Baths | Sqft | Rent | $/sqft | DOM | Units | Dist |
|---|---|---|---|---|---|---|---|---|
| 915 S College Rd Lafayette, LA | 1.0–2.0 | 1.0 | 659 | $757 | $1.15 | 15d | 5 | 0.22mi |
| 112 Hillside Dr #26 Lafayette, LA | 1.0 | 1.0 | 741 | $995 | $1.34 | 45d | 1 | 0.37mi |
| 106 Seville Blvd Unit B Lafayette, LA | 1.0 | 1.0 | 584 | $850 | $1.46 | 45d | 1 | 0.75mi |
| 131 1/2 Mildred St Unit C Lafayette, LA | 1.0 | 1.0 | 500 | $625 | $1.25 | 15d | 1 | 0.89mi |
| 715 Harding St Unit 5 Lafayette, LA | 1.0 | 1.0 | 500 | $725 | $1.45 | 45d | 1 | 1.19mi |
| 1318 Lee Ave Unit B6 Lafayette, LA | 1.0 | 1.0 | 400 | $750 | $1.88 | 23d | 1 | 1.23mi |
| 1318 Lee Ave Unit C7 Lafayette, LA | 1.0 | 1.0 | 450 | $1,150 | $2.56 | 15d | 1 | 1.23mi |
| 600 E University Ave #7 Lafayette, LA | 1.0 | 1.0 | 600 | $995 | $1.66 | 45d | 1 | 1.28mi |
| 101 Westwood Dr Lafayette, LA | 1.0 | 1.0 | 651 | $1,036 | $1.59 | 15d | 3 | 1.33mi |
| 305 General Mouton Ave Unit B Lafayette, LA | 2.0 | 1.0 | 750 | $1,250 | $1.67 | 15d | 1 | 1.38mi |
| 327 General Mouton Ave Lafayette, LA | 1.0 | 1.0 | 580 | $800 | $1.38 | 45d | 1 | 1.39mi |
| 305 Ella St Unit 3 Lafayette, LA | 1.0 | 1.5 | 515 | $995 | $1.93 | 15d | 1 | 1.43mi |
| 328 1/2 Theodora Blvd Lafayette, LA | 1.0 | 1.0 | 440 | $1,100 | $2.50 | 15d | 1 | 1.46mi |
| 328 Theodora Blvd Unit 1/2 Lafayette, LA | 1.0 | 1.0 | 440 | $1,100 | $2.50 | 23d | 1 | 1.46mi |
HOA detail
- Monthly dues
- $224 · $2,688/yr
- Likely covers
- electric
Listing history 29 events
-
2026-06-21days on market $82,500 Active 233 DOM
-
2026-06-18days on market $82,500 Active 230 DOM
-
2026-06-17days on market $82,500 Active 229 DOM
-
2026-06-16days on market $82,500 Active 228 DOM
-
2026-06-15days on market $82,500 Active 227 DOM
-
2026-06-14days on market $82,500 Active 225 DOM
-
2026-06-13days on market $82,500 Active 224 DOM
-
2026-06-10days on market $82,500 Active 222 DOM
-
2026-06-09days on market $82,500 Active 221 DOM
-
2026-06-08days on market $82,500 Active 220 DOM
-
2026-06-07days on market $82,500 Active 219 DOM
-
2026-06-05days on market $82,500 Active 216 DOM
-
2026-06-03days on market $82,500 Active 215 DOM
-
2026-06-02days on market $82,500 Active 214 DOM
-
2026-06-01days on market $82,500 Active 213 DOM
-
2026-05-31days on market $82,500 Active 212 DOM
-
2026-05-30days on market $82,500 Active 211 DOM
-
2026-04-14price $82,500 589-char remark
Show marketing remark (589 chars)
Check out this fantastic One Bed / One Bath ground floor corner unit. It offers quick access to hospitals, schools, shopping and more. The unit has had some updates over the last few years, like flooring, electrical, cabinetry, appliances, HVAC, and more. AND, is being sold with all of the appliances. Just move in your furniture and you're set. The unit also has a strong rental history if you're looking for an investment opportunity. Schedule your showing today before it's gone. Some photos have been AI staged for illustration purposes only. Furnishings not provided as part of sale.
-
2025-11-18status Active 589-char remark
Show marketing remark (589 chars)
Check out this fantastic One Bed / One Bath ground floor corner unit. It offers quick access to hospitals, schools, shopping and more. The unit has had some updates over the last few years, like flooring, electrical, cabinetry, appliances, HVAC, and more. AND, is being sold with all of the appliances. Just move in your furniture and you're set. The unit also has a strong rental history if you're looking for an investment opportunity. Schedule your showing today before it's gone. Some photos have been AI staged for illustration purposes only. Furnishings not provided as part of sale.
-
2025-11-10status Pending 589-char remark
Show marketing remark (589 chars)
Check out this fantastic One Bed / One Bath ground floor corner unit. It offers quick access to hospitals, schools, shopping and more. The unit has had some updates over the last few years, like flooring, electrical, cabinetry, appliances, HVAC, and more. AND, is being sold with all of the appliances. Just move in your furniture and you're set. The unit also has a strong rental history if you're looking for an investment opportunity. Schedule your showing today before it's gone. Some photos have been AI staged for illustration purposes only. Furnishings not provided as part of sale.
-
2025-10-14$85,000 Active 589-char remark
Show marketing remark (589 chars)
Check out this fantastic One Bed / One Bath ground floor corner unit. It offers quick access to hospitals, schools, shopping and more. The unit has had some updates over the last few years, like flooring, electrical, cabinetry, appliances, HVAC, and more. AND, is being sold with all of the appliances. Just move in your furniture and you're set. The unit also has a strong rental history if you're looking for an investment opportunity. Schedule your showing today before it's gone. Some photos have been AI staged for illustration purposes only. Furnishings not provided as part of sale.
-
2013-11-22$78,000
-
2010-06-10soldstatus $53,700
-
2010-06-10soldstatus $53,700
-
2009-10-15$65,000
-
2005-08-30soldstatus $50,000
-
2005-01-28$52,500
-
2000-06-29soldstatus $39,900
-
2000-05-19$39,900
ⓘ Source: listings_history table (triggers on properties + properties_extension) + one-shot
backfill from property_details.listing_events for pre-trigger history.
Tax reassessment forecast LA · Resets to sale price
- Current annual tax
- $627 · $52/mo
- Projected year-2 tax
- $627 · $52/mo
- Expected delta
- $0/yr ($0/mo · 0.0%)
ⓘ Screening estimate from a state-policy table — verify with the county assessor before closing.
Nearby sold comps map
Loading sold comps map…
Walkable amenities ~0.75 mi
Loading nearby amenities…
Taxation est. · year 1
- Rental income
- $11,004
- − Mortgage interest
- −$4,621
- − Property taxes
- −$627
- − Insurance
- −$412
- − Repairs & maintenance
- −$880
- − Management
- −$880
- − HOA
- −$2,688
- − Depreciation
- −$2,400
- Taxable loss
- −$1,505
- Est. tax savings @ 24.0%
- +$361
- After-tax cash flow
- $135/yr
For passive investors: Depreciation is non-cash, so a rental often shows a tax loss while cash-flowing — sheltering income. Rental losses are passive: they offset passive income freely, and up to $25,000/yr can offset ordinary (W-2) income if you actively participate and your MAGI is under $100k (phasing out to $0 by $150k); unused losses carry forward. On sale, claimed depreciation is recaptured at up to 25%, and gains may owe capital-gains tax (a 1031 exchange can defer both). Figures are a year-1 estimate at your 24.0% rate — not tax advice; consult a CPA.
Schools (NCES district)
- District
- Lafayette Parish
- NCES district ID
- 2200870
- Math proficiency
- 38% ▼ -32.00%
- Reading proficiency
- 46% ▼ -24.00%
- Median HH income
- $50,238
- Composite
- 36.15/100
- National rank
- #4741
- State rank
- #19 of 98 in LA
Livability — Lafayette
- Score
- 70/100
- State rank
- #63
- US rank
- #8133
Category grades
Schools grade is shown separately in the Schools card above.
Census & demographics
- Census place
- Lafayette, LA
- County
- Lafayette Parish · 207,544 people
- City population
- 158,114
- Metro
- Lafayette, LA
- Population (ZIP)
- 28,643
- Household income
- $94,688
- Rent vs Own
- Severe rent burden
- 769.0
Population outlook (Lafayette County) Hauer SSP2
- Today (2025)
- 280,930 people
- By 2030
- 301,092 · +7.2%
- By 2040
- 339,456 · +20.8%
- By 2050
- 375,156 · +33.5%
- By 2075
- 451,672 · +60.8%
- By 2100
- 497,203 · +77.0%
Race, ethnicity, and origin ACS 2023
- Neighborhood character
- Predominantly White (74%)
- Race & ethnicity
- White 74% Black 10% Hispanic / Latino 8% Two or more races 6% Asian 3%
- Hispanic origin (detail)
- Mexican 3%
- Common ancestry
- Lithuanian 23% Slovak 2% Italian 2%
- Foreign-born
- 6% · Canada, Vietnam, China
- Languages at home
- 88% English-only · Spanish 5% French/Haitian/Cajun 3% Other Indo-European 1%
Political lean MEDSL · Lafayette
- 2024 margin
- Solid R (+31.4) · D 33.5% · R 64.8% · Other 1.7%
- 2008→2024 swing
- -0.1pp no change · 2008: -31.3pp · 2024: -31.4pp
- All cycles
- 2024: R+31.4 2020: R+28.7 2016: R+33.6 2012: R+33.7 2008: R+31.3
Not yet ingested
- Civics
- —
Market trends
- HPI YoY
- ▼ -81.65%
- Current HPI
- 158.7094
- Rent YoY
- ▲ 0.36%
- Metro
- Lafayette, LA
- State GDP YoY
- ▲ 3.29%
- F500 in state
- 10
Industry mix (Fortune 500 HQ in LA)
| Industry | F500 HQs | Revenue |
|---|---|---|
| Telecommunications | 2 | $23B |
|
||
| Utilities | 1 | $12B |
|
||
| Wholesale / Distribution | 1 | $5B |
|
||
| Advertising | 1 | $2B |
|
||
Price history
+106.8% since first listed12 events — show timeline
- 2026-04-14 Price Changed $82,500 AcadianaMLS
- 2025-11-18 Relisted — AcadianaMLS
- 2025-11-10 Pending — AcadianaMLS
- 2025-10-14 Listed $85,000 AcadianaMLS
- 2013-11-22 Listed $78,000 AcadianaMLS
- 2010-06-10 Sold (Public Records) $53,700 Public Records
- 2010-06-10 Sold (MLS) $53,700 AcadianaMLS
- 2009-10-15 Listed $65,000 AcadianaMLS
- 2005-08-30 Sold (MLS) $50,000 AcadianaMLS
- 2005-01-28 Listed $52,500 AcadianaMLS
- 2000-06-29 Sold (MLS) $39,900 AcadianaMLS
- 2000-05-19 Listed $39,900 AcadianaMLS
Property tax history
+3.1%/yrLatest (2025): $627 · -1.1% YoY. Source: county tax records.
Cash-flow waterfall
monthlySold comps — $/sqft
last 12 mo · ≤1 miLoading sold comps…