910183 S 3380 Rd · Warwick, OK
Flood risk 1/10 · Minimal
- FEMA flood zone
- X (unshaded)
- Chance of flooding over 30 yrs
- 0.0%
- Est. flood insurance / yr
- $507 – $1,088
Fire risk 6/10 · Moderate
- Est. fire insurance / yr
- $2,463 – $4,575
Heat risk 6/10 · Moderate
- Hot days now (above 110°F)
- 7 days/yr
- Hot days in 30 yrs
- 18 days/yr
Wind risk 3/10 · Minor
- Chance of severe wind over 30 yrs
- 4.0%
Air-quality risk 2/10 · Minimal
- Unhealthy air days now
- 1 days/yr
- Unhealthy air days in 30 yrs
- 1 days/yr
Risk factors via First Street. Map © Google.
Why this score? — see what drove the D grade
The composite is a weighted blend of 9 inputs, each scored 0–100. Each bar is that input's sub-score; the figure is the points it added to the 100-point composite (weight × sub-score).
- Appreciation +10.0/10.0
- Cash flow +9.8/30.0
- ARV discount +7.5/15.0
- DSCR +2.8/10.0
- Schools +2.6/10.0
- Rent growth +2.5/5.0
- Livability +2.5/5.0
- Condition / age +2.5/5.0
- 1% rule +2.1/10.0
$189,000
🖨 Deal sheet (PDF) 📄 Offer letter ✓ Due diligence
Listing remarks
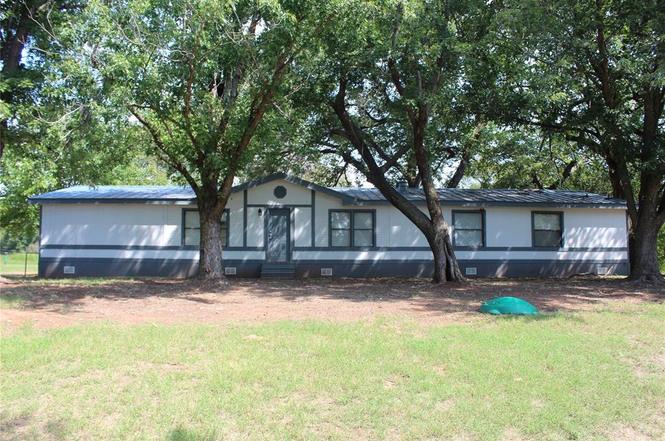
4 Bedroom Home on 1.25 Acres, Spacious 2240 sq ft, 4 bed 3 bath home between Chandler and Wellston, just off Hwy 66 near new casino, plenty of room inside and out for privacy and country living with easy highway access.
Key facts
- 1.25 acre lot
- Built 1991
- Listed 284 days
Property features AI
Finance
- Financial info: Not assumable
- HOA & community: No mandatory association dues
Exterior
- Utilities: Electricity available; Propane; Rural water; Septic tank
- Home design: Single-family residential manufactured home; One level; Model home
- Construction: Manufactured construction; Composition roof; Built and currently existing
- Exterior features: Interior lot; Below-ground storm shelter; Exterior listed as none
Interior
- Kitchen: Range
- Bedrooms: 4 bedrooms
- Bathrooms: 3 full bathrooms
- Interior features: Two living areas; Gas log fireplace
- Laundry & utility: Conventional foundation
Neighborhood map
What this means for you Summary
Snapshot
- This is a 4-bed/2.0-bath manufactured listed at $189k.
Deal economics
- At list price, monthly cash flow is $-121 ($-1k/yr) — negative.
- To cash-flow at today's rent, offer at most $168k (11.3% below list).
- To meet the 1% rule (rent ≥ 1% of price), the offer needs to be $135k (28.6% below list).
- Recommended offer: $135k (28.6% below list) — sets the bar for 1% rule.
Location & tenants
- Location reads 49/100 on livability (#686 in OK) — a working-class tenant base; expect higher turnover. Strengths: cost of living A+, crime A; Watch: amenities F, commute F, employment F.
- Wellston (rural): math 26% / reading 34% proficiency, ranked #59 of 270 in OK (top 22%) — families likely to look elsewhere, expect single-tenant / working-renter base with shorter leases.
- Zoned schools: Wellston Es (math 32% / reading 37%, grade F, #168 of 845 statewide, top 24%, 259 students, 0% FRL); Wellston Ms (math 17% / reading 27%, grade F, #129 of 345 statewide, top 42%, 126 students, 0% FRL); Wellston Hs (math 34% / reading 34%, grade F, #48 of 447 statewide, top 14%, 129 students, 0% FRL) — zoned schools average 0% FRL vs 46% district-wide (46 pts lower); this property's tenant base skews higher-income than the district average.
- Market conditions: 122 active listings in the ZIP; 19 units permitted in Lincoln County in 2024 (0 in 5+ unit buildings).
Forward outlook
- In year one you build about $20k of equity ($1k loan paydown + $19k appreciation (10.0% local appreciation)).
- By year 2, paydown + projected appreciation supports a ~$32k cash-out refi (75% LTV) — recoverable capital for the next deal without selling this one.
Negotiation context
- It's been on market 284 days — a 12% lower offer ($166k) is reasonable based on typical stale-listing flexibility.
- Current owner paid $161k; 17% above their basis — modest negotiation headroom, anchor on the comps not their cost.
Risks & watch-outs
- Climate carrying-cost: major wildfire risk; extreme-heat days projected 7→18/yr by 2055 (HVAC capex compounding) — expect insurance premiums to compound above CPI over the hold.
Questions for the listing agent
- What do current leases actually rent for vs. the listed asking? Can we see a recent rent roll and the last 12 months of T-12 income?
- It's been on market 284 days. Have you received any prior offers? Is the seller open to a 29% concession, seller financing, or rate buy-down credit?
- Why hasn't it sold? Are there any deal-killer items the seller is aware of (foundation, flood, title, zoning, code violations)?
- Is there a deadline driving the sale (1031 exchange, divorce, estate, relocation)? That informs how much negotiation room exists.
- Schools are F-rated, which usually means shorter tenancies and higher turnover. Who's the typical renter profile here, and what's been the actual vacancy rate?
- The area grade is low — what's the realistic commute time and amenity access for the typical tenant pool here? Any planned neighborhood developments (good or bad) we should know about?
- What's the average days-on-market for RENTAL listings here right now (not sales)? A rising rental-DOM trend means longer vacancies and softer asking-rent achievability than the comps imply.
- What's the recent tenant-quality profile in this submarket — average credit score on applications, eviction rate, late-payment / NSF rate, and stable-employment percentage? A property-management company in the area should have these aggregated.
- How much new for-sale + rental construction is in the pipeline within 1–3 miles? Heavy new supply typically softens prices + rents 12–24 months out; constrained supply supports both.
Investment metrics
- 1% rule
- 0.71% ✗
- Cap rate
- 5.52%
- Cash-on-cash
- -2.75%
- DSCR
- 0.88
- GRM
- 11.7
CMA / ARV
No comps found within radius.
Projected returns pro-forma
10.0% appreciation · 3.0% rent growth · sell at horizon
- IRR
- 22.3%
- Equity multiple
- 2.80×
- Total profit
- $95,163
- Equity at exit
- $170,266
- IRR
- 20.0%
- Equity multiple
- 6.41×
- Total profit
- $286,206
- Equity at exit
- $367,185
Cash invested: $52,920 (down + closing). Projections, not guarantees.
Landlord ↔ Tenant lean methodology
- Overall (STATE)
- 83 Strongly Landlord-Friendly
- State Oklahoma
- 83 Strongly Landlord-Friendly · R+20
- County
- — inherits STATE
- City
- — inherits STATE
ZIP-level market 74834
- Home prices YoY
- 19.9%
- Active inventory
- 122
- Price-to-rent
- 11.7×
Monthly cashflow live
- Estimated rent
- $1,350 medium interval (Pro) →
- Mortgage (P&I)
- −$991
- Tax from tax record
- −$118 /mo · $1,417/yr
- Insurance
- −$79
- HOA
- −$0
- Vacancy / Maint / Mgmt
- −$284
- Net cashflow
- $-121
Break-even live
Sensitivity live
| Price | -10% $-14 | -5% $-68 | +0% $-121 | +5% $-175 | +10% $-228 |
|---|---|---|---|---|---|
| Rent | -10% $-228 | -5% $-175 | +0% $-121 | +5% $-68 | +10% $-15 |
| Rate | -1.0pp $-26 | -0.5pp $-73 | base $-121 | +0.5pp $-170 | +1.0pp $-220 |
UW: 25.0% down · 7.5% · 30yr · 1.5% tax · 5.0% vac · 8.0% maint · 8.0% mgmt
Financing live
Cash to close
- Down payment
- $47,250
- Closing costs
- $5,670
- Reserves months
- —
- Total cash needed
- —
Loan-product check · same deal, 3 products live
Conventional
25% down · 7.5% · 30yr
- Down + closing
- —
- Monthly P&I
- —
- Monthly cashflow
- —
- DSCR
- —
- Eligible?
- —
Personal DTI + credit; lowest rate.
DSCR
20% down · 8.5% · 30yr
- Down + closing
- —
- Monthly P&I
- —
- Monthly cashflow
- —
- DSCR
- —
- Eligible?
- —
No personal income docs; deal must DSCR.
Hard money
10% down · 12.0% · 12mo
- Down + closing
- —
- Monthly P&I
- —
- Monthly cashflow
- —
- DSCR
- —
- Eligible?
- —
Short-term bridge; refi at stabilization.
Listing history 20 events
-
2026-06-21days on market $189,000 Active 284 DOM
-
2026-06-21days on market $189,000 Active 283 DOM
-
2026-06-18days on market $189,000 Active 281 DOM
-
2026-06-17days on market $189,000 Active 280 DOM
-
2026-06-16days on market $189,000 Active 279 DOM
-
2026-06-15days on market $189,000 Active 278 DOM
-
2026-06-13days on market $189,000 Active 276 DOM
-
2026-06-12days on market $189,000 Active 275 DOM
-
2026-06-09days on market $189,000 Active 272 DOM
-
2026-06-08days on market $189,000 Active 271 DOM
-
2026-06-08days on market $189,000 Active 270 DOM
-
2026-06-07days on market $189,000 Active 269 DOM
-
2026-06-04days on market $189,000 Active 266 DOM
-
2026-06-02days on market $189,000 Active 265 DOM
-
2026-06-01days on market $189,000 Active 264 DOM
-
2026-05-31days on market $189,000 Active 263 DOM
-
2025-11-07price $189,000
-
2025-09-09$210,000 Active
-
2021-11-08soldstatus $161,000
-
1997-05-05soldstatus $18,000
ⓘ Source: listings_history table (triggers on properties + properties_extension) + one-shot
backfill from property_details.listing_events for pre-trigger history.
Tax reassessment forecast OK · Resets to sale price
- Current annual tax
- $1,417 · $118/mo
- Projected year-2 tax
- $1,701 · $142/mo
- Expected delta
- +$284/yr (+$24/mo · 20.0%)
ⓘ Screening estimate from a state-policy table — verify with the county assessor before closing.
Climate risk First Street
- Flood 1/10 Low FEMA zone X (unshaded) · 0% chance over 30 yrs
- Wildfire 6/10 Major
- Heat 6/10 Major 7 d/yr ≥110°F today · 18 d/yr by 30 yrs out
- Wind 3/10 Moderate 4% chance of damaging wind over 30 yrs
- Air quality 2/10 Low 1 unhealthy d/yr today · 1 by 30 yrs out
Nearby sold comps map
Loading sold comps map…
Walkable amenities ~0.75 mi
Loading nearby amenities…
Taxation est. · year 1
- Rental income
- $16,204
- − Mortgage interest
- −$10,587
- − Property taxes
- −$1,417
- − Insurance
- −$945
- − Repairs & maintenance
- −$1,296
- − Management
- −$1,296
- − Depreciation
- −$5,498
- Taxable loss
- −$4,836
- Est. tax savings @ 24.0%
- +$1,161
- After-tax cash flow
- $-294/yr
For passive investors: Depreciation is non-cash, so a rental often shows a tax loss while cash-flowing — sheltering income. Rental losses are passive: they offset passive income freely, and up to $25,000/yr can offset ordinary (W-2) income if you actively participate and your MAGI is under $100k (phasing out to $0 by $150k); unused losses carry forward. On sale, claimed depreciation is recaptured at up to 25%, and gains may owe capital-gains tax (a 1031 exchange can defer both). Figures are a year-1 estimate at your 24.0% rate — not tax advice; consult a CPA.
Schools (NCES district)
- District
- Wellston
- NCES district ID
- 4032280
- Math proficiency
- 26% ▼ -9.00%
- Reading proficiency
- 34% ▼ -6.00%
- Median HH income
- $44,907
- Composite
- 25.69/100
- National rank
- #7390
- State rank
- #59 of 270 in OK
Livability — Warwick
- Score
- 49/100
- State rank
- #686
- US rank
- #25997
Category grades
Schools grade is shown separately in the Schools card above.
Census & demographics
- Census place
- Warwick, OK
- Population (ZIP)
- 7,551
Population outlook (Lincoln County) Hauer SSP2
- Today (2025)
- 36,104 people
- By 2030
- 36,435 · +0.9%
- By 2040
- 36,696 · +1.6%
- By 2050
- 36,216 · +0.3%
- By 2075
- 35,057 · -2.9%
- By 2100
- 31,333 · -13.2%
Race, ethnicity, and origin ACS 2023
- Neighborhood character
- Predominantly White (78%)
- Race & ethnicity
- White 78% Two or more races 12% Hispanic / Latino 3% Black 3% Native American 3%
- Common ancestry
- Lithuanian 4% Slovak 2% Scottish 1%
- Foreign-born
- 1%
- Languages at home
- 97% English-only · Spanish 2%
Political lean MEDSL · Lincoln
- 2024 margin
- Solid R (+63.3) · D 17.5% · R 80.8% · Other 1.7%
- 2008→2024 swing
- -13.4pp toward R · 2008: -49.8pp · 2024: -63.3pp
- All cycles
- 2024: R+63.3 2020: R+63.2 2016: R+60.1 2012: R+49.0 2008: R+49.8
Not yet ingested
- Civics
- —
Market trends
- HPI YoY
- ▲ 52.43%
- Current HPI
- 315.8775
- Rent YoY
- —
- Metro
- —
- State GDP YoY
- ▲ 1.55%
- F500 in state
- 6
Industry mix (Fortune 500 HQ in OK)
| Industry | F500 HQs | Revenue |
|---|---|---|
| Energy | 3 | $48B |
|
||
Price history
+950.0% since first listed4 events — show timeline
- 2025-11-07 Price Changed $189,000 MLSOK
- 2025-09-09 Listed $210,000 MLSOK
- 2021-11-08 Sold (Public Records) $161,000 Public Records
- 1997-05-05 Sold (Public Records) $18,000 Public Records
Property tax history
+9.6%/yrLatest (2025): $1,417 · +14.1% YoY. Source: county tax records.
Cash-flow waterfall
monthlySold comps — $/sqft
last 12 mo · ≤1 miLoading sold comps…