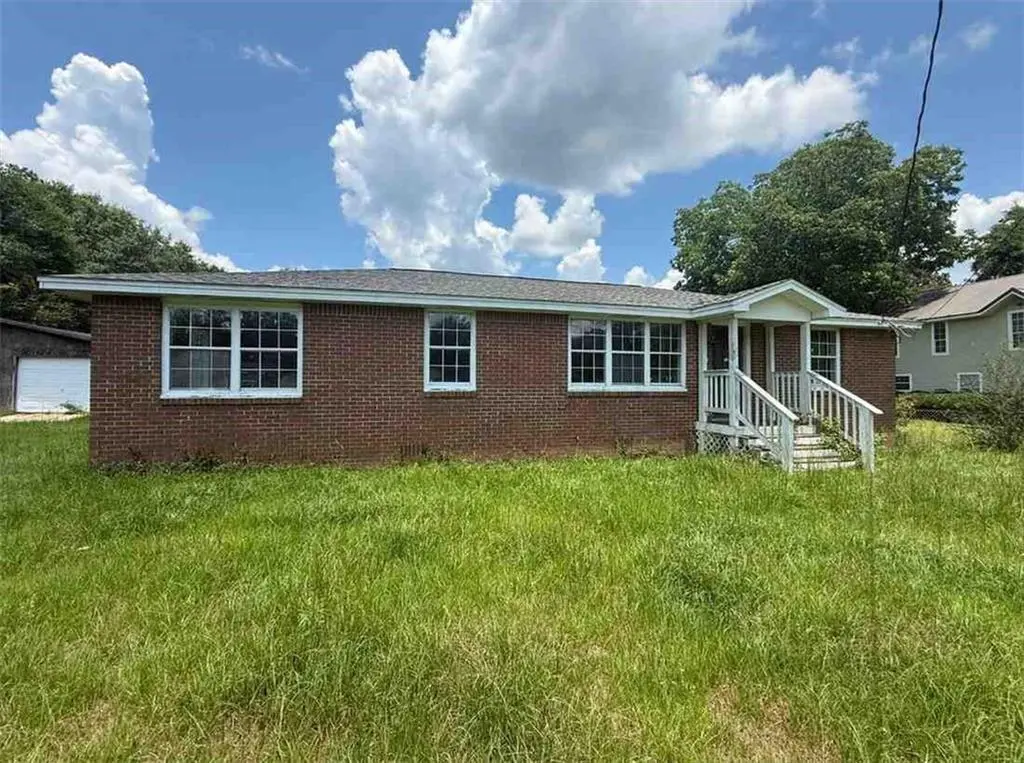
9110 Robley Ln · Semmes, AL
Flood risk 1/10 · Minimal
- FEMA flood zone
- X (unshaded)
- Chance of flooding over 30 yrs
- 0.0%
- Est. flood insurance / yr
- $507 – $1,088
Fire risk 7/10 · Major
- Est. fire insurance / yr
- $916 – $1,700
Heat risk 8/10 · Major
- Hot days now (above 105°F)
- 7 days/yr
- Hot days in 30 yrs
- 20 days/yr
Wind risk 9/10 · Severe
- Chance of severe wind over 30 yrs
- 99.0%
Air-quality risk 1/10 · Minimal
- Unhealthy air days now
- 0 days/yr
- Unhealthy air days in 30 yrs
- 0 days/yr
Risk factors via First Street. Map © Google.
Why this score? — see what drove the C+ grade
The composite is a weighted blend of 9 inputs, each scored 0–100. Each bar is that input's sub-score; the figure is the points it added to the 100-point composite (weight × sub-score).
- Cash flow +24.4/30.0
- ARV discount +15.0/15.0
- DSCR +7.9/10.0
- 1% rule +5.7/10.0
- Livability +3.0/5.0
- Rent growth +2.5/5.0
- Condition / age +2.5/5.0
- Schools +2.3/10.0
- Appreciation +0.0/10.0
$164,900
🖨 Deal sheet 📄 Offer letter ✓ Due diligence
Listing remarks MLS
SELLER WILL ENTERTAIN OFFERS BETWEEN $155,000.00 AND $165,000.00 COMBINED UPPER AND LOWER VRM. THIS HOME IS LOCATED IN A USDA ELIGIBLE AREA IF BUYER QUALIFIES. THIS BEAUTY HAS BRAND NEW ROOF, BRAND NEW AC, BRAND NEW SEPTIC SYSTEM. NEW PAINT THROUGHOUT, NEW FLOORS, JUST WAY TOO MUCH TO LIST EVERYTHING. THIS SPLIT BEDROOM FLOORPLAN IS THE PERFECT LAYOUT FOR A GROWING FAMILY. HOME HAS A HUGE YARD, DECK AND WORKSHOP IS LARGE ENOUGH TO USE AS A 4 CAR GARAGE, GAME ROOM, WORKSHOP, WHATEVER YOUR HEART DESIRES.. COME SEE THIS ONE BEFORE ITS GONE!!AGENT RELATED TO SELLER
Key facts
- Solid brick
- Large lot
- Spacious workshop
Tags
Property features AI
Exterior
- Parking: 2-car garage; Garage parking
- Utilities: Septic tank sewer; Other electric; No listed utilities
- Home design: Single family residence; Residential property
- Construction: Built in 2011; Shingle roof; Other roof material; Pillar/Post/Pier foundation
- Exterior features: Fenced yard; Other exterior features; View
Interior
- Kitchen: Other kitchen features; Other appliances
- Bedrooms: 3 bedrooms
- Flooring: Hardwood floors
- Bathrooms: 2 full bathrooms
- Heating & cooling: Other heating; Other cooling
- Interior features: Other interior features; No fireplace
- Laundry & utility: Other heating; Other cooling
Neighborhood map
What this means for you Summary
Snapshot
- This is a 3-bed/2.0-bath single-family listed at $165k.
Deal economics
- At list price, monthly cash flow is $335 ($4k/yr) — positive.
- The deal already cash-flows at list — no discount required.
- Meets the 1% rule at list price ($2k rent vs $165k).
- Cap rate 8.7% vs local median 5.3% in Semmes — top-decile yield for the area; either an underpriced asset or a hidden risk that comps aren't pricing in. Stress-test before assuming the spread holds.
Location & tenants
- Location reads 60/100 on livability (#311 in AL) — a middle-class / working-renter tenant base. Strengths: cost of living A+, housing A+; Watch: crime F, amenities F, commute F.
- Mobile County (urban): math 15% / reading 39% proficiency, ranked #81 of 129 in AL (top 63%) — low school quality limits family demand, transient renter base, plan for 1-2y turnover; 67% free/reduced lunch — lower-income household profile, screen leases tightly.
- Zoned schools: Semmes Elementary School (math 37% / reading 63%, grade D+, #119 of 627 statewide, top 19%, 546 students, 51% FRL); Mary G Montgomery High School (math 13% / reading 18%, grade F, #211 of 305 statewide, top 69%, 1,965 students, 53% FRL) — zoned schools average 52% FRL vs 67% district-wide (15 pts lower); this property's tenant base skews higher-income than the district average.
- Market conditions: 184 active listings in the ZIP; 2 comparable units currently listed for rent nearby; 1,678 units permitted in Mobile County in 2024 (264 in 5+ unit buildings).
Forward outlook
- Local home prices are declining (-3.0%/yr); year-one equity from $1k of loan paydown is wiped out by about $5k of value loss. Plan a longer hold.
- Mobile County population projected to shrink 8% by 2050 — rents likely to lag national; underwrite the cash flow, not the appreciation.
Negotiation context
- Only 6 days on market — expect competitive offers; lowballing is unlikely to land.
- 2 sale attempts with the ask held roughly flat each time — persistent listings suggest the price (not the market) is what's stuck; bring a comps-based counter.
Risks & watch-outs
- Climate carrying-cost: severe wind risk, 99% chance of damaging wind over 30y; major wildfire risk; extreme-heat days projected 7→20/yr by 2055 (HVAC capex compounding) — expect insurance premiums to compound above CPI over the hold.
Questions for the listing agent
- Is there a deadline driving the sale (1031 exchange, divorce, estate, relocation)? That informs how much negotiation room exists.
- Schools are D-rated, which usually means shorter tenancies and higher turnover. Who's the typical renter profile here, and what's been the actual vacancy rate?
- Crime grade is F in this area — have there been break-ins, vandalism, or insurance claims at this property in the last 3 years? What carrier currently insures it and at what premium?
- What's the average days-on-market for RENTAL listings here right now (not sales)? A rising rental-DOM trend means longer vacancies and softer asking-rent achievability than the comps imply.
- What's the recent tenant-quality profile in this submarket — average credit score on applications, eviction rate, late-payment / NSF rate, and stable-employment percentage? A property-management company in the area should have these aggregated.
- How much new for-sale + rental construction is in the pipeline within 1–3 miles? Heavy new supply typically softens prices + rents 12–24 months out; constrained supply supports both.
Investment metrics
- 1% rule
- 1.07% ✓
- Cap rate
- 8.73%
- Cash-on-cash
- 8.71%
- DSCR
- 1.39
- GRM
- 7.8
CMA / ARV
- ARV (on-the-fly)
- $231,822
- Comps found
- 12
Show comp detail 12 sales within ~0.75 mi
| Address | Dist | Beds/Ba | Sqft | Sold | Price | $/sf | Match |
|---|---|---|---|---|---|---|---|
| 9480 Hunters Way Dr | 0.49mi | 4/2.0 (+1) | 1,440 (+1%) | 1mo | $235,000 | $163 | 70 |
| 6381 Fox Hunt Dr | 0.55mi | 3/2.0 | 1,392 (-3%) | 3mo | $225,000 | $162 | 67 |
| 9411 Fox Hunter Ct E | 0.44mi | 3/2.0 | 1,404 (-2%) | 17mo | $240,000 | $171 | 62 |
| 9366 E FOX RUN Ct | 0.46mi | 3/2.0 | 1,456 (+2%) | 17mo | $230,000 | $158 | 62 |
| 9412 E Fox Hunter Ct | 0.43mi | 4/2.0 (+1) | 1,500 (+5%) | 9mo | $242,500 | $162 | 60 |
| 9530 Hunters Way Dr | 0.57mi | 3/2.0 | 1,380 (-4%) | 11mo | $191,000 | $138 | 58 |
| 9520 Hunters Way Dr | 0.55mi | 3/2.0 | 1,326 (-7%) | 10mo | $235,000 | $177 | 54 |
| 6601 Private Road 181 | 0.56mi | 2/2.0 (-1) | 1,305 (-9%) | 2mo | $178,500 | $137 | 53 |
| 9445 Hunters Way Dr | 0.43mi | 3/2.0 | 1,305 (-9%) | 16mo | $225,000 | $172 | 52 |
| 6651 Keel Rd | 0.65mi | 4/2.0 (+1) | 1,500 (+5%) | 18mo | $167,000 | $111 | 42 |
| 6395 Fox Hunt Dr | 0.54mi | 4/2.0 (+1) | 1,604 (+12%) | 12mo | $239,000 | $149 | 40 |
| 9370 Woodvale Dr | 0.64mi | 4/2.5 (+1) | 1,580 (+10%) | 12mo | $200,000 | $127 | 35 |
Match score weights: distance 35% · size 25% · config 20% · recency 20%. Top-matched comps best support the ARV.
Projected returns pro-forma
-3.0% appreciation · 3.0% rent growth · sell at horizon
- IRR
- -3.1%
- Equity multiple
- 0.88×
- Total profit
- $-5,406
- Equity at exit
- $24,587
- IRR
- 6.6%
- Equity multiple
- 1.49×
- Total profit
- $22,682
- Equity at exit
- $14,258
Cash invested: $46,172 (down + closing). Projections, not guarantees.
Landlord ↔ Tenant lean methodology
- Overall (STATE)
- 90 Strongly Landlord-Friendly
- State Alabama
- 90 Strongly Landlord-Friendly · R+15
- County
- — inherits STATE
- City
- — inherits STATE
ZIP-level market 36575
- Home prices YoY
- -21.8%
- Active inventory
- 184
- Price-to-rent
- 7.8×
Monthly cashflow live
- Estimated rent
- $1,769 medium interval (Pro) →
- Mortgage (P&I)
- −$865
- Tax from tax record
- −$129 /mo · $1,550/yr
- Insurance
- −$69
- HOA
- −$0
- Vacancy / Maint / Mgmt
- −$372
- Net cashflow
- $335
Break-even live
UW: 25.0% down · 7.5% · 30yr · 1.5% tax · 5.0% vac · 8.0% maint · 8.0% mgmt
Financing live
Cash to close
- Down payment
- $41,225
- Closing costs
- $4,947
- Reserves months
- —
- Total cash needed
- —
Loan-product check · same deal, 3 products live
Conventional
25% down · 7.5% · 30yr
- Down + closing
- —
- Monthly P&I
- —
- Monthly cashflow
- —
- DSCR
- —
- Eligible?
- —
Personal DTI + credit; lowest rate.
DSCR
20% down · 8.5% · 30yr
- Down + closing
- —
- Monthly P&I
- —
- Monthly cashflow
- —
- DSCR
- —
- Eligible?
- —
No personal income docs; deal must DSCR.
Hard money
10% down · 12.0% · 12mo
- Down + closing
- —
- Monthly P&I
- —
- Monthly cashflow
- —
- DSCR
- —
- Eligible?
- —
Short-term bridge; refi at stabilization.
Rent comps 2 comps
| Address | Beds | Baths | Sqft | Rent | $/sqft | DOM | Units | Dist |
|---|---|---|---|---|---|---|---|---|
| 9530 Fox Hunter Ct W Semmes, AL | 3.0 | 2.0 | 1326 | $1,650 | $1.24 | 20d | 1 | 0.57mi |
| 6208 Marlin Dr Eight Mile, AL | 3.0 | 2.0 | 1595 | $1,895 | $1.19 | 43d | 1 | 0.58mi |
Listing history 6 events
-
2026-06-18days on market $164,900 Active 6 DOM
-
2026-06-17days on market $164,900 Active 5 DOM
-
2026-06-16days on market $164,900 Active 4 DOM
-
2026-06-15days on market $164,900 Active 3 DOM
-
2026-06-13remarks 687-char remark
-
2026-06-13$164,900 Active 1 DOM
ⓘ Source: listings_history table (triggers on properties + properties_extension) + one-shot
backfill from property_details.listing_events for pre-trigger history.
Tax reassessment forecast AL · Resets to sale price
- Current annual tax
- $1,550 · $129/mo
- Projected year-2 tax
- $1,550 · $129/mo
- Expected delta
- $0/yr ($0/mo · 0.0%)
ⓘ Screening estimate from a state-policy table — verify with the county assessor before closing.
Climate risk First Street
- Flood 1/10 Low FEMA zone X (unshaded) · 0% chance over 30 yrs
- Wildfire 7/10 Severe
- Heat 8/10 Severe 7 d/yr ≥105°F today · 20 d/yr by 30 yrs out
- Wind 9/10 Extreme 99% chance of damaging wind over 30 yrs
- Air quality 1/10 Low 0 unhealthy d/yr today · 0 by 30 yrs out
Nearby sold comps map
Loading sold comps map…
Walkable amenities ~0.75 mi
Loading nearby amenities…
Taxation est. · year 1
- Rental income
- $21,230
- − Mortgage interest
- −$9,237
- − Property taxes
- −$1,550
- − Insurance
- −$824
- − Repairs & maintenance
- −$1,698
- − Management
- −$1,698
- − Depreciation
- −$4,797
- Taxable income
- $1,424
- Est. tax owed @ 24.0%
- −$342
- After-tax cash flow
- $3,678/yr
For passive investors: Depreciation is non-cash, so a rental often shows a tax loss while cash-flowing — sheltering income. Rental losses are passive: they offset passive income freely, and up to $25,000/yr can offset ordinary (W-2) income if you actively participate and your MAGI is under $100k (phasing out to $0 by $150k); unused losses carry forward. On sale, claimed depreciation is recaptured at up to 25%, and gains may owe capital-gains tax (a 1031 exchange can defer both). Figures are a year-1 estimate at your 24.0% rate — not tax advice; consult a CPA.
Schools (NCES district)
- District
- Mobile County
- NCES district ID
- 0102370
- Math proficiency
- 15% ▼ -28.00%
- Reading proficiency
- 39% ▬ 0.00%
- Median HH income
- $42,455
- Composite
- 22.9/100
- National rank
- #8002
- State rank
- #81 of 129 in AL
Livability — Semmes
- Score
- 60/100
- State rank
- #311
- US rank
- #19360
Category grades
Schools grade is shown separately in the Schools card above.
Census & demographics
- Population (ZIP)
- 22,444
Population outlook (Mobile County) Hauer SSP2
- Today (2025)
- 415,303 people
- By 2030
- 411,755 · -0.9%
- By 2040
- 399,670 · -3.8%
- By 2050
- 382,616 · -7.9%
- By 2075
- 337,353 · -18.8%
- By 2100
- 283,391 · -31.8%
Race, ethnicity, and origin ACS 2023
- Neighborhood character
- Predominantly White (73%)
- Race & ethnicity
- White 73% Black 19% Hispanic / Latino 5% Two or more races 3%
- Common ancestry
- Lithuanian 2% Slovak 2% Serbian 2%
- Foreign-born
- 2% · Canada, Vietnam
- Languages at home
- 97% English-only · Spanish 2% Vietnamese 1%
Political lean MEDSL · Mobile
- 2024 margin
- R (+16.4) · D 41.3% · R 57.7%
- 2008→2024 swing
- -7.7pp toward R · 2008: -8.7pp · 2024: -16.4pp
- All cycles
- 2024: R+16.4 2020: R+11.9 2016: R+13.9 2012: R+9.3 2008: R+8.7
Not yet ingested
- Civics
- —
Market trends
- HPI YoY
- ▼ -60.58%
- Current HPI
- 217.5112
- Rent YoY
- —
- Metro
- —
- State GDP YoY
- ▲ 2.94%
- F500 in state
- 4
Industry mix (Fortune 500 HQ in AL)
| Industry | F500 HQs | Revenue |
|---|---|---|
| Financial Services | 1 | $8B |
|
||
| Healthcare | 1 | $5B |
|
||
Price history
+3.1% since first listed5 events — show timeline
- 2026-06-12 Listed $164,900 GCMLS AL
- 2025-11-24 Price Changed $195,000 BCAR
- 2025-11-03 Listed $210,000 BCAR
- 2021-11-22 Sold (Public Records) $160,000 Public Records
- 2021-11-17 Sold (MLS) $160,000 GCMLS AL
Property tax history
+9.1%/yrLatest (2025): $1,550 · +2.7% YoY. Source: county tax records.
Cash-flow waterfall
monthlySold comps — $/sqft
last 12 mo · ≤1 miLoading sold comps…