1326 NE Forrest Ave · Southeast Arcadia, FL
Flood risk 1/10 · Minimal
- FEMA flood zone
- X (unshaded)
- Chance of flooding over 30 yrs
- 0.0%
- Est. flood insurance / yr
- $507 – $1,088
Fire risk 5/10 · Moderate
- Est. fire insurance / yr
- $947 – $1,759
Heat risk 9/10 · Severe
- Hot days now (above 107°F)
- 7 days/yr
- Hot days in 30 yrs
- 26 days/yr
Wind risk 10/10 · Severe
- Chance of severe wind over 30 yrs
- 99.0%
Air-quality risk 2/10 · Minimal
- Unhealthy air days now
- 1 days/yr
- Unhealthy air days in 30 yrs
- 2 days/yr
Risk factors via First Street. Map © Google.
Why this score? — see what drove the D grade
The composite is a weighted blend of 9 inputs, each scored 0–100. Each bar is that input's sub-score; the figure is the points it added to the 100-point composite (weight × sub-score).
- Cash flow +17.7/30.0
- ARV discount +7.5/15.0
- DSCR +5.6/10.0
- 1% rule +3.8/10.0
- Livability +2.8/5.0
- Schools +2.6/10.0
- Rent growth +2.5/5.0
- Condition / age +2.5/5.0
- Appreciation +0.0/10.0
$180,000
🖨 Deal sheet 📄 Offer letter ✓ Due diligence
Listing remarks
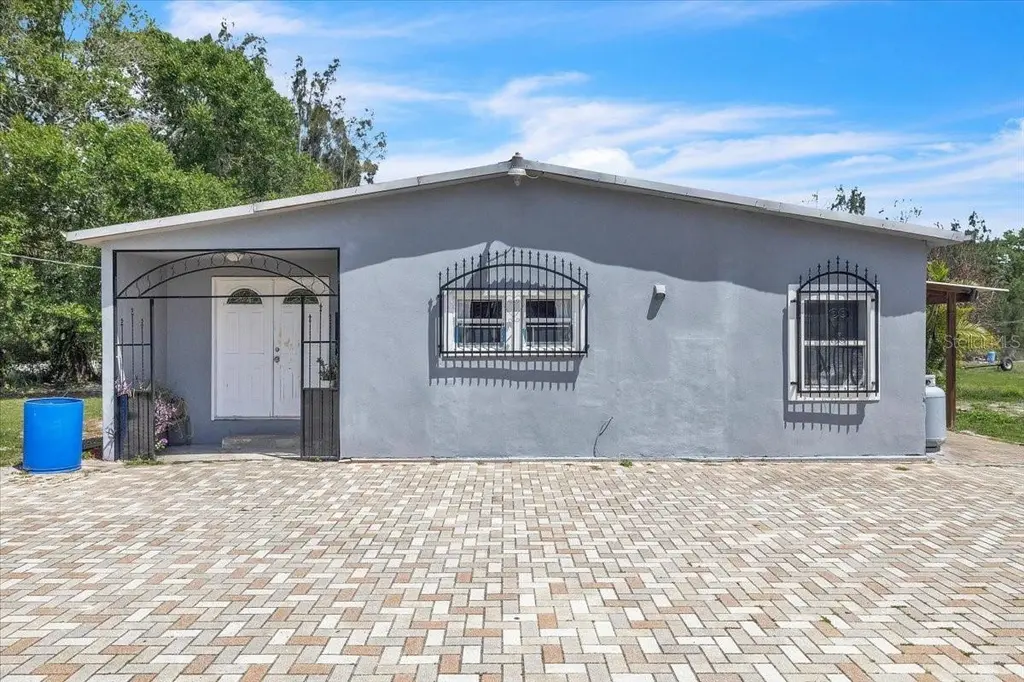
Welcome to this charming 4-bedroom, 2 bathroom single-wide mobile home seated on just over half an acre, offering plenty of space and privacy. The property features a detached 2-car carport that can also be used as a workshop-perfect for storage, hobbies, or projects. Conveniently located near shops, restaurants, and downtown Arcadia, this home combines peaceful living with easy access to everyday essentials. You don't want to miss out on this opportunity of owning a piece of paradise in the beautiful arcadia, call us now to schedule your private tour!
Key facts
- Detached carport
- Near restaurants
- Near downtown
Tags
Property features AI
Finance
- Other: Lot is approximately 0.53 acre (paved road access); Zoned RM
- HOA & community: No association
Exterior
- Parking: Carport with 2 spaces
- Utilities: Well water; Septic tank; Electricity connected; Water connected
- Home design: Manufactured single-wide home; Residential property; One story; Faces north; Homestead exempt
- Construction: Stucco construction; Metal roof; Crawlspace foundation
- Exterior features: Outdoor kitchen; Storage; Shed(s); Workshop
Interior
- Kitchen: Microwave; Range; Range hood; Refrigerator; Outdoor kitchen
- Bedrooms: 4 bedrooms
- Flooring: Tile; Wood
- Bathrooms: 2 full bathrooms
- Heating & cooling: Central heating (natural gas); Central air conditioning
- Interior features: Ceiling fans; Living room / dining room combo
- Laundry & utility: Laundry located outside
Neighborhood map
What this means for you Summary
Snapshot
- This is a 2-bed/1.0-bath manufactured listed at $180k.
Deal economics
- At list price, monthly cash flow is $146 ($2k/yr) — positive.
- The deal already cash-flows at list — no discount required.
- To meet the 1% rule (rent ≥ 1% of price), the offer needs to be $158k (12.1% below list).
- Recommended offer: $158k (12.1% below list) — sets the bar for 1% rule.
- Cap rate 7.3% vs local median 2.3% in Southeast Arcadia — top-decile yield for the area; either an underpriced asset or a hidden risk that comps aren't pricing in. Stress-test before assuming the spread holds.
Location & tenants
- Location reads 56/100 on livability (#864 in FL) — a working-class tenant base; expect higher turnover. Strengths: cost of living A+, housing A; Watch: crime C-, amenities F, commute F.
- Desoto (town): math 31% / reading 32% proficiency, ranked #69 of 73 in FL (top 94%) — families likely to look elsewhere, expect single-tenant / working-renter base with shorter leases; 71% free/reduced lunch — lower-income household profile, screen leases tightly.
- Zoned schools: Memorial Elementary School (math 45% / reading 35%, grade F, #1,491 of 2,144 statewide, top 70%, 793 students, 82% FRL); Desoto County High School (math 26% / reading 33%, grade F, #447 of 667 statewide, top 68%, 1,244 students, 67% FRL) — zoned schools at 74% FRL track the district average.
- Market conditions: 207 active listings in the ZIP; 71 units permitted in DeSoto County in 2024 (0 in 5+ unit buildings).
Forward outlook
- Local home prices are declining (-3.0%/yr); year-one equity from $1k of loan paydown is wiped out by about $5k of value loss. Plan a longer hold.
- DeSoto County population projected at -10% by 2050 — secular population decline; favor cash flow + early exit over multi-decade hold.
Negotiation context
- It's been on market 52 days — a 3% lower offer ($175k) is reasonable based on typical stale-listing flexibility.
- 5 sale attempts since 4y ago with the ask held roughly flat each time — persistent listings suggest the price (not the market) is what's stuck; bring a comps-based counter.
- Current owner paid $15k; list at $180k implies a 1100% gain — meaningful room to come down on a strong offer.
Risks & watch-outs
- Climate carrying-cost: severe wind risk, 99% chance of damaging wind over 30y; moderate wildfire risk; extreme-heat days projected 7→26/yr by 2055 (HVAC capex compounding) — expect insurance premiums to compound above CPI over the hold.
Questions for the listing agent
- It's been on market 52 days. Have you received any prior offers? Is the seller open to a 12% concession, seller financing, or rate buy-down credit?
- Built in 1978 — when were the roof, HVAC, electrical panel, plumbing, and water heater last replaced?
- Is there a deadline driving the sale (1031 exchange, divorce, estate, relocation)? That informs how much negotiation room exists.
- Schools are F-rated, which usually means shorter tenancies and higher turnover. Who's the typical renter profile here, and what's been the actual vacancy rate?
- The area grade is low — what's the realistic commute time and amenity access for the typical tenant pool here? Any planned neighborhood developments (good or bad) we should know about?
- What's the average days-on-market for RENTAL listings here right now (not sales)? A rising rental-DOM trend means longer vacancies and softer asking-rent achievability than the comps imply.
- What's the recent tenant-quality profile in this submarket — average credit score on applications, eviction rate, late-payment / NSF rate, and stable-employment percentage? A property-management company in the area should have these aggregated.
- How much new for-sale + rental construction is in the pipeline within 1–3 miles? Heavy new supply typically softens prices + rents 12–24 months out; constrained supply supports both.
Investment metrics
- 1% rule
- 0.88% ✗
- Cap rate
- 7.27%
- Cash-on-cash
- 3.48%
- DSCR
- 1.16
- GRM
- 9.5
CMA / ARV
No comps found within radius.
Projected returns pro-forma
-3.0% appreciation · 3.0% rent growth · sell at horizon
- IRR
- -10.9%
- Equity multiple
- 0.60×
- Total profit
- $-19,909
- Equity at exit
- $26,839
- IRR
- -1.6%
- Equity multiple
- 0.89×
- Total profit
- $-5,588
- Equity at exit
- $15,563
Cash invested: $50,400 (down + closing). Projections, not guarantees.
Landlord ↔ Tenant lean methodology
- Overall (STATE)
- 87 Strongly Landlord-Friendly
- State Florida
- 87 Strongly Landlord-Friendly · R+3
- County
- — inherits STATE
- City
- — inherits STATE
ZIP-level market 34266
- Home prices YoY
- -6.1%
- Active inventory
- 207
- Price-to-rent
- 9.5×
Monthly cashflow live
- Estimated rent
- $1,582 medium interval (Pro) →
- Mortgage (P&I)
- −$944
- Tax from tax record
- −$85 /mo · $1,014/yr
- Insurance
- −$75
- HOA
- −$0
- Vacancy / Maint / Mgmt
- −$332
- Net cashflow
- $146
Break-even live
UW: 25.0% down · 7.5% · 30yr · 1.5% tax · 5.0% vac · 8.0% maint · 8.0% mgmt
Financing live
Cash to close
- Down payment
- $45,000
- Closing costs
- $5,400
- Reserves months
- —
- Total cash needed
- —
Loan-product check · same deal, 3 products live
Conventional
25% down · 7.5% · 30yr
- Down + closing
- —
- Monthly P&I
- —
- Monthly cashflow
- —
- DSCR
- —
- Eligible?
- —
Personal DTI + credit; lowest rate.
DSCR
20% down · 8.5% · 30yr
- Down + closing
- —
- Monthly P&I
- —
- Monthly cashflow
- —
- DSCR
- —
- Eligible?
- —
No personal income docs; deal must DSCR.
Hard money
10% down · 12.0% · 12mo
- Down + closing
- —
- Monthly P&I
- —
- Monthly cashflow
- —
- DSCR
- —
- Eligible?
- —
Short-term bridge; refi at stabilization.
Listing history 26 events
-
2026-06-18days on market $180,000 Active 52 DOM
-
2026-06-17days on market $180,000 Active 51 DOM
-
2026-06-16days on market $180,000 Active 50 DOM
-
2026-06-15days on market $180,000 Active 49 DOM
-
2026-06-14days on market $180,000 Active 47 DOM
-
2026-06-13days on market $180,000 Active 46 DOM
-
2026-06-10days on market $180,000 Active 44 DOM
-
2026-06-09days on market $180,000 Active 43 DOM
-
2026-06-08days on market $180,000 Active 42 DOM
-
2026-06-07statusdays on market $180,000 Active 41 DOM
-
2026-05-22status Pending
-
2026-04-15$180,000 Active
-
2026-03-24historical
-
2026-01-23price $180,000
-
2026-01-08status Active
-
2026-01-08price $210,000
-
2025-08-24status Active
-
2025-08-12historical
-
2025-06-25price $220,000
-
2025-05-28price $240,000
-
2024-09-11price $250,000
-
2024-08-13$270,000 Active
-
2022-03-07status Pending
-
2022-02-01$210,000 Active
-
1997-08-18soldstatus $15,000
-
1988-12-07soldstatus $22,500
ⓘ Source: listings_history table (triggers on properties + properties_extension) + one-shot
backfill from property_details.listing_events for pre-trigger history.
Tax reassessment forecast FL · Resets to sale price
- Current annual tax
- $1,014 · $85/mo
- Projected year-2 tax
- $1,494 · $124/mo
- Expected delta
- +$480/yr (+$40/mo · 47.3%)
ⓘ Screening estimate from a state-policy table — verify with the county assessor before closing.
Climate risk First Street
- Flood 1/10 Low FEMA zone X (unshaded) · 0% chance over 30 yrs
- Wildfire 5/10 Major
- Heat 9/10 Extreme 7 d/yr ≥107°F today · 26 d/yr by 30 yrs out
- Wind 10/10 Extreme 99% chance of damaging wind over 30 yrs
- Air quality 2/10 Low 1 unhealthy d/yr today · 2 by 30 yrs out
Nearby sold comps map
Loading sold comps map…
Walkable amenities ~0.75 mi
Loading nearby amenities…
Taxation est. · year 1
- Rental income
- $18,984
- − Mortgage interest
- −$10,083
- − Property taxes
- −$1,014
- − Insurance
- −$900
- − Repairs & maintenance
- −$1,519
- − Management
- −$1,519
- − Depreciation
- −$5,236
- Taxable loss
- −$1,287
- Est. tax savings @ 24.0%
- +$309
- After-tax cash flow
- $2,065/yr
For passive investors: Depreciation is non-cash, so a rental often shows a tax loss while cash-flowing — sheltering income. Rental losses are passive: they offset passive income freely, and up to $25,000/yr can offset ordinary (W-2) income if you actively participate and your MAGI is under $100k (phasing out to $0 by $150k); unused losses carry forward. On sale, claimed depreciation is recaptured at up to 25%, and gains may owe capital-gains tax (a 1031 exchange can defer both). Figures are a year-1 estimate at your 24.0% rate — not tax advice; consult a CPA.
Schools (NCES district)
- District
- Desoto
- NCES district ID
- 1200420
- Math proficiency
- 31% ▼ -9.00%
- Reading proficiency
- 32% ▼ -3.00%
- Median HH income
- $35,136
- Composite
- 26.03/100
- National rank
- #7305
- State rank
- #69 of 73 in FL
Livability — Southeast Arcadia
- Score
- 56/100
- State rank
- #864
- US rank
- #22423
Category grades
Schools grade is shown separately in the Schools card above.
Census & demographics
- Population (ZIP)
- 29,065
Population outlook (DeSoto County) Hauer SSP2
- Today (2025)
- 34,958 people
- By 2030
- 34,465 · -1.4%
- By 2040
- 33,137 · -5.2%
- By 2050
- 31,273 · -10.5%
- By 2075
- 23,898 · -31.6%
- By 2100
- 15,517 · -55.6%
Race, ethnicity, and origin ACS 2023
- Neighborhood character
- Diverse neighborhood (Simpson 0.61)
- Race & ethnicity
- White 51% Hispanic / Latino 34% Black 13% Two or more races 11%
- Hispanic origin (detail)
- Mexican 26% Puerto Rican 2% Cuban 2%
- Common ancestry
- Lithuanian 2% Italian 2% Slovak 1%
- Foreign-born
- 15% · Canada
- Languages at home
- 76% English-only · Spanish 22% French/Haitian/Cajun 1%
Political lean MEDSL · DeSoto
- 2024 margin
- Solid R (+42.9) · D 28.2% · R 71.2%
- 2008→2024 swing
- -30.6pp toward R · 2008: -12.3pp · 2024: -42.9pp
- All cycles
- 2024: R+42.9 2020: R+32.0 2016: R+27.7 2012: R+14.3 2008: R+12.3
Not yet ingested
- Civics
- —
Market trends
- HPI YoY
- ▼ -26.01%
- Current HPI
- 403.1509
- Rent YoY
- —
- Metro
- —
- State GDP YoY
- ▲ 3.28%
- F500 in state
- 36
Industry mix (Fortune 500 HQ in FL)
| Industry | F500 HQs | Revenue |
|---|---|---|
| Industrial Technology | 2 | $29B |
|
||
| Insurance | 2 | $17B |
|
||
| Retail | 1 | $60B |
|
||
| Technology Distribution | 1 | $58B |
|
||
| Homebuilding | 1 | $35B |
|
||
| Technology Manufacturing | 1 | $35B |
|
||
Price history
+700.0% since first listed16 events — show timeline
- 2026-05-22 Pending — Stellar MLS as Distributed by MLS Grid
- 2026-04-15 Listed $180,000 Stellar MLS as Distributed by MLS Grid
- 2026-03-24 Listing Removed — Stellar MLS as Distributed by MLS Grid
- 2026-01-23 Price Changed $180,000 Stellar MLS as Distributed by MLS Grid
- 2026-01-08 Relisted — Stellar MLS as Distributed by MLS Grid
- 2026-01-08 Price Changed $210,000 Stellar MLS as Distributed by MLS Grid
- 2025-08-24 Relisted — Stellar MLS as Distributed by MLS Grid
- 2025-08-12 Listing Removed — Stellar MLS as Distributed by MLS Grid
- 2025-06-25 Price Changed $220,000 Stellar MLS as Distributed by MLS Grid
- 2025-05-28 Price Changed $240,000 Stellar MLS as Distributed by MLS Grid
- 2024-09-11 Price Changed $250,000 Stellar MLS as Distributed by MLS Grid
- 2024-08-13 Listed $270,000 Stellar MLS as Distributed by MLS Grid
- 2022-03-07 Pending — Stellar MLS as Distributed by MLS Grid
- 2022-02-01 Listed $210,000 Stellar MLS as Distributed by MLS Grid
- 1997-08-18 Sold (Public Records) $15,000 Public Records
- 1988-12-07 Sold (Public Records) $22,500 Public Records
Property tax history
+1.4%/yrLatest (2025): $1,014 · +7.9% YoY. Source: county tax records.
Cash-flow waterfall
monthlySold comps — $/sqft
last 12 mo · ≤1 miLoading sold comps…