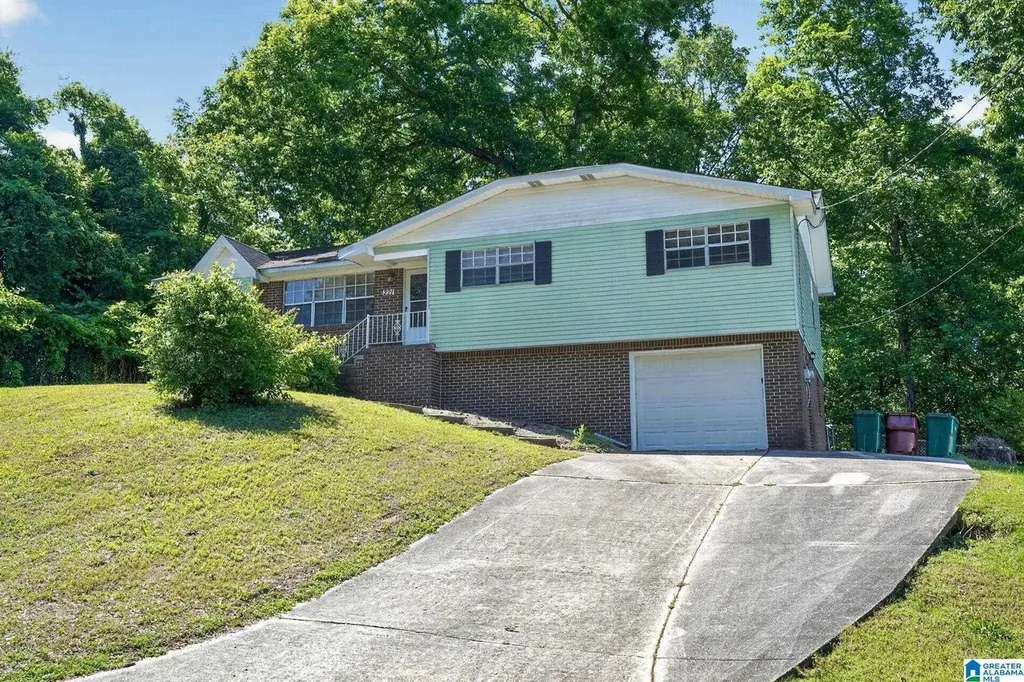
221 Jupiter Dr · Pinson, AL
Flood risk 1/10 · Minimal
- FEMA flood zone
- X (unshaded)
- Chance of flooding over 30 yrs
- 0.0%
- Est. flood insurance / yr
- $473 – $860
Fire risk 3/10 · Minor
- Est. fire insurance / yr
- $916 – $1,700
Heat risk 5/10 · Moderate
- Hot days now (above 106°F)
- 7 days/yr
- Hot days in 30 yrs
- 19 days/yr
Wind risk 6/10 · Moderate
- Chance of severe wind over 30 yrs
- 27.0%
Air-quality risk 5/10 · Moderate
- Unhealthy air days now
- 6 days/yr
- Unhealthy air days in 30 yrs
- 11 days/yr
Risk factors via First Street. Map © Google.
Why this score? — see what drove the C grade
The composite is a weighted blend of 9 inputs, each scored 0–100. Each bar is that input's sub-score; the figure is the points it added to the 100-point composite (weight × sub-score).
- Cash flow +20.0/30.0
- ARV discount +15.0/15.0
- DSCR +6.4/10.0
- 1% rule +4.6/10.0
- Rent growth +3.3/5.0
- Livability +3.0/5.0
- Condition / age +2.5/5.0
- Schools +1.8/10.0
- Appreciation +0.0/10.0
$169,900
🖨 Deal sheet (PDF) 📄 Offer letter ✓ Due diligence
Listing remarks
Discover this classic 3-bedroom, 2-bathroom ranch-style home in the established Astro World community! Boasting nearly 2,000 sq. ft. of living space, this 1973 gem offers the perfect blend of comfort and potential. The main level features a spacious living area, a functional kitchen, and three well-appointed bedrooms. Downstairs, the full basement provides incredible flexibility, featuring a cozy den with a wood-burning fireplace and ample room for a workshop or storage alongside the basement-level garage. Enjoy outdoor living on the rear patio overlooking a generous 0.28-acre lot.
Key facts
- Ranch-style home
- Full basement
- Rear patio
Tags
Property features AI
Finance
- Other: Parcel ID 12-00-06-3-004-018.000; Lot size approximately 0.28 acres; Subdivision: ASTRO WORLD
- HOA & community: No association fee
Exterior
- Parking: Attached garage with side entry; 1 total garage space (located at basement level)
- Utilities: Public water; Connected sewer; Internet service available; Gas water heater
- Home design: Existing property; Basement foundation; Brick over foundation with vinyl siding
- Construction: Brick over foundation; Vinyl siding
- Exterior features: Open patio; Garden/Patio; Open deck; Interior lot in a subdivision; Not waterfront; No pool
Interior
- Kitchen: Dishwasher (built-in); Electric and gas stove; Laminate countertops; Pantry
- Bedrooms: Master bedroom (Level 1); Additional bedrooms on Level 1
- Flooring: Carpet; Hardwood laminate
- Bathrooms: Two full bathrooms; Tub/shower combos
- Heating & cooling: Central heating (gas); Central electric cooling
- Interior features: Smooth ceilings; Woodburning fireplace with insert in the den; Pantry
- Laundry & utility: Laundry room in the basement; Washer hookup; Electric dryer hookup; Gas water heater
Neighborhood map
What this means for you Summary
Snapshot
- This is a 3-bed/2.0-bath single-family listed at $170k.
Deal economics
- At list price, monthly cash flow is $210 ($3k/yr) — positive.
- The deal already cash-flows at list — no discount required.
- To meet the 1% rule (rent ≥ 1% of price), the offer needs to be $163k (3.8% below list).
- Recommended offer: $163k (3.8% below list) — sets the bar for 1% rule.
- Cap rate 7.8% vs local median 5.3% in Pinson — top-decile yield for the area; either an underpriced asset or a hidden risk that comps aren't pricing in. Stress-test before assuming the spread holds.
Location & tenants
- Location reads 60/100 on livability (#289 in AL) — a middle-class / working-renter tenant base. Strengths: cost of living A+, housing A+, crime B+; Watch: amenities F, commute F, health & safety F.
- Jefferson County (suburban): math 9% / reading 32% proficiency, ranked #104 of 129 in AL (top 81%) — low school quality limits family demand, transient renter base, plan for 1-2y turnover.
- Zoned schools: Center Point Elementary School (618 students, 82% FRL); Center Point High School (math 2% / reading 2%, grade F, #291 of 305 statewide, top 100%, 774 students, 91% FRL) — zoned schools average 86% FRL vs 49% district-wide (38 pts higher); higher-poverty schools than district average — tighter screening recommended.
- Zoned-school proficiency averages 2% at this address vs 20% district-wide (-18 pts) — the specific schools serving this property underperform the Jefferson County average; the district grade overstates school quality for this exact location.
- Market conditions: Rents rising (+3.0%/yr); 334 active listings in the ZIP; 18 comparable units currently listed for rent nearby; rentals at typical pace (median 24d on market — plan ~3-4 weeks tenant-placement turnaround); 2,114 units permitted in Jefferson County in 2024 (556 in 5+ unit buildings).
- This rent runs 37% of the median local income ($53k/yr) — at the standard rent-burdened threshold; future hikes will face affordability resistance.
Forward outlook
- Local home prices are declining (-3.0%/yr); year-one equity from $1k of loan paydown is wiped out by about $5k of value loss. Plan a longer hold.
- Jefferson County population projected to shrink 4% by 2050 — rents likely to lag national; underwrite the cash flow, not the appreciation.
Negotiation context
- It's been on market 35 days — a 3% lower offer ($165k) is reasonable based on typical stale-listing flexibility.
Risks & watch-outs
- Climate carrying-cost: major wind risk, 27% chance of damaging wind over 30y; extreme-heat days projected 7→19/yr by 2055 (HVAC capex compounding) — expect insurance premiums to compound above CPI over the hold.
Questions for the listing agent
- It's been on market 35 days. Have you received any prior offers? Is the seller open to a 4% concession, seller financing, or rate buy-down credit?
- Built in 1973 — when were the roof, HVAC, electrical panel, plumbing, and water heater last replaced?
- Is there a deadline driving the sale (1031 exchange, divorce, estate, relocation)? That informs how much negotiation room exists.
- Schools are D-rated, which usually means shorter tenancies and higher turnover. Who's the typical renter profile here, and what's been the actual vacancy rate?
- What's the average days-on-market for RENTAL listings here right now (not sales)? A rising rental-DOM trend means longer vacancies and softer asking-rent achievability than the comps imply.
- What's the recent tenant-quality profile in this submarket — average credit score on applications, eviction rate, late-payment / NSF rate, and stable-employment percentage? A property-management company in the area should have these aggregated.
- How much new for-sale + rental construction is in the pipeline within 1–3 miles? Heavy new supply typically softens prices + rents 12–24 months out; constrained supply supports both.
Investment metrics
- 1% rule
- 0.96% ✗
- Cap rate
- 7.77%
- Cash-on-cash
- 5.29%
- DSCR
- 1.24
- GRM
- 8.7
CMA / ARV
- ARV (median comp)
- $205,325
- List price
- $169,900
- Delta
- -17.25%
- Verdict
- UNDERPRICED
- Comps
- 20 within 1.0 mi
Show comp detail 12 sales within ~0.75 mi
| Address | Dist | Beds/Ba | Sqft | Sold | Price | $/sf | Match |
|---|---|---|---|---|---|---|---|
| 201 Jupiter Dr | 0.09mi | 3/2.0 | 1,963 (-1%) | 17mo | $162,500 | $83 | 80 |
| 245 Jupiter Dr | 0.09mi | 4/2.5 (+1) | 1,907 (-4%) | 18mo | $164,000 | $86 | 68 |
| 301 Westchester Dr | 0.50mi | 3/2.0 | 2,082 (+5%) | 16mo | $185,000 | $89 | 56 |
| 315 40th Ave NE | 0.70mi | 3/2.0 | 1,905 (-4%) | 7mo | $215,000 | $113 | 55 |
| 2926 2nd Pl NW | 0.40mi | 4/2.5 (+1) | 1,818 (-8%) | 9mo | $225,000 | $124 | 53 |
| 3041 Carleton Rd | 0.47mi | 4/2.0 (+1) | 2,156 (+8%) | 11mo | $265,000 | $123 | 50 |
| 466 Westchester Dr | 0.57mi | 3/2.5 | 1,800 (-9%) | 14mo | $186,000 | $103 | 44 |
| 2809 2nd Pl NW | 0.68mi | 3/2.0 | 1,839 (-7%) | 15mo | $215,000 | $117 | 44 |
| 434 Westchester Dr | 0.54mi | 4/2.0 (+1) | 1,740 (-12%) | 9mo | $174,000 | $100 | 41 |
| 2801 3rd St NW | 0.66mi | 3/2.0 | 1,720 (-13%) | 19mo | $161,450 | $94 | 31 |
| 4062 Hickory Dr NW | 0.73mi | 3/2.0 | 2,188 (+10%) | 24mo | $190,000 | $87 | 29 |
| 2816 2nd St NW | 0.67mi | 4/2.0 (+1) | 1,792 (-10%) | 22mo | $225,000 | $126 | 29 |
Match score weights: distance 35% · size 25% · config 20% · recency 20%. Top-matched comps best support the ARV.
Projected returns pro-forma
-3.0% appreciation · 3.04% rent growth · sell at horizon
- IRR
- -8.1%
- Equity multiple
- 0.70×
- Total profit
- $-14,148
- Equity at exit
- $25,333
- IRR
- 1.5%
- Equity multiple
- 1.11×
- Total profit
- $5,010
- Equity at exit
- $14,690
Cash invested: $47,572 (down + closing). Projections, not guarantees.
Landlord ↔ Tenant lean methodology
- Overall (STATE)
- 90 Strongly Landlord-Friendly
- State Alabama
- 90 Strongly Landlord-Friendly · R+15
- County
- — inherits STATE
- City
- — inherits STATE
ZIP-level market 35215
- Home prices YoY
- -34.4%
- Rents YoY
- 3.0%
- Active inventory
- 334
- Price-to-rent
- 8.7×
Monthly cashflow live
- Estimated rent
- $1,635 high interval (Pro) →
- Mortgage (P&I)
- −$891
- Tax from tax record
- −$120 /mo · $1,443/yr
- Insurance
- −$71
- HOA
- −$0
- Vacancy / Maint / Mgmt
- −$343
- Net cashflow
- $210
Break-even live
Sensitivity live
| Price | -10% $306 | -5% $258 | +0% $210 | +5% $162 | +10% $113 |
|---|---|---|---|---|---|
| Rent | -10% $80 | -5% $145 | +0% $210 | +5% $274 | +10% $339 |
| Rate | -1.0pp $295 | -0.5pp $253 | base $210 | +0.5pp $166 | +1.0pp $121 |
UW: 25.0% down · 7.5% · 30yr · 1.5% tax · 5.0% vac · 8.0% maint · 8.0% mgmt
Financing live
Cash to close
- Down payment
- $42,475
- Closing costs
- $5,097
- Reserves months
- —
- Total cash needed
- —
Loan-product check · same deal, 3 products live
Conventional
25% down · 7.5% · 30yr
- Down + closing
- —
- Monthly P&I
- —
- Monthly cashflow
- —
- DSCR
- —
- Eligible?
- —
Personal DTI + credit; lowest rate.
DSCR
20% down · 8.5% · 30yr
- Down + closing
- —
- Monthly P&I
- —
- Monthly cashflow
- —
- DSCR
- —
- Eligible?
- —
No personal income docs; deal must DSCR.
Hard money
10% down · 12.0% · 12mo
- Down + closing
- —
- Monthly P&I
- —
- Monthly cashflow
- —
- DSCR
- —
- Eligible?
- —
Short-term bridge; refi at stabilization.
Rent comps 18 comps
| Address | Beds | Baths | Sqft | Rent | $/sqft | DOM | Units | Dist |
|---|---|---|---|---|---|---|---|---|
| 3814 Mars Ave Center Point, AL | 4.0 | 2.0 | 2063 | $1,890 | $0.92 | 44d | 1 | 0.08mi |
| 5992 Princess Blvd Birmingham, AL | 3.0 | 2.0 | 1454 | $1,661 | $1.14 | 44d | 1 | 0.36mi |
| 202 Westchester Dr Birmingham, AL | 4.0 | 2.0 | 1374 | $1,300 | $0.95 | 24d | 1 | 0.37mi |
| 345 Saint John Rd NW Birmingham, AL | 3.0 | 2.0 | 2142 | $1,731 | $0.81 | 3d | 1 | 0.52mi |
| 212 Saint John Dr NW Birmingham, AL | 2.0 | 2.0 | 1445 | $1,423 | $0.98 | 15d | 1 | 0.53mi |
| 340 40th Ave NE Center Point, AL | 3.0 | 2.0 | 2007 | $1,650 | $0.82 | 16d | 1 | 0.80mi |
| 127 Fox Hill Ct Center Point, AL | 3.0 | 2.0 | 1418 | $1,545 | $1.09 | 44d | 1 | 0.91mi |
| 408 Sunhill Rd NW Center Point, AL | 3.0 | 1.5 | 1290 | $1,355 | $1.05 | 44d | 1 | 1.08mi |
| 532 26th Ave NW Center Point, AL | 4.0 | 1.0 | 1644 | $1,250 | $0.76 | 44d | 1 | 1.15mi |
| 3104 Cobblestone Dr Birmingham, AL | 3.0 | 1.5 | 1533 | $1,516 | $0.99 | 3d | 1 | 1.21mi |
| 4246 Centerwood Dr Birmingham, AL | 3.0 | 2.0 | 1336 | $1,450 | $1.09 | 16d | 1 | 1.22mi |
| 2416 4th St NW Center Point, AL | 4.0 | 2.0 | 1400 | $1,500 | $1.07 | 24d | 1 | 1.25mi |
| 2655 6th St NE Center Point, AL | 3.0 | 2.0 | 1600 | $1,390 | $0.87 | 3d | 1 | 1.26mi |
| 605 Country View Dr Birmingham, AL | 3.0 | 2.0 | 1698 | $1,560 | $0.92 | 44d | 1 | 1.28mi |
| 607 Country View Dr Birmingham, AL | 4.0 | 2.0 | 1568 | $1,550 | $0.99 | 24d | 1 | 1.29mi |
| 2708 7th St NE Center Point, AL | 3.0 | 1.0 | 1451 | $1,150 | $0.79 | 44d | 1 | 1.44mi |
| 1104 Oak Creek Trl NE Birmingham, AL | 3.0 | 2.0 | 1233 | $1,543 | $1.25 | 2d | 1 | 1.45mi |
| 3005 Sweeney Hollow Pl Birmingham, AL | 3.0 | 2.0 | 2014 | $1,325 | $0.66 | 15d | 1 | 1.45mi |
Listing history 20 events
-
2026-06-18days on market $169,900 Active 35 DOM
-
2026-06-17days on market $169,900 Active 34 DOM
-
2026-06-16days on market $169,900 Active 33 DOM
-
2026-06-15days on market $169,900 Active 32 DOM
-
2026-06-13days on market $169,900 Active 30 DOM
-
2026-06-10days on market $169,900 Active 27 DOM
-
2026-06-09days on market $169,900 Active 26 DOM
-
2026-06-08days on market $169,900 Active 25 DOM
-
2026-06-07days on market $169,900 Active 24 DOM
-
2026-06-03days on market $169,900 Active 20 DOM
-
2026-06-02days on market $169,900 Active 19 DOM
-
2026-06-01days on market $169,900 Active 18 DOM
-
2026-05-31days on market $169,900 Active 17 DOM
-
2026-05-14$169,900 Active 588-char remark
-
2024-03-12soldstatus $3,442,500
-
2016-04-29soldstatus $1,224,000
-
2016-04-29soldstatus $15,394,150
-
2015-11-04soldstatus $56,000
-
1998-03-24soldstatus $84,900
-
1992-05-05soldstatus $71,377
ⓘ Source: listings_history table (triggers on properties + properties_extension) + one-shot
backfill from property_details.listing_events for pre-trigger history.
Tax reassessment forecast AL · Resets to sale price
- Current annual tax
- $1,443 · $120/mo
- Projected year-2 tax
- $1,443 · $120/mo
- Expected delta
- $0/yr ($0/mo · 0.0%)
ⓘ Screening estimate from a state-policy table — verify with the county assessor before closing.
Climate risk First Street
- Flood 1/10 Low FEMA zone X (unshaded) · 0% chance over 30 yrs
- Wildfire 3/10 Moderate
- Heat 5/10 Major 7 d/yr ≥106°F today · 19 d/yr by 30 yrs out
- Wind 6/10 Major 27% chance of damaging wind over 30 yrs
- Air quality 5/10 Major 6 unhealthy d/yr today · 11 by 30 yrs out
Nearby sold comps map
Loading sold comps map…
Walkable amenities ~0.75 mi
Loading nearby amenities…
Taxation est. · year 1
- Rental income
- $19,619
- − Mortgage interest
- −$9,517
- − Property taxes
- −$1,443
- − Insurance
- −$850
- − Repairs & maintenance
- −$1,570
- − Management
- −$1,570
- − Depreciation
- −$4,943
- Taxable loss
- −$272
- Est. tax savings @ 24.0%
- +$65
- After-tax cash flow
- $2,580/yr
For passive investors: Depreciation is non-cash, so a rental often shows a tax loss while cash-flowing — sheltering income. Rental losses are passive: they offset passive income freely, and up to $25,000/yr can offset ordinary (W-2) income if you actively participate and your MAGI is under $100k (phasing out to $0 by $150k); unused losses carry forward. On sale, claimed depreciation is recaptured at up to 25%, and gains may owe capital-gains tax (a 1031 exchange can defer both). Figures are a year-1 estimate at your 24.0% rate — not tax advice; consult a CPA.
Schools (NCES district)
- District
- Jefferson County
- NCES district ID
- 0101920
- Math proficiency
- 9% ▼ -24.00%
- Reading proficiency
- 32% ▼ -5.00%
- Median HH income
- $51,712
- Composite
- 18.4/100
- National rank
- #8937
- State rank
- #104 of 129 in AL
Livability — Pinson
- Score
- 60/100
- State rank
- #289
- US rank
- #18763
Category grades
Schools grade is shown separately in the Schools card above.
Census & demographics
- Census place
- Pinson, AL
- County
- Jefferson County · 527,445 people
- City population
- 22,599
- Metro
- Birmingham-Hoover, AL
- Population (ZIP)
- 43,903
- Household income
- $52,793
- Rent vs Own
- Severe rent burden
- 1729.0
Population outlook (Jefferson County) Hauer SSP2
- Today (2025)
- 669,185 people
- By 2030
- 669,694 · +0.1%
- By 2040
- 661,388 · -1.2%
- By 2050
- 643,086 · -3.9%
- By 2075
- 577,267 · -13.7%
- By 2100
- 474,758 · -29.1%
Race, ethnicity, and origin ACS 2023
- Neighborhood character
- Predominantly Black (75%)
- Race & ethnicity
- Black 75% White 15% Hispanic / Latino 7% Two or more races 3%
- Hispanic origin (detail)
- Mexican 4%
- Common ancestry
- Lithuanian 1% Italian 1% Slovak 1%
- Foreign-born
- 4% · Canada
- Languages at home
- 92% English-only · Spanish 7%
Political lean MEDSL · Jefferson
- 2024 margin
- D (+10.4) · D 54.6% · R 44.2% · Other 1.2%
- 2008→2024 swing
- +5.4pp toward D · 2008: 5.1pp · 2024: 10.4pp
- All cycles
- 2024: D+10.4 2020: D+13.2 2016: D+7.2 2012: D+6.0 2008: D+5.1
Not yet ingested
- Civics
- —
Market trends
- HPI YoY
- ▼ -112.97%
- Current HPI
- 215.0607
- Rent YoY
- ▲ 3.04%
- Metro
- Birmingham-Hoover, AL
- State GDP YoY
- ▲ 2.94%
- F500 in state
- 4
Industry mix (Fortune 500 HQ in AL)
| Industry | F500 HQs | Revenue |
|---|---|---|
| Financial Services | 1 | $8B |
|
||
| Healthcare | 1 | $5B |
|
||
Price history
+138.0% since first listed7 events — show timeline
- 2026-05-14 Listed $169,900 Greater Alabama MLS
- 2024-03-12 Sold (Public Records) $3,442,500 Public Records
- 2016-04-29 Sold (Public Records) $15,394,150 Public Records
- 2016-04-29 Sold (Public Records) $1,224,000 Public Records
- 2015-11-04 Sold (Public Records) $56,000 Public Records
- 1998-03-24 Sold (Public Records) $84,900 Public Records
- 1992-05-05 Sold (Public Records) $71,377 Public Records
Property tax history
+6.1%/yrLatest (2025): $1,443 · +0.0% YoY. Source: county tax records.
Cash-flow waterfall
monthlySold comps — $/sqft
last 12 mo · ≤1 miLoading sold comps…