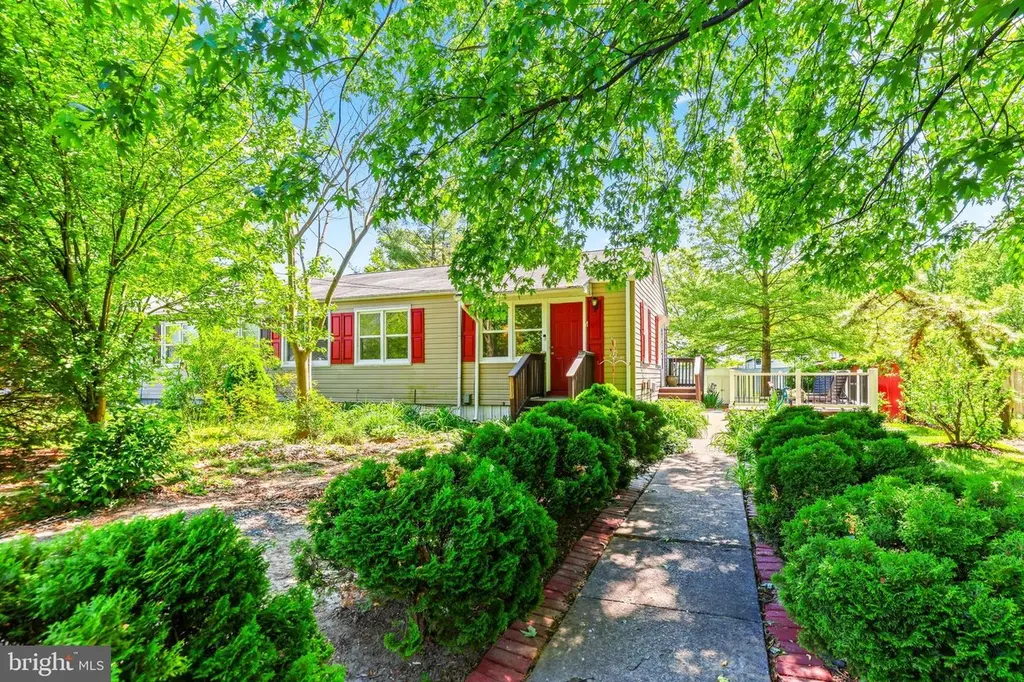
66 Liberty St · Aberdeen, MD
Flood risk 1/10 · Minimal
- FEMA flood zone
- X (unshaded)
- Chance of flooding over 30 yrs
- 0.0%
- Est. flood insurance / yr
- $507 – $1,088
Fire risk 2/10 · Minimal
- Est. fire insurance / yr
- $755 – $1,403
Heat risk 7/10 · Major
- Hot days now (above 104°F)
- 7 days/yr
- Hot days in 30 yrs
- 15 days/yr
Wind risk 6/10 · Moderate
- Chance of severe wind over 30 yrs
- 27.0%
Air-quality risk 3/10 · Minor
- Unhealthy air days now
- 2 days/yr
- Unhealthy air days in 30 yrs
- 3 days/yr
Risk factors via First Street. Map © Google.
Why this score? — see what drove the C- grade
The composite is a weighted blend of 9 inputs, each scored 0–100. Each bar is that input's sub-score; the figure is the points it added to the 100-point composite (weight × sub-score).
- Cash flow +24.2/30.0
- DSCR +7.8/10.0
- 1% rule +5.2/10.0
- Livability +4.0/5.0
- Schools +2.9/10.0
- Rent growth +2.6/5.0
- Condition / age +2.5/5.0
- ARV discount +2.2/15.0
- Appreciation +0.0/10.0
$200,000
🖨 Deal sheet 📄 Offer letter ✓ Due diligence
Listing remarks
Welcome to 66 Liberty Street in Swan Meadows. This four bedroom, one and a half bath home offers the ease of true one level living with a layout that is both functional and inviting. The primary bedroom features its own en suite, a rare find! The home features a spacious backyard, side deck for outdoor dining or relaxing, and a storage shed for added convenience. Whether you enjoy gardening, entertaining, or simply having extra outdoor space, this property offers flexibility to fit your lifestyle. An excellent opportunity for first time buyers, downsizers, or investors looking to add to their portfolio. A rare find in the neighborhood with strong potential and everyday comfort. Deck is 2 y
Key facts
- Parking
- Built 1941
- Listed 8 days
Property features AI
Exterior
- Parking: Driveway parking (1 space); Total of 1 garage/parking space
- Utilities: Public water; Public sewer
- Home design: Semi-detached property; Vinyl siding
- Construction: Vinyl siding construction; Crawl space foundation; Above-grade and below-grade structures noted
- Exterior features: Tidal water: no
Interior
- Bedrooms: Four bedrooms on the main level
- Bathrooms: One full bathroom; One half bathroom
- Heating & cooling: Central heating (electric); Central air conditioning (electric); Natural gas hot water
- Interior features: No basement; Living area data from assessor
Neighborhood map
What this means for you Summary
Snapshot
- This is a 4-bed/1.5-bath townhouse listed at $200k.
Deal economics
- At list price, monthly cash flow is $401 ($5k/yr) — positive.
- The deal already cash-flows at list — no discount required.
- Meets the 1% rule at list price ($2k rent vs $200k).
- Cap rate 8.7% vs local median 4.9% in Aberdeen — top-decile yield for the area; either an underpriced asset or a hidden risk that comps aren't pricing in. Stress-test before assuming the spread holds.
Location & tenants
- Location reads 81/100 on livability (#42 in MD, #1,545 nationally) — a professional / high-income tenant draw. Strengths: commute A+, housing A+, health & safety A+; Watch: schools C-, crime F.
- Harford County Public Schools (suburban): math 22% / reading 39% proficiency, ranked #9 of 24 in MD (top 38%) — families likely to look elsewhere, expect single-tenant / working-renter base with shorter leases.
- Market conditions: Rents flat; 186 active listings in the ZIP; 6 comparable units currently listed for rent nearby; rentals at typical pace (median 24d on market — plan ~3-4 weeks tenant-placement turnaround); solid renter incomes; 803 units permitted in Harford County in 2024 (26 in 5+ unit buildings).
Forward outlook
- Local home prices are declining (-3.0%/yr); year-one equity from $1k of loan paydown is wiped out by about $6k of value loss. Plan a longer hold.
Negotiation context
- Only 8 days on market — expect competitive offers; lowballing is unlikely to land.
- 7 sale attempts since 21y ago with the ask held roughly flat each time — persistent listings suggest the price (not the market) is what's stuck; bring a comps-based counter.
Risks & watch-outs
- Watch-outs: built in 1941 — expect roof / HVAC / electrical / plumbing capex.
- Climate carrying-cost: major wind risk, 27% chance of damaging wind over 30y; extreme-heat days projected 7→15/yr by 2055 (HVAC capex compounding) — expect insurance premiums to compound above CPI over the hold.
Questions for the listing agent
- Built in 1941 — when were the roof, HVAC, electrical panel, plumbing, and water heater last replaced?
- Is there a deadline driving the sale (1031 exchange, divorce, estate, relocation)? That informs how much negotiation room exists.
- Crime grade is F in this area — have there been break-ins, vandalism, or insurance claims at this property in the last 3 years? What carrier currently insures it and at what premium?
- What's the average days-on-market for RENTAL listings here right now (not sales)? A rising rental-DOM trend means longer vacancies and softer asking-rent achievability than the comps imply.
- What's the recent tenant-quality profile in this submarket — average credit score on applications, eviction rate, late-payment / NSF rate, and stable-employment percentage? A property-management company in the area should have these aggregated.
- How much new for-sale + rental construction is in the pipeline within 1–3 miles? Heavy new supply typically softens prices + rents 12–24 months out; constrained supply supports both.
Investment metrics
- 1% rule
- 1.02% ✓
- Cap rate
- 8.70%
- Cash-on-cash
- 8.59%
- DSCR
- 1.38
- GRM
- 8.1
CMA / ARV
- ARV (median comp)
- $179,003
- List price
- $200,000
- Delta
- 11.73%
- Verdict
- OVERPRICED
- Comps
- 20 within 1.0 mi
Show comp detail 5 sales within ~0.75 mi
| Address | Dist | Beds/Ba | Sqft | Sold | Price | $/sf | Match |
|---|---|---|---|---|---|---|---|
| 66 Liberty St | 0.00mi | 4/1.5 | 984 (0%) | 0mo | $195,000 | $198 | 100 |
| 70 Swan St | 0.18mi | 3/2.0 (-1) | 924 (-6%) | 0mo | $175,000 | $189 | 74 |
| 9 Defense Dr | 0.35mi | 3/2.0 (-1) | 924 (-6%) | 4mo | $194,000 | $210 | 63 |
| 56 Aberdeen Ave | 0.15mi | 3/2.0 (-1) | 840 (-15%) | 9mo | $210,000 | $250 | 54 |
| 9 Liberty St | 0.24mi | 3/2.0 (-1) | 1,068 (+8%) | 20mo | $195,000 | $183 | 51 |
Match score weights: distance 35% · size 25% · config 20% · recency 20%. Top-matched comps best support the ARV.
Projected returns pro-forma
-3.0% appreciation · 0.28% rent growth · sell at horizon
- IRR
- -6.1%
- Equity multiple
- 0.78×
- Total profit
- $-12,407
- Equity at exit
- $29,821
- IRR
- 0.2%
- Equity multiple
- 1.01×
- Total profit
- $592
- Equity at exit
- $17,292
Cash invested: $56,000 (down + closing). Projections, not guarantees.
Landlord ↔ Tenant lean methodology
- Overall (STATE)
- 27 Tenant-Leaning
- State Maryland
- 27 Tenant-Leaning · D+14
- County
- — inherits STATE
- City
- — inherits STATE
ZIP-level market 21001
- Home prices YoY
- -30.5%
- Rents YoY
- 0.3%
- Active inventory
- 186
- Price-to-rent
- 8.1×
Monthly cashflow live
- Estimated rent
- $2,045 high interval (Pro) →
- Mortgage (P&I)
- −$1,049
- Tax from tax record
- −$83 /mo · $996/yr
- Insurance
- −$83
- HOA
- −$0
- Vacancy / Maint / Mgmt
- −$430
- Net cashflow
- $401
Break-even live
UW: 25.0% down · 7.5% · 30yr · 1.5% tax · 5.0% vac · 8.0% maint · 8.0% mgmt
Financing live
Cash to close
- Down payment
- $50,000
- Closing costs
- $6,000
- Reserves months
- —
- Total cash needed
- —
Loan-product check · same deal, 3 products live
Conventional
25% down · 7.5% · 30yr
- Down + closing
- —
- Monthly P&I
- —
- Monthly cashflow
- —
- DSCR
- —
- Eligible?
- —
Personal DTI + credit; lowest rate.
DSCR
20% down · 8.5% · 30yr
- Down + closing
- —
- Monthly P&I
- —
- Monthly cashflow
- —
- DSCR
- —
- Eligible?
- —
No personal income docs; deal must DSCR.
Hard money
10% down · 12.0% · 12mo
- Down + closing
- —
- Monthly P&I
- —
- Monthly cashflow
- —
- DSCR
- —
- Eligible?
- —
Short-term bridge; refi at stabilization.
Rent comps 6 comps
| Address | Beds | Baths | Sqft | Rent | $/sqft | DOM | Units | Dist |
|---|---|---|---|---|---|---|---|---|
| 70 Swan St Aberdeen, MD | 3.0 | 2.0 | 924 | $1,715 | $1.86 | 4d | 1 | 0.18mi |
| 27 E Bel Air Ave Unit 1 Aberdeen, MD | 3.0 | 1.0 | 923 | $1,750 | $1.90 | 43d | 1 | 0.63mi |
| 27 E Bel Air Ave Apt 2 Aberdeen, MD | 3.0 | 1.0 | 944 | $1,550 | $1.64 | 43d | 1 | 0.63mi |
| 104 S Parke St Aberdeen, MD | 3.0 | 1.5 | 900 | $1,700 | $1.89 | 23d | 1 | 0.71mi |
| 742 Nottingham Dr Aberdeen, MD | 3.0 | 1.0 | 1084 | $2,200 | $2.03 | 4d | 1 | 1.07mi |
| 686 Holly Cir Aberdeen, MD | 2.0–3.0 | 1.0 | 1150 | $1,600 | $1.39 | 1d | 1 | 1.17mi |
Listing history 18 events
-
2026-05-14status Pending 801-char remark
-
2026-05-06$200,000 Active 801-char remark
-
2026-05-05historical $200,000 801-char remark
-
2024-05-02historical $1,800
-
2024-04-07$1,800
-
2016-11-08historical
-
2016-11-08historical Withdrawn
-
2016-09-19price
-
2016-07-11Active
-
2016-07-11$124,900
-
2007-01-09soldstatus $146,450
-
2006-11-09historical
-
2006-08-04$146,900
-
2006-05-11historical
-
2006-05-02historical
-
2006-02-13
-
2005-10-17
-
2004-05-27soldstatus $3,876,000
ⓘ Source: listings_history table (triggers on properties + properties_extension) + one-shot
backfill from property_details.listing_events for pre-trigger history.
Tax reassessment forecast MD · Partial reset (capped growth)
- Current annual tax
- $996 · $83/mo
- Projected year-2 tax
- $1,588 · $132/mo
- Expected delta
- +$592/yr (+$49/mo · 59.5%)
ⓘ Screening estimate from a state-policy table — verify with the county assessor before closing.
Climate risk First Street
- Flood 1/10 Low FEMA zone X (unshaded) · 0% chance over 30 yrs
- Wildfire 2/10 Low
- Heat 7/10 Severe 7 d/yr ≥104°F today · 15 d/yr by 30 yrs out
- Wind 6/10 Major 27% chance of damaging wind over 30 yrs
- Air quality 3/10 Moderate 2 unhealthy d/yr today · 3 by 30 yrs out
Nearby sold comps map
Loading sold comps map…
Walkable amenities ~0.75 mi
Loading nearby amenities…
Taxation est. · year 1
- Rental income
- $24,545
- − Mortgage interest
- −$11,203
- − Property taxes
- −$996
- − Insurance
- −$1,000
- − Repairs & maintenance
- −$1,964
- − Management
- −$1,964
- − Depreciation
- −$5,818
- Taxable income
- $1,601
- Est. tax owed @ 24.0%
- −$384
- After-tax cash flow
- $4,425/yr
For passive investors: Depreciation is non-cash, so a rental often shows a tax loss while cash-flowing — sheltering income. Rental losses are passive: they offset passive income freely, and up to $25,000/yr can offset ordinary (W-2) income if you actively participate and your MAGI is under $100k (phasing out to $0 by $150k); unused losses carry forward. On sale, claimed depreciation is recaptured at up to 25%, and gains may owe capital-gains tax (a 1031 exchange can defer both). Figures are a year-1 estimate at your 24.0% rate — not tax advice; consult a CPA.
Schools (NCES district)
- District
- Harford County Public Schools
- NCES district ID
- 2400390
- Math proficiency
- 22% ▼ -23.00%
- Reading proficiency
- 39% ▼ -12.00%
- Median HH income
- $79,569
- Composite
- 29.38/100
- National rank
- #6527
- State rank
- #9 of 24 in MD
Livability — Aberdeen
- Score
- 81/100
- State rank
- #42
- US rank
- #1545
Category grades
Schools grade is shown separately in the Schools card above.
Census & demographics
- Census place
- Aberdeen, MD
- County
- Harford County · 198,512 people
- City population
- 27,168
- Metro
- Baltimore-Columbia-Towson, MD
- Population (ZIP)
- 27,168
- Household income
- $83,238
- Rent vs Own
- Severe rent burden
- 736.0
Population outlook (Harford County) Hauer SSP2
- Today (2025)
- 262,292 people
- By 2030
- 266,437 · +1.6%
- By 2040
- 269,954 · +2.9%
- By 2050
- 265,659 · +1.3%
- By 2075
- 252,886 · -3.6%
- By 2100
- 224,014 · -14.6%
Race, ethnicity, and origin ACS 2023
- Neighborhood character
- Diverse neighborhood (Simpson 0.62)
- Race & ethnicity
- White 54% Black 28% Hispanic / Latino 9% Two or more races 9% Asian 3%
- Hispanic origin (detail)
- Mexican 3% Puerto Rican 2% Dominican 1%
- Common ancestry
- Romanian 3% Slovak 1% Scotch-Irish 1%
- Foreign-born
- 8% · Canada, China, South Korea
- Languages at home
- 89% English-only · Spanish 4% Other Indo-European 1% German/W. Germanic 1%
Political lean MEDSL · Harford
- 2024 margin
- R (+13.8) · D 41.9% · R 55.7% · Other 2.4%
- 2008→2024 swing
- +5.0pp toward D · 2008: -18.8pp · 2024: -13.8pp
- All cycles
- 2024: R+13.8 2020: R+12.0 2016: R+24.5 2012: R+19.5 2008: R+18.8
Not yet ingested
- Civics
- —
Market trends
- HPI YoY
- ▼ -108.65%
- Current HPI
- 247.668
- Rent YoY
- ▲ 0.28%
- Metro
- Baltimore-Columbia-Towson, MD
- State GDP YoY
- ▲ 2.97%
- F500 in state
- 12
Industry mix (Fortune 500 HQ in MD)
| Industry | F500 HQs | Revenue |
|---|---|---|
| Aerospace / Defense | 1 | $71B |
|
||
| Utilities | 1 | $25B |
|
||
| Hotels | 1 | $24B |
|
||
| Consumer Goods | 1 | $7B |
|
||
| Real Estate | 1 | $6B |
|
||
| Chemicals | 1 | $2B |
|
||
Price history
-95.0% since first listed19 events — show timeline
- 2026-06-11 Sold (MLS) $195,000 BRIGHT MLS
- 2026-05-14 Pending — BRIGHT MLS
- 2026-05-06 Listed $200,000 BRIGHT MLS
- 2026-05-05 Coming Soon $200,000 BRIGHT MLS
- 2024-05-02 Rental Removed $1,800 Avail
- 2024-04-07 Listed for Rent $1,800 Avail
- 2016-11-08 Listing Removed — BRIGHT MLS
- 2016-11-08 Delisted — MRIS
- 2016-09-19 Price Changed — MRIS
- 2016-07-11 Listed — MRIS
- 2016-07-11 Listed $124,900 BRIGHT MLS
- 2007-01-09 Sold (MLS) $146,450 MRIS
- 2006-11-09 Delisted — MRIS
- 2006-08-04 Listed $146,900 MRIS
- 2006-05-11 Delisted — MRIS
- 2006-05-02 Delisted — MRIS
- 2006-02-13 Listed — MRIS
- 2005-10-17 Listed — MRIS
- 2004-05-27 Sold (Public Records) $3,876,000 Public Records
Property tax history
-0.6%/yrLatest (2024): $996 · +14121.4% YoY. Source: county tax records.
Cash-flow waterfall
monthlySold comps — $/sqft
last 12 mo · ≤1 miLoading sold comps…