900 Fairview Church Rd · Fulton, MS
Flood risk 1/10 · Minimal
- FEMA flood zone
- X (unshaded)
- Chance of flooding over 30 yrs
- 0.0%
- Est. flood insurance / yr
- $507 – $1,088
Fire risk 5/10 · Moderate
- Est. fire insurance / yr
- $1,241 – $2,305
Heat risk 5/10 · Moderate
- Hot days now (above 108°F)
- 7 days/yr
- Hot days in 30 yrs
- 19 days/yr
Wind risk 5/10 · Moderate
- Chance of severe wind over 30 yrs
- 23.0%
Air-quality risk 1/10 · Minimal
- Unhealthy air days now
- 0 days/yr
- Unhealthy air days in 30 yrs
- 0 days/yr
Risk factors via First Street. Map © Google.
Why this score? — see what drove the C- grade
The composite is a weighted blend of 9 inputs, each scored 0–100. Each bar is that input's sub-score; the figure is the points it added to the 100-point composite (weight × sub-score).
- Cash flow +15.8/30.0
- Appreciation +8.7/10.0
- ARV discount +7.5/15.0
- DSCR +4.9/10.0
- 1% rule +4.3/10.0
- Livability +3.2/5.0
- Schools +2.7/10.0
- Rent growth +2.5/5.0
- Condition / age +2.2/5.0
$124,900
🖨 Deal sheet (PDF) 📄 Offer letter ✓ Due diligence
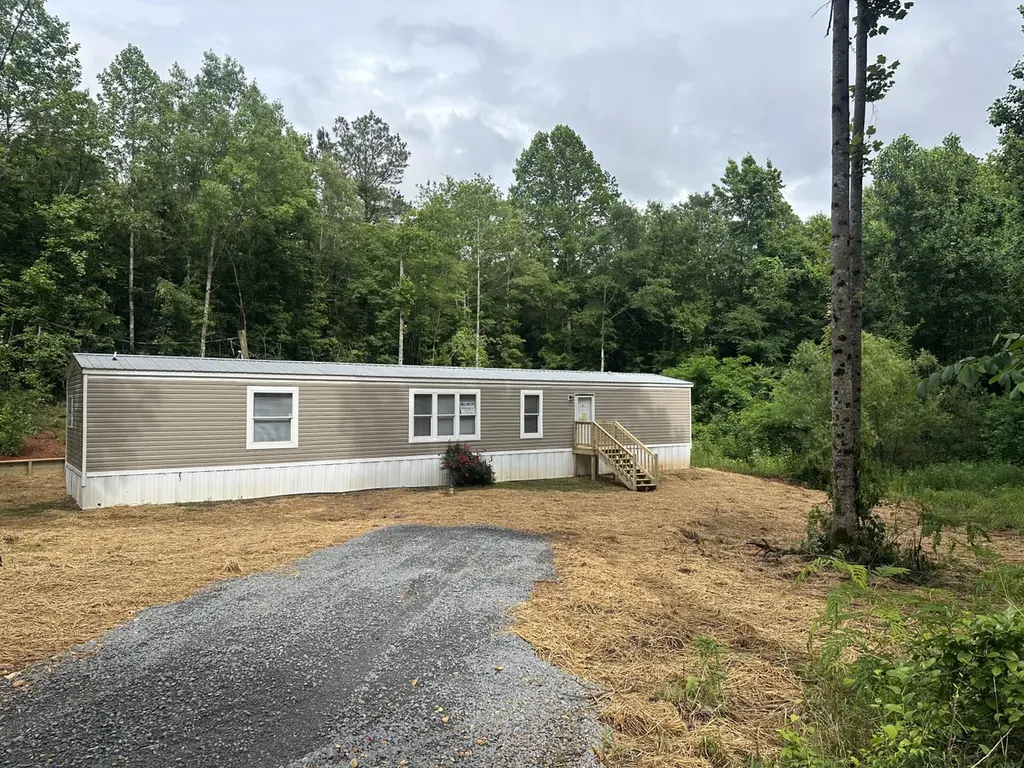
Listing remarks
Neat 3 bedroom 2 bath home sitting on a 2 acre lot in Itawamba county. Owner financing is available with approved credit. All information is believed to be accurate, subject to verification.
Key facts
- 2 acre lot
- Built 2021
- Listed 6 days
Property features AI
Finance
- Financial info: Annual tax approximately $900
Exterior
- Home design: Singlewide mobile home; One-story
- Exterior features: Approximately 2 acres
Interior
- Flooring: Carpet; Vinyl
- Bathrooms: 2 full bathrooms
- Heating & cooling: Electric heating; Central heating; Central air conditioning
- Interior features: Electric water heater
Neighborhood map
What this means for you Summary
Snapshot
- This is a 3-bed/2.0-bath other listed at $125k. Condition is rated fair.
Deal economics
- At list price, monthly cash flow is $56 ($677/yr) — positive.
- The deal already cash-flows at list — no discount required.
- To meet the 1% rule (rent ≥ 1% of price), the offer needs to be $116k (6.8% below list).
- Recommended offer: $116k (6.8% below list) — sets the bar for 1% rule.
Location & tenants
- Location reads 64/100 on livability (#133 in MS) — a middle-class / working-renter tenant base. Strengths: cost of living A+, housing A+, crime B+; Watch: employment D, amenities F, commute F.
- Itawamba County School District (rural): math 35% / reading 31% proficiency, ranked #58 of 130 in MS (top 45%) — families likely to look elsewhere, expect single-tenant / working-renter base with shorter leases.
- Zoned schools: Itawamba Attendance Center (math 37% / reading 34%, grade F, #150 of 375 statewide, top 40%, 1,163 students, 100% FRL); Itawamba Agricultural High School (math 32% / reading 32%, grade F, #80 of 197 statewide, top 42%, 556 students, 100% FRL) — zoned schools average 100% FRL vs 54% district-wide (45 pts higher); higher-poverty schools than district average — tighter screening recommended.
- Market conditions: 11 active listings in the ZIP; 4 units permitted in Itawamba County in 2024 (0 in 5+ unit buildings).
Forward outlook
- In year one you build about $10k of equity ($864 loan paydown + $9k appreciation (7.5% local appreciation)).
- Itawamba County population projected to shrink 4% by 2050 — rents likely to lag national; underwrite the cash flow, not the appreciation.
- At projected returns (7.5% appreciation + 3.0% rent growth), your $35k cash investment doubles in ~3 years — after that, you're playing with house money.
- By year 4, paydown + projected appreciation supports a ~$35k cash-out refi (75% LTV) — recoverable capital for the next deal without selling this one.
Negotiation context
- Only 6 days on market — expect competitive offers; lowballing is unlikely to land.
Risks & watch-outs
- Climate carrying-cost: moderate wind risk, 23% chance of damaging wind over 30y; moderate wildfire risk; extreme-heat days projected 7→19/yr by 2055 (HVAC capex compounding) — expect insurance premiums to compound above CPI over the hold.
Questions for the listing agent
- Have any recent inspections been done? Can we get a copy of the seller's disclosures and any deferred-maintenance estimates?
- Is there a deadline driving the sale (1031 exchange, divorce, estate, relocation)? That informs how much negotiation room exists.
- Schools are D-rated, which usually means shorter tenancies and higher turnover. Who's the typical renter profile here, and what's been the actual vacancy rate?
- What's the average days-on-market for RENTAL listings here right now (not sales)? A rising rental-DOM trend means longer vacancies and softer asking-rent achievability than the comps imply.
- What's the recent tenant-quality profile in this submarket — average credit score on applications, eviction rate, late-payment / NSF rate, and stable-employment percentage? A property-management company in the area should have these aggregated.
- How much new for-sale + rental construction is in the pipeline within 1–3 miles? Heavy new supply typically softens prices + rents 12–24 months out; constrained supply supports both.
Investment metrics
- 1% rule
- 0.93% ✗
- Cap rate
- 6.84%
- Cash-on-cash
- 1.94%
- DSCR
- 1.09
- GRM
- 8.9
CMA / ARV
No comps found within radius.
Projected returns pro-forma
7.46% appreciation · 3.0% rent growth · sell at horizon
- IRR
- 20.3%
- Equity multiple
- 2.45×
- Total profit
- $50,804
- Equity at exit
- $90,358
- IRR
- 19.0%
- Equity multiple
- 5.14×
- Total profit
- $144,760
- Equity at exit
- $175,202
Cash invested: $34,972 (down + closing). Projections, not guarantees.
Landlord ↔ Tenant lean methodology
- Overall (STATE)
- 90 Strongly Landlord-Friendly
- State Mississippi
- 90 Strongly Landlord-Friendly · R+11
- County
- — inherits STATE
- City
- — inherits STATE
ZIP-level market 38847
- Home prices YoY
- 4.9%
- Active inventory
- 11
- Price-to-rent
- 8.9×
Monthly cashflow live
- Estimated rent
- $1,164 medium interval (Pro) →
- Mortgage (P&I)
- −$655
- Tax est. 1.5%
- −$156 /mo · $1,874/yr
- Insurance
- −$52
- HOA
- −$0
- Vacancy / Maint / Mgmt
- −$244
- Net cashflow
- $56
Break-even live
Sensitivity live
| Price | -10% $143 | -5% $100 | +0% $56 | +5% $13 | +10% $-30 |
|---|---|---|---|---|---|
| Rent | -10% $-36 | -5% $10 | +0% $56 | +5% $102 | +10% $148 |
| Rate | -1.0pp $119 | -0.5pp $88 | base $56 | +0.5pp $24 | +1.0pp $-9 |
UW: 25.0% down · 7.5% · 30yr · 1.5% tax · 5.0% vac · 8.0% maint · 8.0% mgmt
Financing live
Cash to close
- Down payment
- $31,225
- Closing costs
- $3,747
- Reserves months
- —
- Total cash needed
- —
Loan-product check · same deal, 3 products live
Conventional
25% down · 7.5% · 30yr
- Down + closing
- —
- Monthly P&I
- —
- Monthly cashflow
- —
- DSCR
- —
- Eligible?
- —
Personal DTI + credit; lowest rate.
DSCR
20% down · 8.5% · 30yr
- Down + closing
- —
- Monthly P&I
- —
- Monthly cashflow
- —
- DSCR
- —
- Eligible?
- —
No personal income docs; deal must DSCR.
Hard money
10% down · 12.0% · 12mo
- Down + closing
- —
- Monthly P&I
- —
- Monthly cashflow
- —
- DSCR
- —
- Eligible?
- —
Short-term bridge; refi at stabilization.
Listing history 2 events
-
2026-06-01status $124,900 Pending 6 DOM
-
2026-05-20$124,900 Active
ⓘ Source: listings_history table (triggers on properties + properties_extension) + one-shot
backfill from property_details.listing_events for pre-trigger history.
Climate risk First Street
- Flood 1/10 Low FEMA zone X (unshaded) · 0% chance over 30 yrs
- Wildfire 5/10 Major
- Heat 5/10 Major 7 d/yr ≥108°F today · 19 d/yr by 30 yrs out
- Wind 5/10 Major 23% chance of damaging wind over 30 yrs
- Air quality 1/10 Low 0 unhealthy d/yr today · 0 by 30 yrs out
Nearby sold comps map
Loading sold comps map…
Walkable amenities ~0.75 mi
Loading nearby amenities…
Taxation est. · year 1
- Rental income
- $13,968
- − Mortgage interest
- −$6,996
- − Property taxes
- −$1,874
- − Insurance
- −$624
- − Repairs & maintenance
- −$1,117
- − Management
- −$1,117
- − Depreciation
- −$3,633
- Taxable loss
- −$1,394
- Est. tax savings @ 24.0%
- +$335
- After-tax cash flow
- $1,012/yr
For passive investors: Depreciation is non-cash, so a rental often shows a tax loss while cash-flowing — sheltering income. Rental losses are passive: they offset passive income freely, and up to $25,000/yr can offset ordinary (W-2) income if you actively participate and your MAGI is under $100k (phasing out to $0 by $150k); unused losses carry forward. On sale, claimed depreciation is recaptured at up to 25%, and gains may owe capital-gains tax (a 1031 exchange can defer both). Figures are a year-1 estimate at your 24.0% rate — not tax advice; consult a CPA.
Condition & rehab AI · 2 photos
The property requires moderate repairs to the exterior and landscaping, but has good interior and systems. Landscaping and exterior painting would significantly enhance its value.
Repairs flagged
- Major siding — Significant wear and tear
- Major landscaping — Overgrown vegetation
Value-add opportunities
- Both landscaping — Enhances curb appeal and property value
- Both paint exterior — Improves curb appeal and property value
Renovation cost estimate screening
| Repair item | Severity | Est. cost |
|---|---|---|
| siding · Significant wear and tear | Major | $15,000–50,000 |
| landscaping · Overgrown vegetation | Major | $15,000–50,000 |
| Total estimated repair cost · 2 items | $30,000–100,000 |
Value-add ROI direction
- Both landscaping — Enhances curb appeal and property value ↑
- Both paint exterior — Improves curb appeal and property value ↑
ⓘ Cost ranges are severity-bucket heuristics (US national rule-of-thumb). Get contractor quotes + a written scope before underwriting a rehab budget.
Schools (NCES district)
- District
- Itawamba County School District
- NCES district ID
- 2802100
- Math proficiency
- 35% ▼ -19.00%
- Reading proficiency
- 31% ▼ -14.00%
- Median HH income
- $37,158
- Composite
- 27.48/100
- National rank
- #6956
- State rank
- #58 of 130 in MS
Livability — Fulton
- Score
- 64/100
- State rank
- #133
- US rank
- #14332
Category grades
Schools grade is shown separately in the Schools card above.
Census & demographics
- Population (ZIP)
- 3,528
Population outlook (Itawamba County) Hauer SSP2
- Today (2025)
- 24,011 people
- By 2030
- 23,999 · +-0.0%
- By 2040
- 23,738 · -1.1%
- By 2050
- 22,962 · -4.4%
- By 2075
- 20,240 · -15.7%
- By 2100
- 16,503 · -31.3%
Race, ethnicity, and origin ACS 2023
- Neighborhood character
- Predominantly White (96%)
- Race & ethnicity
- White 96% Hispanic / Latino 4%
- Common ancestry
- Slovak 1%
- Foreign-born
- 0%
- Languages at home
- 96% English-only · Spanish 4%
Political lean MEDSL · Itawamba
- 2024 margin
- Solid R (+80.0) · D 9.7% · R 89.7%
- 2008→2024 swing
- -23.9pp toward R · 2008: -56.1pp · 2024: -80.0pp
- All cycles
- 2024: R+80.0 2020: R+75.6 2016: R+75.6 2012: R+61.0 2008: R+56.1
Not yet ingested
- Civics
- —
Market trends
- HPI YoY
- ▲ 7.46%
- Current HPI
- 159.4479
- Rent YoY
- —
- Metro
- —
- State GDP YoY
- —
- F500 in state
- 0
Price history
1 event — show timeline
- 2026-05-20 Listed $124,900 NEMSBD
Cash-flow waterfall
monthlySold comps — $/sqft
last 12 mo · ≤1 miLoading sold comps…