122 N Panuco Dr · Westwood Shores, TX
Flood risk 1/10 · Minimal
- FEMA flood zone
- —
- Chance of flooding over 30 yrs
- 0.0%
- Est. flood insurance / yr
- —
Fire risk 3/10 · Minor
- Est. fire insurance / yr
- $1,222 – $2,270
Heat risk 8/10 · Major
- Hot days now (above 111°F)
- 7 days/yr
- Hot days in 30 yrs
- 24 days/yr
Wind risk 8/10 · Major
- Chance of severe wind over 30 yrs
- 99.0%
Air-quality risk 1/10 · Minimal
- Unhealthy air days now
- 0 days/yr
- Unhealthy air days in 30 yrs
- 0 days/yr
Risk factors via First Street. Map © Google.
Why this score? — see what drove the B+ grade
The composite is a weighted blend of 9 inputs, each scored 0–100. Each bar is that input's sub-score; the figure is the points it added to the 100-point composite (weight × sub-score).
- Cash flow +30.0/30.0
- ARV discount +11.4/15.0
- DSCR +10.0/10.0
- 1% rule +9.0/10.0
- Appreciation +4.7/10.0
- Livability +3.1/5.0
- Rent growth +2.5/5.0
- Condition / age +2.5/5.0
- Schools +2.3/10.0
$79,000
🖨 Deal sheet (PDF) 📄 Offer letter ✓ Due diligence
Listing remarks MLS
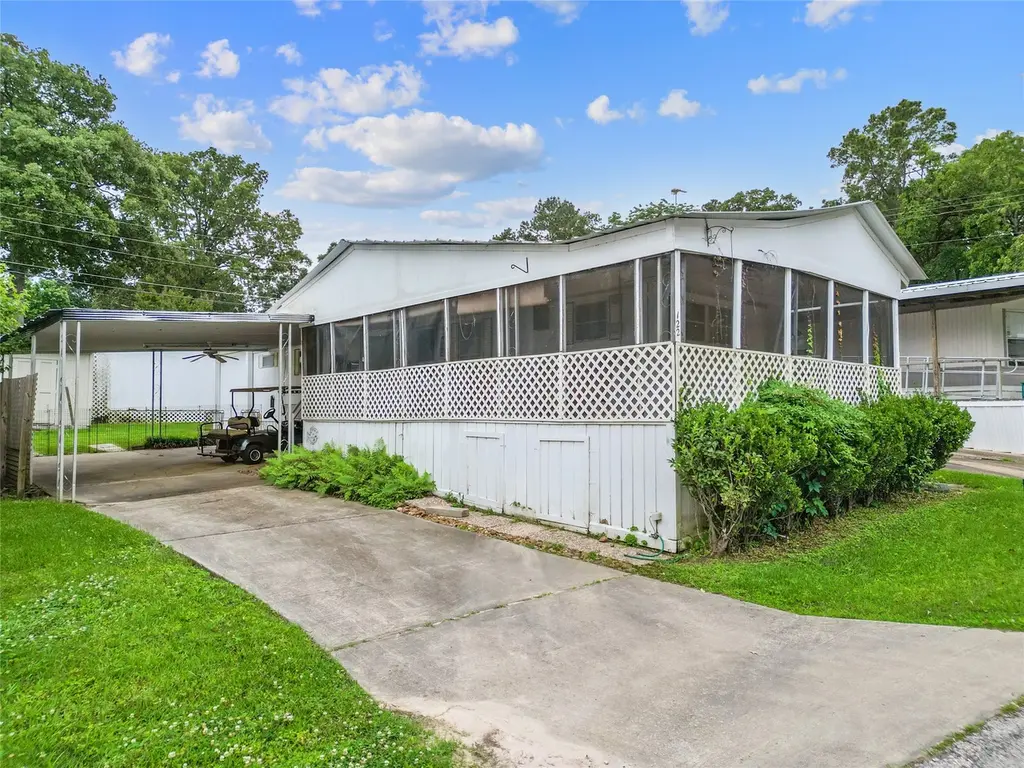
Enjoy lake living with this charming 3-bedroom, 1.5-bath home located just steps from Lake Livingston, offering convenient lake and boat ramp access along with an included boat slip. A spacious wraparound front porch sets the tone for relaxed living and provides the perfect space to unwind and enjoy a view of the water or entertain. The fully fenced backyard adds privacy and room to enjoy the outdoors, while the covered carport offers sheltered parking and everyday convenience. In addition you will also have access to your private covered boat stall with a working lift. Whether you're seeking a peaceful weekend escape or a full-time residence near the water, this property delivers comfort, charm, and access to all the recreational opportunities Lake Livingston has to offer. Schedule your private tour today!
Key facts
- Covered carport
- Lake access
- Boat ramp access
Tags
Neighborhood map
What this means for you Summary
Snapshot
- This is a 3-bed/1.5-bath manufactured listed at $79k.
Deal economics
- At list price, monthly cash flow is $328 ($4k/yr) — positive.
- The deal already cash-flows at list — no discount required.
- Meets the 1% rule at list price ($1k rent vs $79k).
- Recommended offer: $72k (9.0% below list) — sets the bar for market timing.
- Cap rate 11.3% vs local median 3.4% in Westwood Shores — top-decile yield for the area; either an underpriced asset or a hidden risk that comps aren't pricing in. Stress-test before assuming the spread holds.
Location & tenants
- Location reads 62/100 on livability (#914 in TX) — a middle-class / working-renter tenant base. Strengths: crime A+, cost of living A+, housing A+; Watch: amenities F, commute F, health & safety F.
- Trinity ISD (rural): math 27% / reading 29% proficiency, ranked #682 of 826 in TX (top 83%) — low school quality limits family demand, transient renter base, plan for 1-2y turnover.
- Zoned schools: Lansberry El (math 35% / reading 33%, grade F, #2,149 of 4,322 statewide, top 50%, 570 students, 91% FRL); Trinity J H (math 21% / reading 25%, grade F, #1,327 of 1,662 statewide, top 81%, 280 students, 91% FRL); Trinity H S (math 22% / reading 32%, grade F, #1,204 of 1,632 statewide, top 75%, 350 students, 84% FRL) — zoned schools average 89% FRL vs 50% district-wide (38 pts higher); higher-poverty schools than district average — tighter screening recommended.
- Market conditions: 472 active listings in the ZIP; 1 units permitted in Trinity County in 2024 (0 in 5+ unit buildings).
Forward outlook
- In year one you build about $138 of equity ($546 loan paydown + $-408 appreciation (-0.5% local appreciation)).
- Trinity County population projected at -13% by 2050 — secular population decline; favor cash flow + early exit over multi-decade hold.
- At projected returns (-0.5% appreciation + 3.0% rent growth), your $22k cash investment doubles in ~5 years — after that, you're playing with house money.
Negotiation context
- It's been on market 103 days — a 9% lower offer ($72k) is reasonable based on typical stale-listing flexibility.
- 2 sale attempts with the ask held roughly flat each time — persistent listings suggest the price (not the market) is what's stuck; bring a comps-based counter.
Risks & watch-outs
- Climate carrying-cost: severe wind risk, 99% chance of damaging wind over 30y; extreme-heat days projected 7→24/yr by 2055 (HVAC capex compounding) — expect insurance premiums to compound above CPI over the hold.
Questions for the listing agent
- It's been on market 103 days. Have you received any prior offers? Is the seller open to a 9% concession, seller financing, or rate buy-down credit?
- Built in 1975 — when were the roof, HVAC, electrical panel, plumbing, and water heater last replaced?
- What does the HOA fee cover, when was the last increase, and are there any pending special assessments or reserve-fund shortfalls?
- Why hasn't it sold? Are there any deal-killer items the seller is aware of (foundation, flood, title, zoning, code violations)?
- Is there a deadline driving the sale (1031 exchange, divorce, estate, relocation)? That informs how much negotiation room exists.
- Schools are F-rated, which usually means shorter tenancies and higher turnover. Who's the typical renter profile here, and what's been the actual vacancy rate?
- What's the average days-on-market for RENTAL listings here right now (not sales)? A rising rental-DOM trend means longer vacancies and softer asking-rent achievability than the comps imply.
- What's the recent tenant-quality profile in this submarket — average credit score on applications, eviction rate, late-payment / NSF rate, and stable-employment percentage? A property-management company in the area should have these aggregated.
- How much new for-sale + rental construction is in the pipeline within 1–3 miles? Heavy new supply typically softens prices + rents 12–24 months out; constrained supply supports both.
Investment metrics
- 1% rule
- 1.40% ✓
- Cap rate
- 11.27%
- Cash-on-cash
- 17.77%
- DSCR
- 1.79
- GRM
- 6.0
CMA / ARV
- ARV (median comp)
- $86,467
- List price
- $79,000
- Delta
- -8.64%
- Verdict
- FAIR
- Comps
- 2 within 1.0 mi
Show comp detail 1 sale within ~0.75 mi
| Address | Dist | Beds/Ba | Sqft | Sold | Price | $/sf | Match |
|---|---|---|---|---|---|---|---|
| 135 Panuco Dr | 0.07mi | 2/1.0 (-1) | 700 (-6%) | 11mo | $95,000 | $136 | 71 |
Match score weights: distance 35% · size 25% · config 20% · recency 20%. Top-matched comps best support the ARV.
Projected returns pro-forma
-0.52% appreciation · 3.0% rent growth · sell at horizon
- IRR
- 16.1%
- Equity multiple
- 1.75×
- Total profit
- $16,671
- Equity at exit
- $20,918
- IRR
- 21.3%
- Equity multiple
- 3.25×
- Total profit
- $49,720
- Equity at exit
- $23,584
Cash invested: $22,120 (down + closing). Projections, not guarantees.
Landlord ↔ Tenant lean methodology
- Overall (STATE)
- 87 Strongly Landlord-Friendly
- State Texas
- 87 Strongly Landlord-Friendly · R+5
- County
- — inherits STATE
- City
- — inherits STATE
ZIP-level market 75862
- Home prices YoY
- -0.3%
- Active inventory
- 472
- Price-to-rent
- 6.0×
Monthly cashflow live
- Estimated rent
- $1,106 medium interval (Pro) →
- Mortgage (P&I)
- −$414
- Tax from tax record
- −$41 /mo · $488/yr
- Insurance
- −$33
- HOA
- −$58
- Vacancy / Maint / Mgmt
- −$232
- Net cashflow
- $328
Break-even live
Sensitivity live
| Price | -10% $372 | -5% $350 | +0% $328 | +5% $305 | +10% $283 |
|---|---|---|---|---|---|
| Rent | -10% $240 | -5% $284 | +0% $328 | +5% $371 | +10% $415 |
| Rate | -1.0pp $367 | -0.5pp $348 | base $328 | +0.5pp $307 | +1.0pp $286 |
UW: 25.0% down · 7.5% · 30yr · 1.5% tax · 5.0% vac · 8.0% maint · 8.0% mgmt
Financing live
Cash to close
- Down payment
- $19,750
- Closing costs
- $2,370
- Reserves months
- —
- Total cash needed
- —
Loan-product check · same deal, 3 products live
Conventional
25% down · 7.5% · 30yr
- Down + closing
- —
- Monthly P&I
- —
- Monthly cashflow
- —
- DSCR
- —
- Eligible?
- —
Personal DTI + credit; lowest rate.
DSCR
20% down · 8.5% · 30yr
- Down + closing
- —
- Monthly P&I
- —
- Monthly cashflow
- —
- DSCR
- —
- Eligible?
- —
No personal income docs; deal must DSCR.
Hard money
10% down · 12.0% · 12mo
- Down + closing
- —
- Monthly P&I
- —
- Monthly cashflow
- —
- DSCR
- —
- Eligible?
- —
Short-term bridge; refi at stabilization.
HOA detail
- Monthly dues
- $58 · $696/yr
- Likely covers
- water
Listing history 21 events
-
2026-06-22days on market $79,000 Active 103 DOM
-
2026-06-19days on market $79,000 Active 101 DOM
-
2026-06-18days on market $79,000 Active 100 DOM
-
2026-06-17days on market $79,000 Active 99 DOM
-
2026-06-16days on market $79,000 Active 98 DOM
-
2026-06-15days on market $79,000 Active 97 DOM
-
2026-06-14days on market $79,000 Active 95 DOM
-
2026-06-13days on market $79,000 Active 94 DOM
-
2026-06-10days on market $79,000 Active 92 DOM
-
2026-06-09days on market $79,000 Active 91 DOM
-
2026-06-08days on market $79,000 Active 90 DOM
-
2026-06-07days on market $79,000 Active 89 DOM
-
2026-06-05days on market $79,000 Active 86 DOM
-
2026-06-02days on market $79,000 Active 84 DOM
-
2026-06-01days on market $79,000 Active 83 DOM
-
2026-05-31days on market $79,000 Active 82 DOM
-
2026-05-30days on market $79,000 Active 81 DOM
-
2026-03-10$79,000 Active 818-char remark
Show marketing remark (818 chars)
Enjoy lake living with this charming 3-bedroom, 1.5-bath home located just steps from Lake Livingston, offering convenient lake and boat ramp access along with an included boat slip. A spacious wraparound front porch sets the tone for relaxed living and provides the perfect space to unwind and enjoy a view of the water or entertain. The fully fenced backyard adds privacy and room to enjoy the outdoors, while the covered carport offers sheltered parking and everyday convenience. In addition you will also have access to your private covered boat stall with a working lift. Whether you're seeking a peaceful weekend escape or a full-time residence near the water, this property delivers comfort, charm, and access to all the recreational opportunities Lake Livingston has to offer. Schedule your private tour today!
-
2025-12-01historical
-
2025-07-14price $79,000
-
2025-05-02$85,000 Active
ⓘ Source: listings_history table (triggers on properties + properties_extension) + one-shot
backfill from property_details.listing_events for pre-trigger history.
Tax reassessment forecast TX · Resets to sale price
- Current annual tax
- $488 · $41/mo
- Projected year-2 tax
- $1,446 · $120/mo
- Expected delta
- +$958/yr (+$80/mo · 196.1%)
ⓘ Screening estimate from a state-policy table — verify with the county assessor before closing.
Climate risk First Street
- Flood 1/10 Low 0% chance over 30 yrs
- Wildfire 3/10 Moderate
- Heat 8/10 Severe 7 d/yr ≥111°F today · 24 d/yr by 30 yrs out
- Wind 8/10 Severe 99% chance of damaging wind over 30 yrs
- Air quality 1/10 Low 0 unhealthy d/yr today · 0 by 30 yrs out
Nearby sold comps map
Loading sold comps map…
Walkable amenities ~0.75 mi
Loading nearby amenities…
Taxation est. · year 1
- Rental income
- $13,268
- − Mortgage interest
- −$4,425
- − Property taxes
- −$488
- − Insurance
- −$395
- − Repairs & maintenance
- −$1,061
- − Management
- −$1,061
- − HOA
- −$696
- − Depreciation
- −$2,298
- Taxable income
- $2,843
- Est. tax owed @ 24.0%
- −$682
- After-tax cash flow
- $3,249/yr
For passive investors: Depreciation is non-cash, so a rental often shows a tax loss while cash-flowing — sheltering income. Rental losses are passive: they offset passive income freely, and up to $25,000/yr can offset ordinary (W-2) income if you actively participate and your MAGI is under $100k (phasing out to $0 by $150k); unused losses carry forward. On sale, claimed depreciation is recaptured at up to 25%, and gains may owe capital-gains tax (a 1031 exchange can defer both). Figures are a year-1 estimate at your 24.0% rate — not tax advice; consult a CPA.
Schools (NCES district)
- District
- Trinity ISD
- NCES district ID
- 4843200
- Math proficiency
- 27% ▼ -2.00%
- Reading proficiency
- 29% ▲ 1.00%
- Median HH income
- $37,104
- Composite
- 23.31/100
- National rank
- #7919
- State rank
- #682 of 826 in TX
Livability — Westwood Shores
- Score
- 62/100
- State rank
- #914
- US rank
- #16347
Category grades
Schools grade is shown separately in the Schools card above.
Census & demographics
- Population (ZIP)
- 10,030
Population outlook (Trinity County) Hauer SSP2
- Today (2025)
- 13,746 people
- By 2030
- 13,333 · -3.0%
- By 2040
- 12,542 · -8.8%
- By 2050
- 11,942 · -13.1%
- By 2075
- 10,871 · -20.9%
- By 2100
- 9,784 · -28.8%
Race, ethnicity, and origin ACS 2023
- Neighborhood character
- Predominantly White (74%)
- Race & ethnicity
- White 74% Hispanic / Latino 12% Black 10% Two or more races 7%
- Hispanic origin (detail)
- Mexican 11%
- Common ancestry
- Lithuanian 3% Serbian 2% Slovak 2%
- Foreign-born
- 4% · Canada
- Languages at home
- 89% English-only · Spanish 9% French/Haitian/Cajun 2%
Political lean MEDSL · Trinity
- 2024 margin
- Solid R (+67.0) · D 16.2% · R 83.2%
- 2008→2024 swing
- -31.3pp toward R · 2008: -35.7pp · 2024: -67.0pp
- All cycles
- 2024: R+67.0 2020: R+61.3 2016: R+59.9 2012: R+46.9 2008: R+35.7
Not yet ingested
- Civics
- —
Market trends
- HPI YoY
- ▼ -0.52%
- Current HPI
- 174.6638
- Rent YoY
- —
- Metro
- —
- State GDP YoY
- ▲ 3.95%
- F500 in state
- 110
Industry mix (Fortune 500 HQ in TX)
| Industry | F500 HQs | Revenue |
|---|---|---|
| Energy | 16 | $1,198B |
|
||
| Technology | 5 | $198B |
|
||
| Engineering / Construction | 4 | $72B |
|
||
| Energy Services | 3 | $60B |
|
||
| Utilities | 3 | $41B |
|
||
| Healthcare | 2 | $330B |
|
||
Price history
-7.1% since first listed4 events — show timeline
- 2026-03-10 Listed $79,000 HARMLS
- 2025-12-01 Listing Removed — HARMLS
- 2025-07-14 Price Changed $79,000 HARMLS
- 2025-05-02 Listed $85,000 HARMLS
Property tax history
+1.6%/yrLatest (2025): $488 · +4.5% YoY. Source: county tax records.
Cash-flow waterfall
monthlySold comps — $/sqft
last 12 mo · ≤1 miLoading sold comps…